

Abstract
HOTAIRM1 is a long intergenic non-coding RNA encoded in the human HOXA gene cluster, with gene expression highly specific for maturing myeloid cells. Knockdown of HOTAIRM1 in the NB4 acute promyelocytic leukemia cell line retarded all-trans retinoid acid (ATRA)-induced granulocytic differentiation, resulting in a significantly larger population of immature and proliferating cells that maintained cell cycle progression from G1 to S phases. Correspondingly, HOTAIRM1 knockdown resulted in retained expression of many otherwise ATRA-suppressed cell cycle and DNA replication genes, and abated ATRA induction of cell surface leukocyte activation, defense response, and other maturation-related genes. Resistance to ATRA-induced cell cycle arrest at the G1/S phase transition in knockdown cells was accompanied by retained expression of ITGA4 (CD49d) and decreased induction of ITGAX (CD11c). The coupling of cell cycle progression with temporal dynamics in the expression patterns of these integrin genes suggests a regulated switch to control the transit from the proliferative phase to granulocytic maturation. Furthermore, ITGAX was among a small number of genes showing perturbation in transcript levels upon HOTAIRM1 knockdown even without ATRA treatment, suggesting a direct pathway of regulation. These results indicate that HOTAIRM1 provides a regulatory link in myeloid maturation by modulating integrin-controlled cell cycle progression at the gene expression level.
Keywords: long noncoding RNA, gene expression, cell cycle, integrin, myelopoiesis, myeloid, granulocyte, HOX cluster
Introduction
Long intergenic non-coding RNAs (lincRNAs) are emerging as a class of key regulators of mammalian gene expression, joining microRNAs, histone modifications, and transcription factors to direct gene expression patterns related to cell fate decisions.1 lincRNAs, which are induced during many different development programs, are crucial links in the modulation of gene expression underlying those processes and deregulated expression has been described in cancer and a variety of neurological, cardiovascular, and developmental disorders.2,3
The human genome contains four HOX clusters (HOXA,B,C,D) that likely arose from a single ancestral cluster.4,5 These transcription factor genes, named for their common homeobox domain, are best known as evolutionarily conserved regulators of embryonic body patterning and development.6,7 HOX genes of the A and B paralog groups have emerged as a class of key transcriptional regulators in definitive hematopoiesis.8-10 Both the HOXA9 and HOXA10 genes are expressed in mature neutrophils and regulate the transcription of phagocyte function genes.11-13 HOX genes also contribute to the pathogenesis of acute leukemia and the self-renewal capacity of leukemia stem cells.12,14,15
Within the four paralogous clusters of human HOX genes, lincRNAs constitute a newly recognized but probably more abundant intergenic transcription activity than the better-defined microRNAs, such as the miRNA-10 and miRNA-196 families.16,17 lincRNAs within human HOX gene clusters are among the first non-coding RNAs shown to function as direct regulators of cellular functions.17-20 HOTAIR (HOX antisense intergenic RNA), the first to be characterized, is located in the HOXC gene cluster but regulates the remote HOXD cluster and a network of discrete non-HOX gene loci by recruiting elements of the histone-modifying PRC2 and LSD1 complexes.17-20 Three other lincRNAs have been characterized in the human HOXA gene cluster. We previously reported HOTAIRM1, located at the 3′ end of the HOXA cluster, as a myeloid-specific lincRNA, upregulated during myeloid maturation.16 HOTTIP, transcribed from the 5′ end of the HOXA gene cluster, enhances expression of neighboring 5′ HOXA genes, most prominently HOXA13.21 Mistral, a murine lincRNA located between Hoxa6 and Hoxa7, is induced by retinoic acid and promotes mouse embryonic stem cell differentiation by activating the neighboring Hoxa6 and Hoxa7 genes.22
Although the biochemical mechanisms of HOX lincRNA functions remain incompletely understood, those so far characterized share the common feature of providing an inducible scaffold for epigenetic modification at distinct gene loci, that include (but are not limited to) their neighboring HOX regions.20 The gene encoding HOTAIRM1 is located adjacent and antisense to the transcription start site of HOXA1 in the 3′ HOXA cluster and, although independently regulated, its transcription is initiated from the shared promoter segment embedded in a CpG island between the two genes. This arrangement is a common genomic feature of lincRNAs residing in HOX gene clusters and many other developmentally important gene loci.23-27 HOTAIRM1 is specifically expressed in the myeloid lineage, most highly in the terminal stage of granulocytic differentiation.16 The neighboring HOXA genes are essential for the development of myeloid lineage cells during both embryonic and adult stages.12,14
We hypothesized that HOTAIRM1 could take part in the regulation of myeloid maturation through modulation of gene expression in the myeloid program. In this study, we sought to explore the perturbations in cellular phenotype and gene expression caused by the knockdown of HOTAIRM1 expression during all-trans retinoid acid (ATRA)-induced granulocytic maturation of human acute promyelocytic leukemia NB4 cells, a well-defined in vitro myeloid maturation model,28,29 in which HOTAIRM1 is dramatically induced by ATRA.16
Results
HOTAIRM1 knockdown decreases granulocytic maturation in NB4 cells
Analysis of data from our prior studies and public databases16,36 showed that expression of HOTAIRM1 is highly myeloid-specific and associated with myeloid maturation. HOTAIRM1 expression first appeared in normal bone marrow at the promyelocyte stage and rose during maturation, to a maximum level in mature neutrophils (Fig. S1), whereas its expression was present but low in acute myeloid leukemia bone marrows (Fig. S2). We have previously demonstrated that HOTAIRM1 is significantly induced during ATRA-induced granulocytic differentiation of the NB4 human acute promyelocytic leukemia cell line.16 NB4 has been widely used as a model of myeloid maturation in which morphogenic signals such as ATRA induce growth arrest at the G1 phase and terminal myeloid differentiation.28,37
HOTAIRM1 knockdown in NB4 cells was mediated by lentiviral vectors expressing shRNAs targeting HOTAIRM1 in stably transduced NB4 clones. Consistent knockdown of HOTAIRM1 transcripts by at least 70% was achieved in both untreated and ATRA-induced cells throughout the maturation process (Fig. 1A). Prior to ATRA induction, there was no apparent alteration in the growth (Fig. 1B) or morphology (data not shown) between knockdown and control cells. However, ATRA-induced granulocytic maturation was diminished in the knockdown NB4 cells, which showed attenuation of growth inhibition by ATRA (Fig. 1B) and a shift in the distribution cell morphology toward a higher percentage of immature myeloid precursors (Fig. 1C).
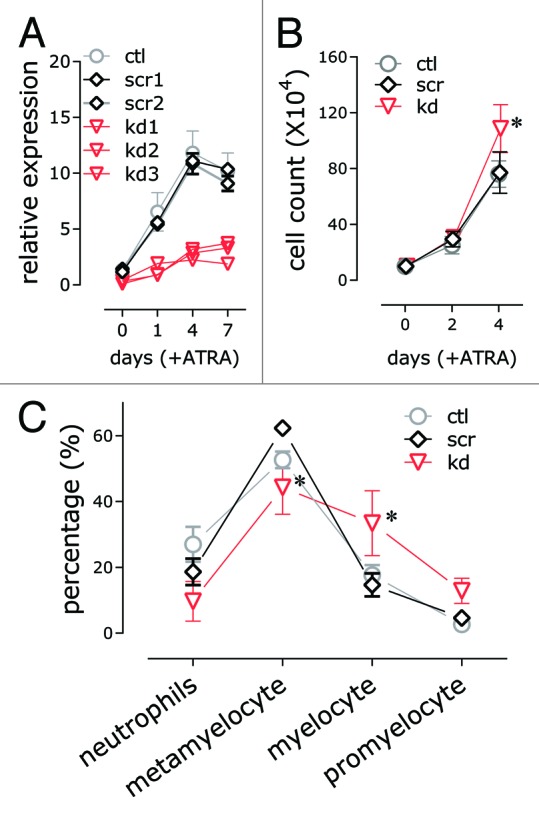
Figure 1. Effects of HOTAIRM1 knockdown on growth and differentiation of ATRA-induced NB4 cells. (A) Quantitative RT-PCR measurement of HOTAIRM1 knockdown in NB4 cell lines transfected by lentiviral vectors expressing the indicated HOTAIRM1-targeting shRNAs. HOTAIRM1 RNA levels were determined at the indicated days of ATRA induction (mean ± SD; n = 3); (B) Growth curves shown as total cell counts at the indicated days of ATRA induction (mean ± SD, n = 3–9; * P < 0.05, two-way ANOVA Holm–Sidak post-hoc test); (C) Leukocyte differential counts of knockdown and control NB4 cells at day 4 of ATRA induction (mean ± SD, n = 3–9; * P < 0.05, two-way ANOVA Holm–Sidak post-hoc test).
HOTAIRM1 knockdown moderates ATRA-induced alterations in gene expression
Genome-wide gene expression profiles of HOTAIRM1 knockdown and control NB4 cells, before and after ATRA-induced granulocytic differentiation for 4 d, were captured using oligonucleotide arrays. Without induction by ATRA, only a very small number of genes showed statistically significant but modest magnitude differences between HOTAIRM1 knockdown and control cells (Table 1). Most of these genes encode membrane proteins, many of which are involved in hematopoiesis. The most significant decreases in knockdown cells were observed in genes encoding the Charcot-Leyden crystal protein (CLC) and integrin α X/CD11c (ITGAX, discussed below), which play roles in myeloid cell maturation and lineage specification.42-44 Upregulation of MS4A3, one of the few genes with significantly increased expression in knockdown cells, was confirmed by quantitative RT-PCR (Fig. 2C). This gene encodes membrane-spanning 4-domains, subfamily A, member 3, which has been implicated as a modulator of G1-S cell cycle transition in hematopoietic lineage-specific control of S phase progression.45,46 The genes with differential expression in uninduced cells are also among those showing the greatest differential expression between the knockdown and control cells after ATRA induction, as presented below.
Table 1. Differentially expressed genes upon HOTAIRM1 knockdown in uninduced NB4 cells.
| Gene symbol | Log fold change* | P value |
|---|---|---|
| MS4A3 | 0.981 | 2.2E-02 |
| CCDC112 | 0.685 | 9.8E-03 |
| ENST00000429695 | 0.820 | 1.3E-02 |
| ENST00000458976 | 1.492 | 3.1E-02 |
| CD52 | -1.955 | 1.3E-02 |
| CD84 | -1.018 | 1.1E-02 |
| SELL | -2.552 | 4.9E-02 |
| ALOX5AP | -2.679 | 8.7E-03 |
| GNG2 | -1.400 | 4.0E-02 |
| ABHD2 | -1.020 | 4.5E-02 |
| ST20 | -0.764 | 2.1E-02 |
| ITGAX | -1.298 | 1.3E-02 |
| COTL1 | -0.779 | 4.5E-02 |
| ICAM1 | -1.682 | 1.4E-02 |
| CLC | -2.432 | 1.4E-02 |
| ID2 | -1.346 | 3.7E-02 |
| CCR1 | -1.292 | 1.3E-02 |
| ENST00000473436 | -0.704 | 3.5E-02 |
| CYFIP2 | -0.840 | 2.2E-02 |
| IPCEF1 | -0.857 | 2.6E-02 |
| NCF1 | -2.278 | 4.3E-02 |
| POR | -0.732 | 2.4E-02 |
| NCF1 | -1.533 | 4.9E-02 |
| ROR2 | -0.904 | 7.4E-04 |
| GPR34 | -1.199 | 8.3E-03 |
| HLA-J | -0.879 | 2.2E-02 |
| PSMB9 | -1.059 | 4.7E-02 |
Compared with scramble shRNA-expressing controls.

Figure 2. Comparison of transcription profiles of ATRA-induced granulocytic differentiation in HOTAIRM1 knockdown and control NB4 cells. (A) Principal component analysis (left) and scatter plots of log ratios (right) of ATRA-induced gene expression changes in knockdown and control cells (red, significantly upregulated genes; blue, significant downregulated). In the scatter plots, b indicates slope (i.e., dissimilarity) and r2 represents the square of the correlation coefficient(fitness); (B) Hierarchical clustering of genes for which expression in ATRA-induced NB4 cells was significantly altered by HOTAIRM1 knockdown, as evaluated by moderated t tests between knockdown and scramble control. Each column of the heat map presents data from an independent control or knockdown clone. The bars on the left margin indicates genes for which HOTAIRM1 knockdown abated ATRA-induced downregulation (orange) and upregulation (blue). Individual genes of interest are noted to the right of the heat map; colored bars in the right margin mark the positions of genes in the indicated DAVID functional annotation clusters representing the indicated (top margin) enriched functional terms. The graphs to the right of the heatmap show the top DAVID functional annotation terms for genes for which HOTAIRM1 knockdown abated ATRA-induced downregulation (top, orange) and upregulation (lower, blue), with the significance of the enrichment indicated by the position on the x-axis (-log EASE), the fold enrichment indicated by the intensity of color, and the number of genes indicated by the size of each dot; (C) Time course of MS4A3, CDC7, HOXD13, and BCL6 gene expression during maturation in NB4 cells at the indicated days of ATRA induction in HOTAIRM1 knockdown and control cells, as indicated by symbols and colors in the insert (mean ± SD, n = 3–9; * P < 0.05, two-way ANOVA Holm–Sidak post-hoc test). ctl, non-transduced control; scr: scramble control; kd, HOTAIRM1-knockdown cells; dCTL/dSCR/dKD, differentiated ctl/scr/kd (4 d in ATRA).
Consistent with previous gene expression studies,36,38,39 a large number of genes were induced by ATRA in both control and knockdown cells; these genes are enriched for functional groups (Fig. S3, Tables S1–3) associated with ATRA-induced growth arrested at G1 (e.g., cyclins, CDC kinases, MCM proteins, histone, DEAD/DEAH box helicases, proteasome subunits, and ubiquitin protein ligases) and granulocytic maturation (e.g., transcription factors [CEBPE, BCL6], Fc receptors, MHC class I molecules, adhesion, and signaling molecules [CSF3R, ITGAM], and membrane protein genes).36,38-41 However, a large proportion of the ATRA-induced transcriptional response in control cells, including both up- and downregulation, was scaled back in knockdown cells, as indicated by the lowered slope of the scatter plot of fold changes (Fig. 2A) in knockdown vs. scramble control gene expression (b = 0.75 vs. b = 1.03) and reduced enrichment of many shared ATRA-induced functional categories of genes in knockdown vs. controls cells (Fig. S4). On a genomic scale, principal component analysis (Fig. 2A) revealed that HOTAIRM1 knockdown caused a diminished ATRA response, which was demonstrated by closer groupings of untreated samples and ATRA-treated-knockdown cells compared with the clear separation between untreated and ATRA-treated control groups along first principal axis.
Comparison of ATRA-induced transcription profiles of knockdown cells to scramble controls (Fig. 2B; Table S4) by hierarchical clustering revealed the signature impact of HOTAIRM1 knockdown to be the moderation of large scale ATRA repression of cell cycle progression genes. These include genes of conserved key components of the DNA replication machinery, such as members of the pre-replication and CMG complexes (e.g., CDC6, CDT1, MCM5 [Fig. 2B]) and genes encoding proteins involved in replication initiation (e.g., CDC45, CDK6, CDC7 [Fig. 2B and C; Table S4]), as well as established and candidate regulators of the cell cycle in hematopoiesis (e.g., E2F8, WDHD1, and DEAD-box helicase DDX11).47-50 The highest-ranked enrichment in this cluster were cell cycle-related DNA damage response genes, including CHEK1, FANCD2, RAD51, and BRCA1.51 The other top enrichment clusters are shown in the graph with orange symbols, to the right of the heatmap in Figure 2B and in Figure S5. The graphs present enrichment analyses of genes that significantly responded to ATRA treatment in either knockdown or controls or both, and are significantly different in a direct statistical comparison between separately analyzed knockdown and scramble controls.
HOTAIRM1 knockdown also significant moderated ATRA repression of HOXD13 and the 5′ HOXA cluster member HOXA11 (Fig. 2B and C; Table S4). HOXD13 has been shown to be directly involved in DNA replication initiation through interaction with geminin, a repressor of DNA replication licensing factor CDT1,52 for which HOTAIRM1 knockdown also abated ATRA-mediated repression. In a previous study using real-time quantitative PCR, we reported that HOTAIRM1 knockdown attenuated upregulation of neighboring 3′ HOXA cluster genes in the first 3 d of ATRA induction of NB4 cells. Our current data show only low fold changes in these 3′ HOXA genes, with no significant differences between knockdown and control cells (Table S1), possibly due to diminished induction at the later time point used in this study or the lower sensitivity of the current microarray profiling platform.
The knockdown of HOTAIRM1 also abated ATRA upregulation of a cluster of genes associated with granulocyte maturation, predominantly glycoproteins and other membrane molecules. The top-ranked enrichment group included major histocompatibility complex, leukocyte activation, and immune response genes (Fig. 2B), including BCL6 (Fig. 2C), CEACAM1, and FCGR3A. BCL6 has been implicated in proliferation of myeloid cells and is induced during myeloid maturation of HL-60 and monocytic leukemia cells;53 it opposes NFκB regulation of immune and inflammatory genes and suppresses monocyte production of IL-6.54,55 BCL6 also forms a circuit with miR155, adding to the number of hematopoiesis regulatory circuits that are integrated with ncRNAs.56
Integrins, a family of cell adhesion receptors that commonly serve as surface markers of cell differentiation, are among the best defined phenotypic features of myeloid maturation. Several integrin α chain family genes showed altered expression in HOTAIRM1-knockdown cells. ITGA4, encoding CD49d, resisted ATRA-induced repression in the knockdown cells, whereas ITGAX (CD11c) and ITGAM (CD11b) showed reduced induction by ATRA in knockdown cells. As CD11b and CD11c are important myeloid maturation markers, their attenuated induction extends our previous results indicating a functional role of HOTAIRM1 in myeloid differentiation.16
Reduction in ATRA-induced cell cycle arrest at the G1/S transition in HOTAIRM1-knockdown cells
Cell cycle phase distribution by DNA content showed no difference between control and HOTAIRM1 knockdown cells before ATRA treatment (Fig. S5). However, after 4 d of ATRA-induced differentiation, assays of both EdU incorporation and DNA content showed that the S phase fraction was more than 10% larger in the knockdown cells than in controls (Fig. 3; Fig. S5), while the proportion of cells in the G0/G1 range of DNA content decreased correspondingly. This reduction in ATRA-induced G1/S phase arrest most likely represents the cellular phenotype of the abated repression of cell cycle progression genes after ATRA induction of HOTAIRM1-knockdown cells and could be a key mechanism for their retention of cell proliferation.

Figure 3. Effect of HOTAIRM1 knockdown on cell proliferation and cell cycle progression at day 4 of ATRA-induced granulocytic differentiation of NB4 cells. (A) Left panels: Representative cell cycle model analysis of DNA content histograms (S phase shaded in blue); Right panels: EdU incorporation vs. DNA scatter plots; (B) Cell cycle phase distribution of G1 (EdU negative), S (EdU positive), and G2/M (EdU negative) in knockdown and control NB4 cells, determined by gating on EdU vs DNA scatter plots. Boxes represent 25th to 75th percentiles, with means indicated by an interior horizontal line and ranges by upper and lower brackets (n = 3–9; * P < 0.05, two-way ANOVA Holm–Sidak post-hoc test). ctl, non-transduced control; scr, scramble control; kd, HOTAIRM1-knockdown cells.
HOTAIRM1 knockdown abates ATRA-induced changes in CD11c and CD49d expression, coupled to resistance to arrest of cell cycle progression
Integrins are a class of multifunctional cell adhesion receptors that control the fate and function of cells by adhesive interaction with the local microenvironment and by signal transduction to regulators of proliferation and differentiation. CD11c, encoded by ITGAX, is not expressed on the NB4 cell surface before ATRA induction and is considered a sensitive marker of granulocytic maturation in this cell line.28,43,44 The ITGAX gene is among the cell membrane adhesion and signal transduction genes for which ATRA-induced transcription was abated by HOTAIRM1 knockdown in NB4 cells. Notably, it was also among the small number of genes moderately repressed by HOTAIRM1 knockdown even without ATRA treatment. The decrease in ITGAX transcript levels in HOTAIRM1 knockdown cells was validated by quantitative RT-PCR (Fig. 4A, left panel), and decreased cell surface CD11c expression on knockdown cells was demonstrated by flow cytometry (Fig. 4A, right panel). CD49d, the integrin α 4 chain, is the α subunit of the receptor for the endothelial adhesion molecule VCAM-1 and associated with bone marrow homing, proliferation, and cell cycle progression in CD34+ hematopoietic stem and progenitor cells.43,57-60 Its expression is decreased during myeloid differentiation in NB4 and other leukemia cell lines.43 We validated the significantly retained mRNA level of ITGA4 gene (Fig. 4B, left panel) that encodes CD49d, as shown above in the transcriptional profile of HOTAIRM1-knockdown NB4 cells, and the correspondingly retained cell surface expression of CD49d in the knockdown cells (Fig. 4B). As expected in a multi-day developmental program, the changes in surface protein expression occurred somewhat later than the biologically preceding alterations in mRNA levels.

Figure 4. Effect of HOTAIRM1 knockdown on ATRA-induced changes in expression of ITGAX (CD11c) and ITGA4 (CD49d) integrin α subunits in NB4 cells. (A) Left panel: ITGAX transcripts measured by qRT-PCR at the indicated days of ATRA-induced granulocytic differentiation and graphed as means of the ratios of expression levels relative to untreated non-transduced NB4 controls (mean ± SD; n = 3–9; * P < 0.05, two-way ANOVA Holm–Sidak post-hoc test). Right panel: cell surface expression of CD11c measured by flow cytometry in knockdown and control cells at the indicated days of ATRA-induced granulocytic differentiation; (B) Left panel: ITGA4 transcripts measured by qRT-PCR at the indicated days of ATRA-induced granulocytic differentiation and graphed as log10 of the means of the ratios of expression levels relative to untreated non-transduced NB4 controls (mean ± SD; n = 3–9; * P < 0.05, two-way ANOVA Holm–Sidak post-hoc test). Right panel: cell surface expression of CD49d measured by flow cytometry in knockdown and control cells at the indicated days of ATRA-induced granulocytic differentiation. ctl, non-transduced control; scr, scramble control; kd, HOTAIRM1-knockdown cells.
The previously observed link of CD49d expression to cell cycle status58 led us to assess the possible connection between perturbed integrin expression and the persistence of cell cycle progression during ATRA-induced maturation in HOTAIRM1-knockdown NB4 cells. Living cells stained for DNA content were harvested for subsequent immunostaining with fluorophore-conjugated antibodies against myeloid differentiation markers CD11c, CD49d, CD13, and CD33. Multicolor flow cytometric analysis (Fig. 5) revealed that S phase entry and progression were coupled tightly with cell surface expression of CD49d and CD11c, which were in a switching pattern during ATRA-induced maturation. In control cells, a decrease in the number of S phase cells during differentiation was accompanied by increased expression of CD11c (Fig. 5, left panel) and by depletion of cell surface CD49d (Fig. 5, middle panel). In HOTAIRM1-knockdown cells the retained higher number of S phase cells was associated with continued expression of CD49d and diminished induction of CD11c, as the G1/S transition and S phase progression was limited to the subpopulation that retained CD49d expression and remained CD11c negative. In contrast, expression of CD13 and CD33 did not correlate with cell cycle progression (Fig. S6).
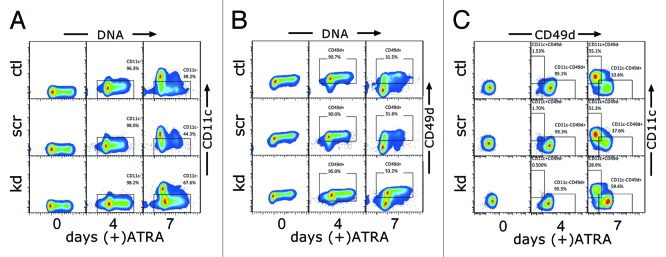
Figure 5. Effect of HOTAIRM1 knockdown on coupling of CD49d and CD11c expression with S phase progression during granulocytic differentiation of NB4 cells. (A and B) Flow cytometry, gated for single viable cells using forward scatter and side scatter, measuring cell surface CD11c (A) and CD49d (B) on the ordinates and DNA content on the abscissas, in the indicated populations of NB4 cells (left margin) induced with ATRA for the indicated number of days (bottom margin). (C) Flow cytometry, gated for single viable cells, measuring cell surface CD11c (ordinate) and CD49d (abscissa) in the indicated populations of NB4 cells induced with ATRA for the indicated number of days. ctl, non-transduced control; scr, scramble control; kd, HOTAIRM1-knockdown cells.
Discussion
Myeloid maturation requires proper control of cell cycle progression to coordinate proliferation and differentiation and to generate fully mature cells that then exit the cell cycle at G0. ATRA-induced cell cycle arrest at the G0/G1 phase in NB4 cells takes place through targeting of key cell cycle regulators in the Rb/E2F pathway, the main transcriptional controllers of G1 to S phase progression.29,37 Downstream targets include cyclin-dependent kinase inhibitors (e.g., CDKN1A and CDKN1B) and cyclins (e.g., cyclin E and cyclin D1/D3). Transcriptional control of differentiation takes place at least in part through ATRA-induced upregulation of the myeloid lineage-specific transcription factor CCAAT/enhancer binding protein α (CEBPα), which also blocks cell cycle progression by inhibition of E2F and its target genes.61,62 MicroRNAs also contribute to regulatory circuits with CEBPα and E2Fs to control cell cycle progression during myeloid differentiation.48,63,64
Recently, multiple ncRNAs have been shown to be coordinately expressed in the promoters of cell cycles genes,65 and long ncRNAs have been demonstrated to modulate cell cycle progression in other cell development processes.66-68 The present study reports the effects of shRNA-mediated knockdown of HOTAIRM1, a lincRNA induced during myeloid maturation in both primary myeloid lineage hematopoietic cells and myeloid leukemia cell lines.16 Knockdown of HOTAIRM1 in the NB4 acute promyelocytic leukemia cell line delayed morphological granulocytic maturation during ATRA-induced granulocytic differentiation and reduced expression of integrin α chain CD11c and other myeloid maturation-related cell membrane genes. HOTAIRM1 knockdown concomitantly reduced ATRA-induced suppression of proliferation and preserved expression of DNA replication and cell cycle genes normally downregulated during differentiation. This perturbation in gene expression patterns was associated with significant retention of G1/S transition and S-phase progression in HOTAIRM1 knockdown cells during ATRA induced maturation.
The relative preservation of S phase progression in HOTAIRM1-knockdown cells was coupled with altered expression of two integrin α chains: increased expression of CD11c and diminished levels of CD49d. Strikingly, the concurrent changes in CD49d and CD11c expression occurred at a late stage of ATRA-induced NB4 differentiation and appeared to be synchronous. This shift may function as a switch for G1/S transition,69,70 regulated by HOTAIRM1. Our results suggest that HOTAIRM1 may affect cell fate during myeloid differentiation by regulating cell cycle progression and serving as a link in the coordinated regulation of an extensive gene expression program.
We have previously shown16 that HOTAIRM1 knockdown attenuates ATRA-induced expression of neighboring 3′ HOXA genes including HOXA1 and HOXA4. The present study revealed that the quantitatively greatest impact to HOX genes upon HOTAIRM1 knockdown is the retention of HOXD13 expression during ATRA-induced differentiation. As HOX genes are responsible for lineage-specific coordination of proliferation and differentiation,71 this mechanism provides a possible pathway and a broader context for the role of HOTAIRM1 in the control of the cell cycle. For example, HOX genes have a recently-demonstrated involvement in DNA replication origin licensing. In particular, HOXD13 binds to replication origins and helps to assemble the pre-replication complex at these origins.52 HOXA10 has also been demonstrated to control several common cell cycle regulators.72
In addition, HOX gene products have multiple protein–protein interactions with geminin, a repressor of DNA replication origin licensing. As a counter-function to MLL, which maintains expression of HOX genes, the geminin–polycomb complex can silence the HOX genes.73 The involvement of HOX genes in DNA replication may also occur through their interaction with E2F transcription factors, as several HOXA genes have been identified as E2F targets.74 A related study revealed that DEAD (Asp-Glu-Ala-Asp) box helicase 5 (DDX5) may assist E2Fs in recruiting RNA polymerase II to many cell cycle gene promoters.47 Helicases, including the DEAD/DEAH box group, were among the most enriched downregulated genes in control cells and were significantly retained in knockdown cells (Table 1). Our results suggest that E2Fs, HOTAIRM1, and perhaps protein-coding HOX genes might engage in a network to regulate cell cycle progression during differentiation.
The current studies also show that HOTAIRM1 modulates genes encoding cell adhesion receptors. Members of the integrin families serve as important functional molecules in phagocytosis, leukocyte trafficking, and signal transduction,69,75 and are known to be regulated by HOX genes. For example, HOXA10 activates beta3 integrin (α-V/β-3) during myeloid differentiation and HOXD3 promotes beta1 integrin (α-V/β-1) expression during angiogenesis.11,76,77 Among their multifunctional roles, many integrins—especially the β-1 family—initiate signaling pathways that directly link growth factor receptors to signal transduction and gene transcription events that control cell cycle, particularly G1/S phase progression.78,79 Integrins target the E2F/RB pathway, which controls expression of cyclins, and regulate cyclin-CDK activity.30,80 Beta-1 integrin VLA-4 (CD49d/CD29) has recently identified functions in hematopoietic cellular proliferation, including stem cell self-renewal, CD34+ cell mobilization, and ex vivo expansion, as well as in hematopoietic and leukemic stem cell homing.57-60,81,82 An integrin switch mechanism, through changing proportions of α-5 and α-6 integrins, has also been proposed as the determining factor in the proliferation vs. differentiation decision during primary adipocyte differentiation.69,70 The current study reports an α-4 to α-X integrin switch that is precisely coordinated with the transit from proliferative phase of cell cycle progression to granulocytic maturation. Thus, a HOTAIRM1-regulated integrin switch mechanism involving CD11c and CD49d may regulate cell growth in NB4 acute promyelocytic leukemia cells and hence modulate NB4 cell maturation.
Materials and Methods
Cell culture
NB4 and HEK293 cell lines were obtained from the American Type Culture Collection. NB4 cells were cultured in RPMI 1640 medium and HEK293 cells in DMEM, with 10% fetal bovine serum (FBS) at 37 °C in a 5% CO2 incubator. For granulocytic differentiation, NB4 cells were seeded at 1 × 10⁵/ml in fresh medium supplemented with 10% FBS, with or without 1 uM ATRA (≥ 98% pure by HPLC, Sigma) then cultured for up to 7 d and split in fresh medium every 2 d or when the cell number doubled.
Cell numbers after ATRA induction were measured daily over 4 d by hemocytometer counting of total viable cells for each knockdown clone and control cells from triplicate cultures.
Cell cycle and proliferation
Cell cycle phase distribution was measured by flow cytometric analysis of DNA content in ethanol-fixed cells stained with 4,6-diamidino-2-phenylindole (DAPI) as described previously,35 or in living cells stained with Vybrant Dye Cycle violet (DCV) (Invitrogen) as follows. Cells were cultured at 1 × 10⁶/ml in pre-warmed culture medium containing 10 μM DCV for 90 min with gently shaking every 10 min and avoidance of direct light exposure, before immunostaining of cell surface markers and data acquisition on a 4-laser BD LSR II flow cytometer (Becton Dickinson). Cell cycle phase distributions were generated by fitting DNA content histograms to applicable models using Flowjo software (TreeStar).
Cell proliferation was assessed with a 5-ethynyl-2′-deoxyuridine (EdU) incorporation assay. Cells were incubated for 2 h with 10 μM EdU, then processed with Click-iT EdU Alexa Fluor 647 Flow Cytometry Assay Kit (Invitrogen) according to the manufacturer’s instruction, followed by incubation for 30 min with SYTOX® AADvanced DNA Stain (Invitrogen). Proliferating cells were analyzed and quantified as the percentage of cells EdU positive by BD LSRII flow cytometer and Flowjo software.
RNA interference
siRNA targeting sites (21 nt) of the HOTAIRM1 transcript were selected on the siRNA selection server at the Whitehead Institute for Biomedical Research and their specificities checked by BLAST. Lentiviral vectors expressing short hairpin RNAs (shRNAs) targeting the selected HOTAIRM1 sites were constructed by inserting each shRNA cassette into a pLKO.3G backbone plasmid (Addgene plasmid 14748). A control vector expressing a scramble shRNA sequence (adopted from Addgene plasmid 1864) was constructed on the same backbone plasmid. Resultant pLKO.3G-shHOTAIRM1 and control pLKO.3G scramble shRNA lentiviral vectors, were produced and pseudotyped in the HEK293T cell line by co-transfecting with packaging plasmids pMD2.G (Trono lab, Addgene plasmid 12259) and psPAX2 (Trono lab, Addgene plasmid 12260) using Lipo293 DNA In Vitro Transfection Reagent (Signagen Laboratories). Titers of viral supernatants were assessed by a flow cytometric assay of GFP expression in NB4 cells before use. For transduction, NB4 cells were suspended in medium containing lentiviral supernatant at an MOI of 5–10 in the presence of 6 μg/ml polybrene (Sigma) and centrifuged at 800 × g in room temperature for 1 h. The supernatants were aspirated and cells resuspended in growth medium and cultured at 37 °C for 48–72 h. GFP+ transductants were selected by flow sorting on a BD FACSVantage DV-1 Cell Sorter. In addition, commercial lentiviral particles targeting a different target site on the HOTAIRM1 transcript (Table S5) were purchased from the custom lentiviral service of Sigma-Aldrich.
For generation of stably transduced cell clones, the sorted transduced cells (GFP+) were plated in soft agar medium in 100-mm culture dishes and incubated for 7–10 d, or until well-separated colonies were visible.16,30 Individual colonies were then transferred to 48-well plates for expansion. Selected clones showed HOTAIRM1 knockdown of more than 70% by qRT-PCR during ATRA induction.
Transcription profiling by oligonucleotide arrays
DNA-free total RNA was isolated from control and transduced cells, in three biological repeats of each, using RNAzol LT reagent (Molecular Research Center), and the quality of total RNA was checked by glyoxal agarose gel electrophoresis. Fragmented biotinylated NTP-labeled cDNA was amplified and labeled according to Affymetrix protocols for GeneChip Human Gene 1.0 ST arrays. Hybridization of labeled samples to GeneChip arrays and data acquisition was performed at the genomics core facility of the University of Massachusetts Medical School.
Data were analyzed using Bioconductor “affy” packages.31 After passing quality control, the probe set summary of the signal estimate was extracted from chips by Robust Multichip Average algorithms. Global changes across control and HOTAIRM1-knockdown cells and between untreated and ATRA-induced cells were evaluated by principal component analysis. The differential expression of genes in comparisons of knockdown and control cells was assessed by the moderated t-statistics implemented in LIMMA.25 As biologically important changes related to non-coding RNA function, especially in the setting of knockdown experiments, can be relatively small,24 we tested the significance of differentially expressed genes32,33 to a minimum fold change threshold of > 1.25. The accuracy of the profiling was validated by qRT-PCR for selected targets. Differentially expressed genes were analyzed for functional enrichment using the Database for Annotation, Visualization and Integrated Discovery (DAVID) v6.7.34 GeneChip data from this study are available from the NCBI Gene Expression Omnibus (GEO) under accession number GSE49516.
Quantitative RT-PCR
Total RNA was isolated and quality-checked as above. First-strand cDNAs were reverse transcribed using the iScript™ cDNA Synthesis Kit (Bio-Rad Laboratories). All PCR primers (Table S6) were searched by BLAST against GenBank or by in-silico PCR in the UCSC Genome Browser. Real-time quantitative PCR was performed using iTaq™ SYBR® Green Supermix with ROX (Bio-Rad Laboratories) on a Mastercycler® ep realplex thermal cycler (Eppendorf), with quantitation by the relative standard curve method. Relative expression levels were calculated on the basis of the threshold cycle for amplification. Endogenous controls for different targets were selected from a panel of housekeeping genes: α tubulin, ribosomal protein s6, PPIA, HMBS, and EAR.
Analysis of myeloid differentiation
Three aliquots of each NB4 culture at indicated days of ATRA-induced differentiation were cytocentrifuged onto glass slides, which were stained with modified Wrights-Giemsa (Accustain; Sigma-Aldrich). Blindly labeled slides were read by an experienced hematologist for the distribution of cells at each stage of myeloid differentiation, classified as neutrophils (band and polymorphonuclear forms), metamyelocytes, myelocytes, and promyelocytes. Cells in mitosis or morphological apoptosis were excluded from the counts; their numbers were too small to show any statistically significant differences between groups. The data were compiled by a different investigator and expressed as mean ± SD of the triplicate readings for each cell type and day of induction.
For flow cytometric analysis, fluorochrome-conjugated antibodies for human CD11c (PE-Cy7), CD13 (PerCP-Cy5.5), CD33 (PE), and CD49d (APC) from BD Biosciences were used in a 5- or 6-color panels together with GFP or DNA staining. 5 × 10⁵ cells were re-suspended in 10% normal human serum in PBS, incubated for 10–20 min at 4 °C to block Fc receptors, stained by incubation with the selected monoclonal antibodies for 30 min at 4 °C, and washed with PBS plus 2% FCS. Fluorescently stained cells were analyzed using standard “FACSDiva” acquisition analysis software on a BD LSR II flow cytometer. Unstained and single-stain samples served as controls for subsequent software compensation using the “FlowJo” analysis software compensation module (Tree Star).
Supplementary Material
Disclosure of Potential Conflicts of Interest
No potential conflicts of interest were disclosed.
Acknowledgments
This work was supported by a grant from the US. National Institutes of Health, DK054369.
References
- 1.Gibcus JH, Dekker J. The context of gene expression regulation. F1000 Biol Rep. 2012;4:8. doi: 10.3410/B4-8. [DOI] [PMC free article] [PubMed] [Google Scholar]
- 2.Spizzo R, Almeida MI, Colombatti A, Calin GA. Long non-coding RNAs and cancer: a new frontier of translational research? Oncogene. 2012;31:4577–87. doi: 10.1038/onc.2011.621. [DOI] [PMC free article] [PubMed] [Google Scholar]
- 3.Wapinski O, Chang HY. Long noncoding RNAs and human disease. Trends Cell Biol. 2011;21:354–61. doi: 10.1016/j.tcb.2011.04.001. [DOI] [PubMed] [Google Scholar]
- 4.Ruddle FH, Bartels JL, Bentley KL, Kappen C, Murtha MT, Pendleton JW. Evolution of Hox genes. Annu Rev Genet. 1994;28:423–42. doi: 10.1146/annurev.ge.28.120194.002231. [DOI] [PubMed] [Google Scholar]
- 5.Deschamps J. Ancestral and recently recruited global control of the Hox genes in development. Curr Opin Genet Dev. 2007;17:422–7. doi: 10.1016/j.gde.2007.07.008. [DOI] [PubMed] [Google Scholar]
- 6.Wellik DM. Hox genes and vertebrate axial pattern. Curr Top Dev Biol. 2009;88:257–78. doi: 10.1016/S0070-2153(09)88009-5. [DOI] [PubMed] [Google Scholar]
- 7.Ruddle FH, Bartels JL, Bentley KL, Kappen C, Murtha MT, Pendleton JW. Evolution of Hox genes. Annu Rev Genet. 1994;28:423–42. doi: 10.1146/annurev.ge.28.120194.002231. [DOI] [PubMed] [Google Scholar]
- 8.Fuller JF, McAdara J, Yaron Y, Sakaguchi M, Fraser JK, Gasson JC. Characterization of HOX gene expression during myelopoiesis: role of HOX A5 in lineage commitment and maturation. Blood. 1999;93:3391–400. [PubMed] [Google Scholar]
- 9.Iacovino M, Hernandez C, Xu Z, Bajwa G, Prather M, Kyba M. A conserved role for Hox paralog group 4 in regulation of hematopoietic progenitors. Stem Cells Dev. 2009;18:783–92. doi: 10.1089/scd.2008.0227. [DOI] [PMC free article] [PubMed] [Google Scholar]
- 10.Magnusson M, Brun ACM, Miyake N, Larsson J, Ehinger M, Bjornsson JM, Wutz A, Sigvardsson M, Karlsson S. HOXA10 is a critical regulator for hematopoietic stem cells and erythroid/megakaryocyte development. Blood. 2007;109:3687–96. doi: 10.1182/blood-2006-10-054676. [DOI] [PubMed] [Google Scholar]
- 11.Bei L, Lu Y, Bellis SL, Zhou W, Horvath E, Eklund EA. Identification of a HoxA10 activation domain necessary for transcription of the gene encoding beta3 integrin during myeloid differentiation. J Biol Chem. 2007;282:16846–59. doi: 10.1074/jbc.M609744200. [DOI] [PubMed] [Google Scholar]
- 12.Eklund E. The role of Hox proteins in leukemogenesis: insights into key regulatory events in hematopoiesis. Crit Rev Oncog. 2011;16:65–76. doi: 10.1615/CritRevOncog.v16.i1-2.70. [DOI] [PMC free article] [PubMed] [Google Scholar]
- 13.Lindsey S, Huang W, Wang H, Horvath E, Zhu C, Eklund EA. Activation of SHP2 protein-tyrosine phosphatase increases HoxA10-induced repression of the genes encoding gp91(PHOX) and p67(PHOX) J Biol Chem. 2007;282:2237–49. doi: 10.1074/jbc.M608642200. [DOI] [PubMed] [Google Scholar]
- 14.Argiropoulos B, Humphries RK. Hox genes in hematopoiesis and leukemogenesis. Oncogene. 2007;26:6766–76. doi: 10.1038/sj.onc.1210760. [DOI] [PubMed] [Google Scholar]
- 15.Krivtsov AV, Twomey D, Feng Z, Stubbs MC, Wang Y, Faber J, Levine JE, Wang J, Hahn WC, Gilliland DG, et al. Transformation from committed progenitor to leukaemia stem cell initiated by MLL-AF9. Nature. 2006;442:818–22. doi: 10.1038/nature04980. [DOI] [PubMed] [Google Scholar]
- 16.Zhang X, Lian Z, Padden C, Gerstein MB, Rozowsky J, Snyder M, Gingeras TR, Kapranov P, Weissman SM, Newburger PE. A myelopoiesis-associated regulatory intergenic noncoding RNA transcript within the human HOXA cluster. Blood. 2009;113:2526–34. doi: 10.1182/blood-2008-06-162164. [DOI] [PMC free article] [PubMed] [Google Scholar]
- 17.Rinn JL, Kertesz M, Wang JK, Squazzo SL, Xu X, Brugmann SA, Goodnough LH, Helms JA, Farnham PJ, Segal E, et al. Functional demarcation of active and silent chromatin domains in human HOX loci by noncoding RNAs. Cell. 2007;129:1311–23. doi: 10.1016/j.cell.2007.05.022. [DOI] [PMC free article] [PubMed] [Google Scholar]
- 18.Birney E, Stamatoyannopoulos JA, Dutta A, Guigó R, Gingeras TR, Margulies EH, Weng Z, Snyder M, Dermitzakis ET, Thurman RE, et al. ENCODE Project Consortium. NISC Comparative Sequencing Program. Baylor College of Medicine Human Genome Sequencing Center. Washington University Genome Sequencing Center. Broad Institute. Children’s Hospital Oakland Research Institute Identification and analysis of functional elements in 1% of the human genome by the ENCODE pilot project. Nature. 2007;447:799–816. doi: 10.1038/nature05874. [DOI] [PMC free article] [PubMed] [Google Scholar]
- 19.Mainguy G, Koster J, Woltering J, Jansen H, Durston A. Extensive polycistronism and antisense transcription in the mammalian Hox clusters. PLoS One. 2007;2:e356. doi: 10.1371/journal.pone.0000356. [DOI] [PMC free article] [PubMed] [Google Scholar]
- 20.Wang KC, Chang HY. Molecular mechanisms of long noncoding RNAs. Mol Cell. 2011;43:904–14. doi: 10.1016/j.molcel.2011.08.018. [DOI] [PMC free article] [PubMed] [Google Scholar]
- 21.Wang KC, Yang YW, Liu B, Sanyal A, Corces-Zimmerman R, Chen Y, Lajoie BR, Protacio A, Flynn RA, Gupta RA, et al. A long noncoding RNA maintains active chromatin to coordinate homeotic gene expression. Nature. 2011;472:120–4. doi: 10.1038/nature09819. [DOI] [PMC free article] [PubMed] [Google Scholar]
- 22.Bertani S, Sauer S, Bolotin E, Sauer F. The noncoding RNA Mistral activates Hoxa6 and Hoxa7 expression and stem cell differentiation by recruiting MLL1 to chromatin. Mol Cell. 2011;43:1040–6. doi: 10.1016/j.molcel.2011.08.019. [DOI] [PMC free article] [PubMed] [Google Scholar] [Retracted]
- 23.Wei W, Pelechano V, Järvelin AI, Steinmetz LM. Functional consequences of bidirectional promoters. Trends Genet. 2011;27:267–76. doi: 10.1016/j.tig.2011.04.002. [DOI] [PMC free article] [PubMed] [Google Scholar]
- 24.Deaton AM, Webb S, Kerr ARW, Illingworth RS, Guy J, Andrews R, Bird A. Cell type-specific DNA methylation at intragenic CpG islands in the immune system. Genome Res. 2011;21:1074–86. doi: 10.1101/gr.118703.110. [DOI] [PMC free article] [PubMed] [Google Scholar]
- 25.Thomson JP, Skene PJ, Selfridge J, Clouaire T, Guy J, Webb S, Kerr ARW, Deaton A, Andrews R, James KD, et al. CpG islands influence chromatin structure via the CpG-binding protein Cfp1. Nature. 2010;464:1082–6. doi: 10.1038/nature08924. [DOI] [PMC free article] [PubMed] [Google Scholar]
- 26.Illingworth R, Kerr A, Desousa D, Jørgensen H, Ellis P, Stalker J, Jackson D, Clee C, Plumb R, Rogers J, et al. A novel CpG island set identifies tissue-specific methylation at developmental gene loci. PLoS Biol. 2008;6:e22. doi: 10.1371/journal.pbio.0060022. [DOI] [PMC free article] [PubMed] [Google Scholar]
- 27.Rozenberg JM, Shlyakhtenko A, Glass K, Rishi V, Myakishev MV, FitzGerald PC, Vinson C. All and only CpG containing sequences are enriched in promoters abundantly bound by RNA polymerase II in multiple tissues. BMC Genomics. 2008;9:67. doi: 10.1186/1471-2164-9-67. [DOI] [PMC free article] [PubMed] [Google Scholar]
- 28.Lanotte M, Martin-Thouvenin V, Najman S, Balerini P, Valensi F, Berger R. NB4, a maturation inducible cell line with t(15;17) marker isolated from a human acute promyelocytic leukemia (M3) Blood. 1991;77:1080–6. [PubMed] [Google Scholar]
- 29.Dimberg A, Oberg F. Retinoic acid-induced cell cycle arrest of human myeloid cell lines. Leuk Lymphoma. 2003;44:1641–50. doi: 10.1080/1042819031000083316. [DOI] [PubMed] [Google Scholar]
- 30.Hattori H, Zhang X, Jia Y, Subramanian KK, Jo H, Loison F, Newburger PE, Luo HR. RNAi screen identifies UBE2D3 as a mediator of all-trans retinoic acid-induced cell growth arrest in human acute promyelocytic NB4 cells. Blood. 2007;110:640–50. doi: 10.1182/blood-2006-11-059048. [DOI] [PMC free article] [PubMed] [Google Scholar]
- 31.Gautier L, Cope L, Bolstad BM, Irizarry RA. affy--analysis of Affymetrix GeneChip data at the probe level. Bioinformatics. 2004;20:307–15. doi: 10.1093/bioinformatics/btg405. [DOI] [PubMed] [Google Scholar]
- 32.McCarthy DJ, Smyth GK. Testing significance relative to a fold-change threshold is a TREAT. Bioinformatics. 2009;25:765–71. doi: 10.1093/bioinformatics/btp053. [DOI] [PMC free article] [PubMed] [Google Scholar]
- 33.Smyth GK. Linear models and empirical bayes methods for assessing differential expression in microarray experiments. Stat Appl Genet Mol Biol. 2004;3:e3. doi: 10.2202/1544-6115.1027. [DOI] [PubMed] [Google Scholar]
- 34.Huang W, Sherman BT, Lempicki RA. Systematic and integrative analysis of large gene lists using DAVID bioinformatics resources. Nat Protoc. 2009;4:44–57. doi: 10.1038/nprot.2008.211. [DOI] [PubMed] [Google Scholar]
- 35.Darzynkiewicz Z, Juan G. DNA content measurement for DNA ploidy and cell cycle analysis. Curr Protoc Cytom 2001; Chapter 7:Unit 7.5. [DOI] [PubMed] [Google Scholar]
- 36.Payton JE, Grieselhuber NR, Chang LW, Murakami M, Geiss GK, Link DC, Nagarajan R, Watson MA, Ley TJ. High throughput digital quantification of mRNA abundance in primary human acute myeloid leukemia samples. J Clin Invest. 2009;119:1714–26. doi: 10.1172/JCI38248. [DOI] [PMC free article] [PubMed] [Google Scholar]
- 37.Dimberg A, Bahram F, Karlberg I, Larsson L-G, Nilsson K, Oberg F. Retinoic acid-induced cell cycle arrest of human myeloid cell lines is associated with sequential down-regulation of c-Myc and cyclin E and posttranscriptional up-regulation of p27(Kip1) Blood. 2002;99:2199–206. doi: 10.1182/blood.V99.6.2199. [DOI] [PubMed] [Google Scholar]
- 38.Mollinedo F, López-Pérez R, Gajate C. Differential gene expression patterns coupled to commitment and acquisition of phenotypic hallmarks during neutrophil differentiation of human leukaemia HL-60 cells. Gene. 2008;419:16–26. doi: 10.1016/j.gene.2008.04.015. [DOI] [PubMed] [Google Scholar]
- 39.Theilgaard-Mönch K, Jacobsen LC, Borup R, Rasmussen T, Bjerregaard MD, Nielsen FC, Cowland JB, Borregaard N. The transcriptional program of terminal granulocytic differentiation. Blood. 2005;105:1785–96. doi: 10.1182/blood-2004-08-3346. [DOI] [PubMed] [Google Scholar]
- 40.Luo L, Uerlings Y, Happel N, Asli NS, Knoetgen H, Kessel M. Regulation of geminin functions by cell cycle-dependent nuclear-cytoplasmic shuttling. Mol Cell Biol. 2007;27:4737–44. doi: 10.1128/MCB.00123-07. [DOI] [PMC free article] [PubMed] [Google Scholar]
- 41.Bermudez VP, Farina A, Tappin I, Hurwitz J. Influence of the human cohesion establishment factor Ctf4/AND-1 on DNA replication. J Biol Chem. 2010;285:9493–505. doi: 10.1074/jbc.M109.093609. [DOI] [PMC free article] [PubMed] [Google Scholar]
- 42.Abedin MJ, Kashio Y, Seki M, Nakamura K, Hirashima M. Potential roles of galectins in myeloid differentiation into three different lineages. J Leukoc Biol. 2003;73:650–6. doi: 10.1189/jlb.0402163. [DOI] [PubMed] [Google Scholar]
- 43.Bellón T, López-Rodríguez C, Rubio MA, Jochems G, Bernabeu C, Corbi AL. Regulated expression of p150,95 (CD11c/CD18; alpha X/beta 2) and VLA-4 (CD49d/CD29; alpha 4/beta 1) integrins during myeloid cell differentiation. Eur J Immunol. 1994;24:41–7. doi: 10.1002/eji.1830240107. [DOI] [PubMed] [Google Scholar]
- 44.Barber N, Belov L, Christopherson RI. All-trans retinoic acid induces different immunophenotypic changes on human HL60 and NB4 myeloid leukaemias. Leuk Res. 2008;32:315–22. doi: 10.1016/j.leukres.2007.04.013. [DOI] [PubMed] [Google Scholar]
- 45.Yassin ER, Abdul-Nabi AM, Takeda A, Yaseen NR. Effects of the NUP98-DDX10 oncogene on primary human CD34+ cells: role of a conserved helicase motif. Leukemia. 2010;24:1001–11. doi: 10.1038/leu.2010.42. [DOI] [PMC free article] [PubMed] [Google Scholar]
- 46.Kutok JL, Yang X, Folkerth R, Adra CN. Characterization of the expression of HTm4 (MS4A3), a cell cycle regulator, in human peripheral blood cells and normal and malignant tissues. J Cell Mol Med. 2011;15:86–93. doi: 10.1111/j.1582-4934.2009.00925.x. [DOI] [PMC free article] [PubMed] [Google Scholar]
- 47.Mazurek A, Luo W, Krasnitz A, Hicks J, Powers RS, Stillman B. DDX5 regulates DNA replication and is required for cell proliferation in a subset of breast cancer cells. Cancer Discov. 2012;2:812–25. doi: 10.1158/2159-8290.CD-12-0116. [DOI] [PMC free article] [PubMed] [Google Scholar]
- 48.Pulikkan JA, Peramangalam PS, Dengler V, Ho PA, Preudhomme C, Meshinchi S, Christopeit M, Nibourel O, Müller-Tidow C, Bohlander SK, et al. C/EBPα regulated microRNA-34a targets E2F3 during granulopoiesis and is down-regulated in AML with CEBPA mutations. Blood. 2010;116:5638–49. doi: 10.1182/blood-2010-04-281600. [DOI] [PMC free article] [PubMed] [Google Scholar]
- 49.Im J-S, Ki S-H, Farina A, Jung D-S, Hurwitz J, Lee J-K. Assembly of the Cdc45-Mcm2-7-GINS complex in human cells requires the Ctf4/And-1, RecQL4, and Mcm10 proteins. Proc Natl Acad Sci U S A. 2009;106:15628–32. doi: 10.1073/pnas.0908039106. [DOI] [PMC free article] [PubMed] [Google Scholar]
- 50.Yoshizawa-Sugata N, Masai H. Roles of human AND-1 in chromosome transactions in S phase. J Biol Chem. 2009;284:20718–28. doi: 10.1074/jbc.M806711200. [DOI] [PMC free article] [PubMed] [Google Scholar]
- 51.Sherman MH, Bassing CH, Teitell MA. Regulation of cell differentiation by the DNA damage response. Trends Cell Biol. 2011;21:312–9. doi: 10.1016/j.tcb.2011.01.004. [DOI] [PMC free article] [PubMed] [Google Scholar]
- 52.Salsi V, Ferrari S, Ferraresi R, Cossarizza A, Grande A, Zappavigna V. HOXD13 binds DNA replication origins to promote origin licensing and is inhibited by geminin. Mol Cell Biol. 2009;29:5775–88. doi: 10.1128/MCB.00509-09. [DOI] [PMC free article] [PubMed] [Google Scholar]
- 53.Yamochi T, Kitabayashi A, Hirokawa M, Miura AB, Onizuka T, Mori S, Moriyama M. Regulation of BCL-6 gene expression in human myeloid/monocytoid leukemic cells. Leukemia. 1997;11:694–700. doi: 10.1038/sj.leu.2400631. [DOI] [PubMed] [Google Scholar]
- 54.Barish GD, Yu RT, Karunasiri M, Ocampo CB, Dixon J, Benner C, Dent AL, Tangirala RK, Evans RM. Bcl-6 and NF-kappaB cistromes mediate opposing regulation of the innate immune response. Genes Dev. 2010;24:2760–5. doi: 10.1101/gad.1998010. [DOI] [PMC free article] [PubMed] [Google Scholar]
- 55.Yu RY-L, Wang X, Pixley FJ, Yu JJ, Dent AL, Broxmeyer HE, Stanley ER, Ye BH. BCL-6 negatively regulates macrophage proliferation by suppressing autocrine IL-6 production. Blood. 2005;105:1777–84. doi: 10.1182/blood-2004-08-3171. [DOI] [PubMed] [Google Scholar]
- 56.Nazari-Jahantigh M, Wei Y, Noels H, Akhtar S, Zhou Z, Koenen RR, Heyll K, Gremse F, Kiessling F, Grommes J, et al. MicroRNA-155 promotes atherosclerosis by repressing Bcl6 in macrophages. J Clin Invest. 2012;122:4190–202. doi: 10.1172/JCI61716. [DOI] [PMC free article] [PubMed] [Google Scholar]
- 57.Schroeder MA, DiPersio JF. Mobilization of hematopoietic stem and leukemia cells. J Leukoc Biol. 2012;91:47–57. doi: 10.1189/jlb.0210085. [DOI] [PubMed] [Google Scholar]
- 58.Seoh JY. VLA-4 expression and cell cycling status during ex vivo expansion of human cord blood CD34+ cells. Acta Haematol. 2001;105:111–5. doi: 10.1159/000046547. [DOI] [PubMed] [Google Scholar]
- 59.Priestley GV, Scott LM, Ulyanova T, Papayannopoulou T. Lack of alpha4 integrin expression in stem cells restricts competitive function and self-renewal activity. Blood. 2006;107:2959–67. doi: 10.1182/blood-2005-07-2670. [DOI] [PMC free article] [PubMed] [Google Scholar]
- 60.Brachtl G, Sahakyan K, Denk U, Girbl T, Alinger B, Hofbauer SW, Neureiter D, Hofbauer JP, Egle A, Greil R, et al. Differential bone marrow homing capacity of VLA-4 and CD38 high expressing chronic lymphocytic leukemia cells. PLoS One. 2011;6:e23758. doi: 10.1371/journal.pone.0023758. [DOI] [PMC free article] [PubMed] [Google Scholar]
- 61.D’Alo’ F, Johansen LM, Nelson EA, Radomska HS, Evans EK, Zhang P, Nerlov C, Tenen DG. The amino terminal and E2F interaction domains are critical for C/EBP alpha-mediated induction of granulopoietic development of hematopoietic cells. Blood. 2003;102:3163–71. doi: 10.1182/blood-2003-02-0479. [DOI] [PubMed] [Google Scholar]
- 62.Porse BT, Bryder D, Theilgaard-Mönch K, Hasemann MS, Anderson K, Damgaard I, Jacobsen SEW, Nerlov C. Loss of C/EBP alpha cell cycle control increases myeloid progenitor proliferation and transforms the neutrophil granulocyte lineage. J Exp Med. 2005;202:85–96. doi: 10.1084/jem.20050067. [DOI] [PMC free article] [PubMed] [Google Scholar]
- 63.Pulikkan JA, Dengler V, Peramangalam PS, Peer Zada AA, Müller-Tidow C, Bohlander SK, Tenen DG, Behre G. Cell-cycle regulator E2F1 and microRNA-223 comprise an autoregulatory negative feedback loop in acute myeloid leukemia. Blood. 2010;115:1768–78. doi: 10.1182/blood-2009-08-240101. [DOI] [PMC free article] [PubMed] [Google Scholar]
- 64.Fatica A, Rosa A, Ballarino M, De Marchis ML, Rasmussen KD, Bozzoni I. Role of microRNAs in myeloid differentiation. Biochem Soc Trans. 2008;36:1201–5. doi: 10.1042/BST0361201. [DOI] [PubMed] [Google Scholar]
- 65.Hung T, Wang Y, Lin MF, Koegel AK, Kotake Y, Grant GD, Horlings HM, Shah N, Umbricht C, Wang P, et al. Extensive and coordinated transcription of noncoding RNAs within cell-cycle promoters. Nat Genet. 2011;43:621–9. doi: 10.1038/ng.848. [DOI] [PMC free article] [PubMed] [Google Scholar]
- 66.Kretz M, Webster DE, Flockhart RJ, Lee CS, Zehnder A, Lopez-Pajares V, Qu K, Zheng GXY, Chow J, Kim GE, et al. Suppression of progenitor differentiation requires the long noncoding RNA ANCR. Genes Dev. 2012;26:338–43. doi: 10.1101/gad.182121.111. [DOI] [PMC free article] [PubMed] [Google Scholar]
- 67.Miles J, Mitchell JA, Chakalova L, Goyenechea B, Osborne CS, O’Neill L, Tanimoto K, Engel JD, Fraser P. Intergenic transcription, cell-cycle and the developmentally regulated epigenetic profile of the human beta-globin locus. PLoS One. 2007;2:e630. doi: 10.1371/journal.pone.0000630. [DOI] [PMC free article] [PubMed] [Google Scholar]
- 68.Ginger MR, Shore AN, Contreras A, Rijnkels M, Miller J, Gonzalez-Rimbau MF, Rosen JM. A noncoding RNA is a potential marker of cell fate during mammary gland development. Proc Natl Acad Sci U S A. 2006;103:5781–6. doi: 10.1073/pnas.0600745103. [DOI] [PMC free article] [PubMed] [Google Scholar]
- 69.Meighan CM, Schwarzbauer JE. Temporal and spatial regulation of integrins during development. Curr Opin Cell Biol. 2008;20:520–4. doi: 10.1016/j.ceb.2008.05.010. [DOI] [PMC free article] [PubMed] [Google Scholar]
- 70.Liu J, DeYoung SM, Zhang M, Zhang M, Cheng A, Saltiel AR. Changes in integrin expression during adipocyte differentiation. Cell Metab. 2005;2:165–77. doi: 10.1016/j.cmet.2005.08.006. [DOI] [PubMed] [Google Scholar]
- 71.Miotto B, Graba Y. Control of DNA replication: a new facet of Hox proteins? Bioessays. 2010;32:800–7. doi: 10.1002/bies.201000048. [DOI] [PubMed] [Google Scholar]
- 72.Lu Z, Hardt J, Kim JJ. Global analysis of genes regulated by HOXA10 in decidualization reveals a role in cell proliferation. Mol Hum Reprod. 2008;14:357–66. doi: 10.1093/molehr/gan023. [DOI] [PMC free article] [PubMed] [Google Scholar]
- 73.Luo L, Yang X, Takihara Y, Knoetgen H, Kessel M. The cell-cycle regulator geminin inhibits Hox function through direct and polycomb-mediated interactions. Nature. 2004;427:749–53. doi: 10.1038/nature02305. [DOI] [PubMed] [Google Scholar]
- 74.Bracken AP, Ciro M, Cocito A, Helin K. E2F target genes: unraveling the biology. Trends Biochem Sci. 2004;29:409–17. doi: 10.1016/j.tibs.2004.06.006. [DOI] [PubMed] [Google Scholar]
- 75.Dupuy AG, Caron E. Integrin-dependent phagocytosis: spreading from microadhesion to new concepts. J Cell Sci. 2008;121:1773–83. doi: 10.1242/jcs.018036. [DOI] [PubMed] [Google Scholar]
- 76.Cillo C, Cantile M, Mortarini R, Barba P, Parmiani G, Anichini A. Differential patterns of HOX gene expression are associated with specific integrin and ICAM profiles in clonal populations isolated from a single human melanoma metastasis. Int J Cancer. 1996;66:692–7. doi: 10.1002/(SICI)1097-0215(19960529)66:5<692::AID-IJC18>3.0.CO;2-6. [DOI] [PubMed] [Google Scholar]
- 77.Boudreau NJ, Varner JA. The homeobox transcription factor Hox D3 promotes integrin alpha5beta1 expression and function during angiogenesis. J Biol Chem. 2004;279:4862–8. doi: 10.1074/jbc.M305190200. [DOI] [PubMed] [Google Scholar]
- 78.Streuli CH. Integrins and cell-fate determination. J Cell Sci. 2009;122:171–7. doi: 10.1242/jcs.018945. [DOI] [PMC free article] [PubMed] [Google Scholar]
- 79.Jeanes AI, Wang P, Moreno-Layseca P, Paul N, Cheung J, Tsang R, Akhtar N, Foster FM, Brennan K, Streuli CH. Specific β-containing integrins exert differential control on proliferation and two-dimensional collective cell migration in mammary epithelial cells. J Biol Chem. 2012;287:24103–12. doi: 10.1074/jbc.M112.360834. [DOI] [PMC free article] [PubMed] [Google Scholar]
- 80.Schwartz MA, Assoian RK. Integrins and cell proliferation: regulation of cyclin-dependent kinases via cytoplasmic signaling pathways. J Cell Sci. 2001;114:2553–60. doi: 10.1242/jcs.114.14.2553. [DOI] [PubMed] [Google Scholar]
- 81.Bellucci R, De Propris MS, Buccisano F, Lisci A, Leone G, Tabilio A, de Fabritiis P. Modulation of VLA-4 and L-selectin expression on normal CD34+ cells during mobilization with G-CSF. Bone Marrow Transplant. 1999;23:1–8. doi: 10.1038/sj.bmt.1701522. [DOI] [PubMed] [Google Scholar]
- 82.Scott LM, Priestley GV, Papayannopoulou T. Deletion of alpha4 integrins from adult hematopoietic cells reveals roles in homeostasis, regeneration, and homing. Mol Cell Biol. 2003;23:9349–60. doi: 10.1128/MCB.23.24.9349-9360.2003. [DOI] [PMC free article] [PubMed] [Google Scholar]
Associated Data
This section collects any data citations, data availability statements, or supplementary materials included in this article.