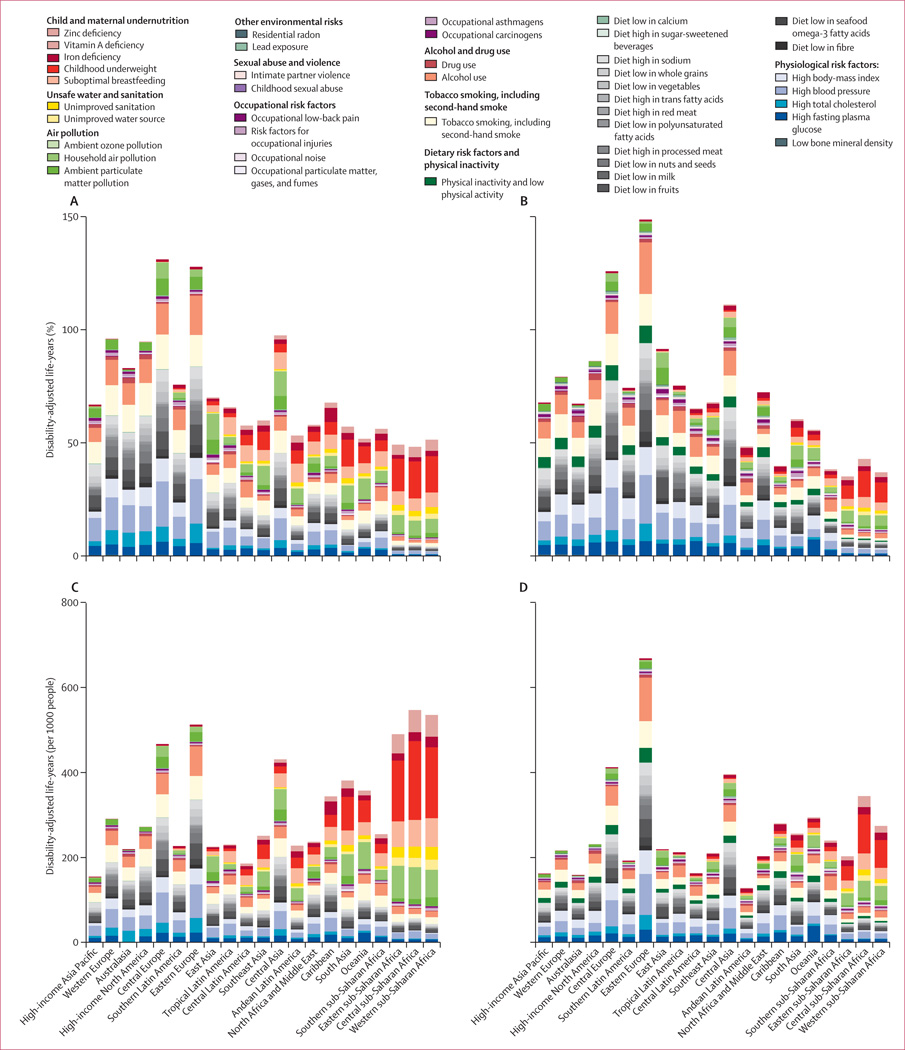
Figure 6. Attributable burden for each risk factor.
As percentage of disability-adjusted life-years in 1990 (A), and 2010 (B), and as disability-adjusted life-years per 1000 people in 1990 (C), and 2010 (D). Regions ordered by mean life expectancy. Burden of disease attributable to individual risk factors are shown sequentially for ease of presentation. In reality, the burden attributable to different risks overlaps because of multicausality and because the effects of some risk factors are partly mediated through other, more proximal, risks. An interactive version of this figure is available online at http://healthmetricsandevaluation.org/gbd/visualizations/regional.

