

SUMMARY
Modulation of cellular energy expenditure is fundamental to normal and pathological cell growth and differentiation. Mitochondria stores energy as a proton gradient across their inner membrane. Uncoupling proteins (UCPs) can dissipate the gradient to produce heat or regulate metabolite fluxes. UCP-mediated proton currents require fatty acids (FA) and are blocked by nucleotides, but the molecular basis of these processes is unknown. We find, by nuclear magnetic resonance and functional mutagenesis, that UCP2 can bind FA laterally thru its peripheral site, and this intramembrane molecular recognition is essential for UCP2-catalyzed FA flipping across the membrane, which in turn is essential for proton translocation. The antagonist GDP binds inside the UCP2 cavity and perturbs its conformation, which can displace FA from the peripheral site as a mean of inhibiting proton currents. Our data provide a biophysical perspective of the intricate interplay of UCPs, FA, and nucleotides in determining proton fluxes in mitochondria.
INTRODUCTION
Early studies of energy expenditure in living organisms uncovered a fatty acid (FA) induced process which uncoupled aerobic respiration from ADP phosphorylation (Klingenberg, 2010; Nicholls, 1979; Rafael et al., 1969). These studies led to the identification of uncoupling protein 1 (UCP1; originally named “thermogenin”), a protein responsible for catalyzing the influx of H+ to the matrix of mitochondria in a FA-dependent manner (Cannon et al., 1982; Lin and Klingenberg, 1980, 1982). More specifically, UCP1 translocates H+ down the H+ concentration gradient, uncoupling F1F0-driven ADP phosphorylation from the oxidation of metabolites by dissipating the energy contained in the H+ electrochemical potential – which otherwise can be used for ATP synthesis – as heat. UCP1 is localized to the inner membrane of mitochondria of brown adipose tissue (BAT), a tissue primarily responsible for non-shivering thermogenesis in newborn humans and other mammals. Although only small pockets of UCP1-containing BAT remain in adult humans, it has been shown that white adipose tissue in humans can be differentiated into beige adipose tissue, increasing UCP1 expression and energy expenditure (Almind et al., 2007; Mottillo et al., 2012; Wu et al., 2012).
Since the discovery of UCP1, several sequence homologs have been identified with varying tissue distribution and physiological roles (Krauss et al., 2005). Based on homology (Fig. S1), UCPs belong to a large family of mitochondrial carriers, which are generally known as solute exchangers that transport negatively charged substrates such as nucleotides, carboxylates, and vitamins (Palmieri et al., 2006). Some UCPs, however, adapted their function to modulate H+ electrochemical potential in specific tissues, making them special members in this family of carriers. UCP1, UCP2 and UCP3 have been most extensively studied owing to their biomedical importance. In vitro, UCP2 showed functional similarities to UCP1; its H+ translocation activity requires FA and can be inhibited by purine nucleotides such as GDP (Jaburek et al., 1999). This activity is, however, not associated with heat generation, but rather has been implicated in a range of functions including regulation of metabolism (Pecqueur et al., 2008) and reduction of reactive oxygen species (ROS) production (Negre-Salvayre et al., 1997). In cancers, metabolic adaptations are required for abnormal cell proliferation (Locasale et al., 2011; Samudio et al., 2009). UCP2 contributes to the metabolic rewiring of tumors and is associated with tumor growth and development of resistance to therapeutic agents (Derdak et al., 2008). Expression of UCP2 in pancreatic β-cells is also strongly correlated with decreased insulin secretion, and UCP2 inactivation restores the glucose-sensing pathway (Zhang et al., 2001). Thus, UCP2 inhibition has been sought after as a strategy to treat type 2 diabetes (Zhang et al., 2006). Similarly, UCP3 is highly expressed in muscle and has been suggested to play a role in FA metabolism rather than modulation of mitochondrial membrane potential (Schrauwen et al., 2002), although its energy dissipation property appears to be conserved. For example, hyperthermia in mice induced by 3,4-methylenedioxymethamphetamine (MDMA), a recreational drug known as “ecstasy”, is linked to UCP3 activity (Mills et al., 2003). Therefore, enhancing the effect of UCPs on energy expenditure can in principle be used in the prevention and management of obesity.
Both activating and inactivating UCPs may have important therapeutic consequences, but the detailed mechanism by which UCPs translocate H+ remains elusive. UCP activation is a complex process which is not only a function of protein conformation and H+ gradient, but also requires FA as co-activator and is inhibited by nucleotides. Based on the argument that C14–C18 FAs in micelles or membranes have pKa ~7.5 and that ~50% of them are unionized, it was proposed that FA, in its protonated or unionized form, carries H+ across the inner membrane owing to its fast flip-flop rate in lipid bilayer (Kamp and Hamilton, 1992). Once the H+ is released to the matrix, the ionized FA cannot readily flip across the membrane barrier and thus the role of UCPs appears to be catalyzing the flipping of ionized FA back to the intermembrane space side for carrying another H+ (Garlid et al., 1996; Skulachev, 1991). This mechanism is known as the protonophoretic model. Liposome based H+ flux measurements showed that lauric acid induces UCP1-mediated H+ efflux that is GDP-sensitive (Garlid et al., 1996). Moreover, both liposome assay and patch-clamp recording of mitochondria membrane showed UCP1-catalyzed transport of alkyl sulfonate (ASO−), an ionized analog of FA (Fedorenko et al., 2012; Garlid et al., 1996).
The above studies have demonstrated the ability of UCP1 to catalyze H+ and FA transport across the membrane, but these observations lack support at the molecular and structural level. It is unclear how long-chain FA, which differs significantly from the typical substrates of mitochondrial carriers (nucleotide and carboxylate), interacts with UCPs. There is also not a model describing how GDP blocks FA activation of UCPs. Furthermore, the current functional data lack the definitive molecular information and functional mutagenesis needed to show direct link between the events of FA and H+ transport. In earlier study, we developed a nuclear magnetic resonance (NMR) procedure that enabled the backbone structure determination of UCP2 (Fig. 1A) reconstituted in mixed detergent/lipid micelles (Berardi et al., 2011). The structure shows that UCP2 has a similar fold as the ADP/ATP carrier (Pebay-Peyroula et al., 2003): an open-top barrel architecture formed with three pseudo structural repeats, each consisting of two transmembrane (TM) helices (denoted by ‘H’) and an intervening amphipathic helix (‘h’) (Fig. 1B).
Figure 1. Specific Perturbation of UCP2 Chemical Environment by C16 Fatty Acid.
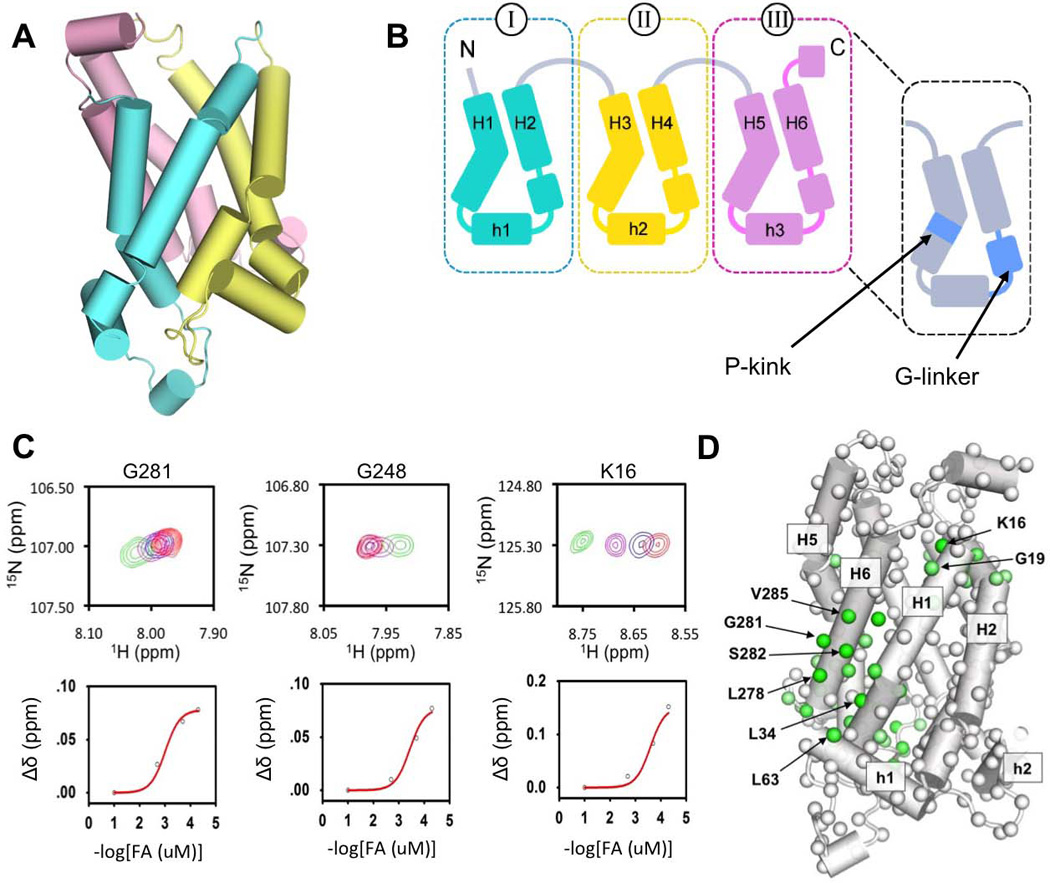
A. Cartoon representation of a backbone structural model of UCP2 (PDB code: 2LCK) derived from NMR measurements, in which domain I, II, and III are shown in cyan, yellow, and pink, respectively.
B. A drawing of UCP2 topology for illustrating the secondary structures and key structural motifs.
C. Regions of 3D TROSY HNCO of UCP2 for showing the specific chemical shift perturbation upon titrating the protein with C16-FA (the 1H-15N planes are collapsed in the 13C’ dimension). For residues Gly293 and Gly260, the fitting yields approximate dissociation constant (KD) of 600±200 µM.
D. Mapping chemical shift changes to the structural model of UCP2. The combined chemical shift deference (Δδ = [(ωHΔδH)2 + (ωN ΔδN)2 + (ωC ΔδC)2]1/2 with ωH = 1.00, ωN = 0.15, ωC = 0.35) between residue pairs in the wtUCP2-GDP complex (0.6 mM UCP2, 5 mM GDP) and the wtUCP2-FA complex (0.6 mM UCP2, 10 mM FA, 0.05mM GDP) are depicted by a linear color spectrum scale from Δδ = 0.5 ppm (green) to Δδ = 0.03 ppm (white).
Here, we show by NMR that FA binds to a peripheral site of UCP2 between TM helices H1 and H6 near the matrix side of the protein. NMR data also indicate that GDP binding inside the UCP2 cavity can allosterically displace FA from the peripheral site. Guided by the structural information, we performed functional mutagenesis and show that mutations that weaken FA binding reduce UCP2-mediated H+ transport and ASO− flipping across lipid bilayer. Moreover, mutations of UCP2 that reduce ASO− flipping also reduce H+ transport. Our structural and functional data together explain the interplay of FA and nucleotides in determining the H+ translocation function of UCP2.
RESULTS
FA Binds to UCP2, Causing Specific Changes to the UCP2 Chemical Environment
We first characterized FA-UCP2 interaction by NMR titration. As in earlier study (Berardi et al., 2011), we reconstituted functional murine UCP2 in mixed detergent/lipid micelles (foscholine-12 (DPC), 14:0 cardiolipin (CL), dimyristoyl-sn-Glycero-3-Phosphocholine (PC), 1,2-diphytanoyl-sn-glycero-3-phosphate (PL)) in the presence of 5 mM GDP. GDP is an inhibitor of UCP2 and it was included earlier to enhance protein thermo stability for structural studies. The large amount of inhibitor is not suitable for FA titration as it affects FA binding. During the preparation of the UCP2-FA samples, GDP concentration was reduced to 50 µM and kept constant at all points of FA titration. The small amount of GDP maintained the protein sufficiently stable for NMR sample preparations. We then performed titration experiment using C16FA in the presence of 50 µM GDP. FA was titrated into UCP2 (~1 mM) at several FA:UCP2 ratios, ranging from 0.05 to 20. Residue specific NMR chemical shift changes, as measured using a series of 3D TROSY-HNCO spectra (Fig. 1C), show clear trend of binding saturation with the lowest dissociation constant (KD) estimated to be 600±200 µM. The data also show that larger FA-induced chemical shift changes map primarily to TM helices H1 and H6, but also parts of H2 and H5 (Fig. 1D).
FA Binds to the Periphery of UCP2 and Can Be Allosterically Displaced by GDP
Chemical shift perturbation could have arisen from ligand directly and/or binding-induced conformational change. To directly locate FA, we used a paramagnetic analog of C16FA, 5-Doxyl-C18 FA (NO-FA). Titrating increasing amounts of NO-FA into UCP2 caused broadening of a small subset of backbone resonances (Fig. 2A; columns 1–2 from the left), with the greatest paramagnetic relaxation enhancement (PRE) effects clustered around Leu278 on the lipid-facing side of H6. The PRE effects are consistent with the chemical shift changes but are more localized. In addition to the strongly broadened peaks, there are other regions of the protein that experience weaker PRE effects. Since FA has very low solubility in water, it can partition preferentially to detergent micelles leading to non-specific PRE effects on the peripheral regions of the protein.
Figure 2. PRE Measurements for Mapping Interaction Between UCP2 and NO-FA and Specific Displacement of NO-FA by GDP.
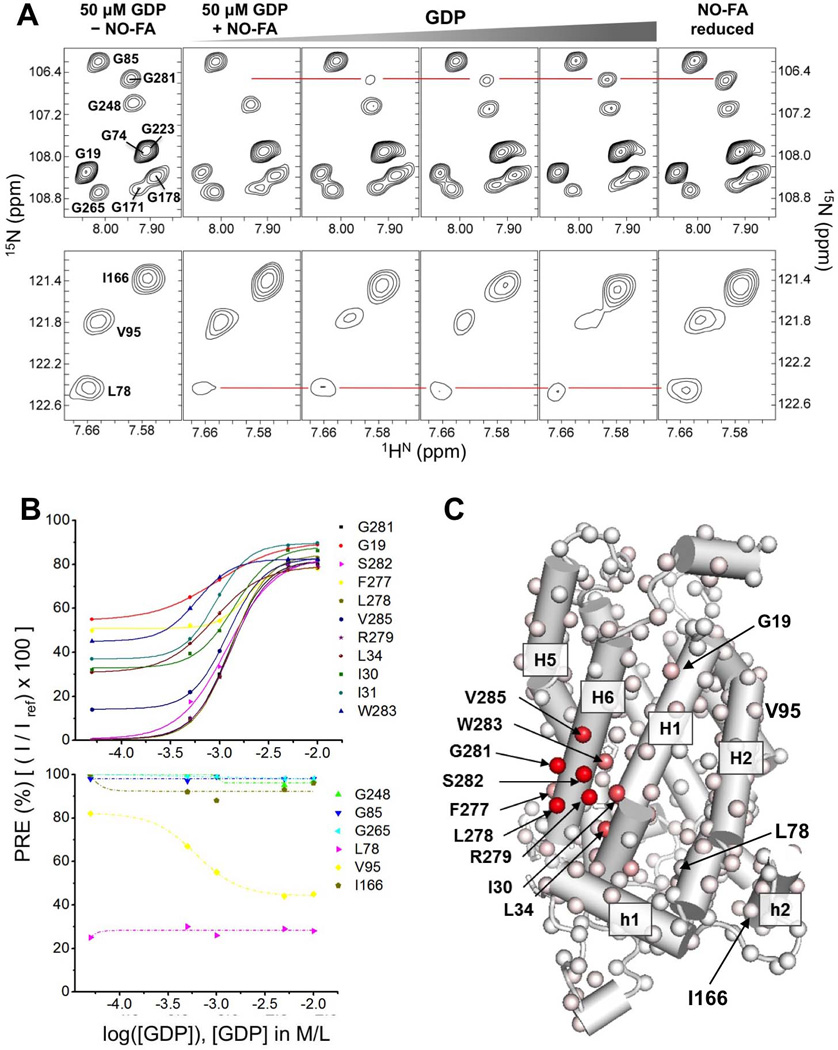
A. Regions of 2D 1H-15N TROSY HSQC spectrum of UCP2 show specific broadening of NMR peaks by nitroxide-labeled FA (NO-FA) and the recovery of broadened peaks by the addition of GDP. From the left, the first column shows peaks from the spectrum recorded in the absence of NO-FA and in the presence of 50 µM GDP. The second column shows intensity reduction of Gly19, Leu78, and Gly281 after the addition of 0.25 mM NO-FA. Columns 3–5 are spectra recorded upon incremental addition of 0.5, 1.0, and 10 mM GDP, showing gradual recovery of the NMR resonances of Gly19 and Gly281 with increasing presence of GDP. Column 6 shows fully recovered NMR peaks upon reducing the spin label with ascorbic acid.
B. Plots of percent of NMR peak broadening vs. log of GDP concentration showing sigmoidal recovery of peak intensities for most of the strongly affected residues (e.g., G281 and S282), but not for some residues whose peaks are also severely broadened by NO-FA such as L78.
C Mapping of the PRE effects that are sensitive to GDP titration (with sigmoidal profile as shown in B) using linear color spectrum scale from complete broadening (red) to no broadening (white). In this analysis, the NMR peak intensities at 0.25 mM NO-FA and 50 µM GDP concentrations were obtained from 3D TROSY HNCO spectra.
Separating the specific from non-specific effects was difficult because there was no information about functionally relevant interaction between FA and UCPs. We observed that upon addition of GDP to the UCP2 NO-FA complex, only a subset of residues recover peak intensities, suggesting that the binding of GDP (the antagonist) is displacing the NO-FA from a specific site. In a reverse PRE experiment, we first saturated UCP2 with NO-FA (NO-FA:UCP2 ratio of 0.5:1), as indicated by the complete disappearance of certain NMR peaks, e.g., that of Gly281 (Fig. 2A; top second panel) and then recorded the changes on the PRE effect upon incremental addition of GDP to the NMR sample. Only a subset of the broadened peaks showed recovered intensity. For example, the NMR resonance of Gly281, which is initially reduced to below the noise level by the NO-FA, recovers to 90% of its original intensity at 10 mM of GDP (Fig. 2A; top panels 3–5), whereas the peak intensity of Leu78 of H2 is also severely broadened to about 20% but was not sensitive to increasing concentration of GDP (Fig. 2A; bottom panels 3–5). Moreover, the signal recoveries all demonstrated sigmoidal profile (Fig. 2B). We thus consider the PRE effects on Gly281 and Gly19 being associated to a functionally relevant FA-UCP2 interaction, as GDP displacing FA from its binding site is consistent with the antagonistic relation between the activator and inhibitor. The PRE effects on Leu78 and I166 are likely due to non-specific hydrophobic interactions. The above analysis was conducted for all severely broadened NMR resonances and those responded to GDP are mapped onto the structure (Fig. 2C). The results show that the approximate site of the relevant FA interaction consists of a lipid-facing hydrophobic groove between H1 and H6 near the matrix side of UCP2 and a number of basic residues including Arg60 and Lys271 (Fig. S2).
FA-Binding and GDP-Binding Support Different Conformations of H1 and H6 of UCP2
The FA acyl chain likely partitions near the hydrophobic groove, positioning its carboxylate head group for electrostatic interaction with the peripheral basic residues at the matrix side of the protein (Fig. 3A). As for GDP binding, we previously used spin-labeled GDP to map the region of GDP interaction in UCP2. The PRE results indicate that GDP binds deep inside the hydrophilic cavity of UCP2, with the pyrophosphate group near the proline kinks (Fig. 3B) (Berardi et al., 2011), which are the key structural signatures of mitochondrial carriers. This mode of nucleotide binding is consistent with the proposed ADP binding site in AAC (Dehez et al., 2008; Kunji and Robinson, 2006; Wang and Tajkhorshid, 2008); it is also consistent with the depth of ATP binding in UCP1, i.e., near the P-kinks about midway through the cavity, measured by atomic force microscopy (Zhu et al., 2013). The NMR measurements of FA and GDP interactions with UCP2 indicate allosteric interplay between FA and GDP in which GDP binding inside the cavity can displace FA from its binding site on the outside.
Figure 3. Structural Perturbation of FA-Bound UCP2 by GDP.
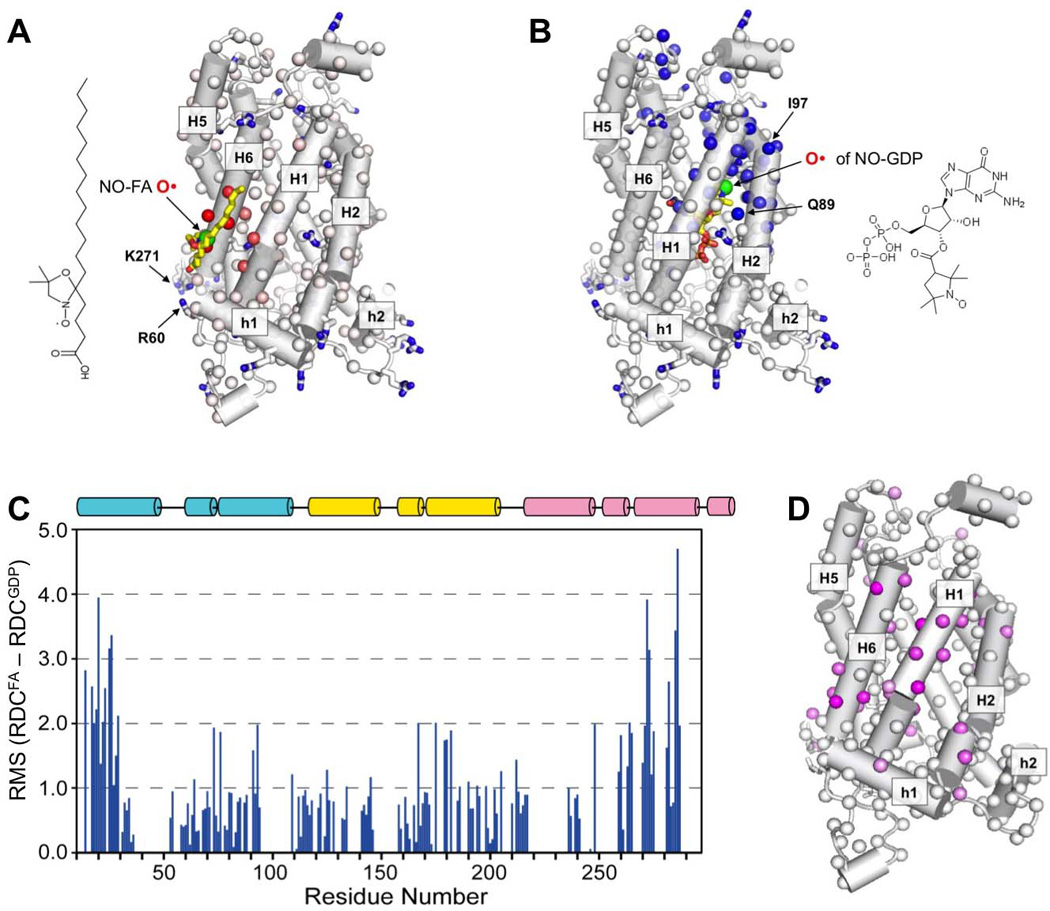
A. A model of NO-FA binding to UCP2 based on the PRE results. The NO-FA is placed such that 1) the mean distance between the spin-label (green sphere) and the strongest PRE effects (red spheres) in Fig. 2C is minimized, 2) the carboxylate group is close to the proximal basic residues Arg60 and Lys271, and 3) the acyl chain leans against the hydrophobic groove between H1 and H6. Only the side chains of the basic residues of UCP2 are displayed in the structure.
B. A model of NO-GDP binding to UCP2 based on the PRE results obtained previously in (Berardi et al., 2011). The NO-GDP is placed such that the spin-label (green sphere) of NO-GDP is close to the strong PRE effects (blue spheres) and that the electrostatic interaction between GDP and charged residues inside the cavity is maximized.
C. Residue-specific change in RDC upon adding 25 mM GDP to an aligned NMR sample of UCP2 with 10 mM FA. The RDC change is plotted as the RMS difference in RDCs (y-axis) between before and after the addition of GDP. In this analysis, both NH and C’Cα RDCs are used and the C’Cα RDCs are normalized to the NH RDCs.
D. Mapping RMSD values in (D) onto the UCP2 structure with the linear color spectrum scale from RMSD = 5.0 Hz (pink) to RMSD = 1.0 Hz (white). The large RMSD values are clustered around the FA binding site in (A), indicating conformational perturbation in this region of the protein.
By nature of allostery, GDP binding should induce change in conformation and/or dynamics at the FA interaction site. We thus performed RDC measurements to test this hypothesis, as RDCs are exquisitely sensitive to rearrangement of helical segments (Chou et al., 2001). In this experiment, we first weakly oriented UCP2 in DNA nanotube liquid crystal and measured RDCs for the backbone NH and C’Cα bond vectors in the presence of 10 mM FA. A second RDC dataset was collected after the addition of 25 mM GDP to the sample. Comparing the two datasets shows that the addition of GDP caused substantial changes in RDCs throughout UCP2 but the large majority of changes occur in H1 and H6 (Fig. 3C&D), which is consistent with local structural perturbation of H1 and H6 when GDP causes displacement of FA. RDC is a function of both structure and dynamics. Therefore, the changes in RDCs in H1 and H6 could have arisen from changes in conformation or dynamics or a combination of both.
FA Binding to the Peripheral Site Is Required for UCP2-Mediated H+ Translocation
We carried out functional mutagenesis to test whether FA binding to the NMR-derived site in UCP2 is involved in the process of H+ translocation. The overall composition of the FA binding site suggests that if the acyl chain of FA is placed along the hydrophobic groove between H1 and H6 (which would be consistent with its partitioning in a lipid bilayer), then the FA carboxylate head group would be in position for electrostatic interaction with one or more of the basic residues in the vicinity (Fig. 3A). These residues include Arg60 in the loop preceding the amphipathic helix h1 and Lys271 in the G-linker of Domain III (Fig. S2). We hypothesize that replacing these residues with uncharged amino acid should reduce UCP2 function by disrupting FA binding.
The R60S and K271S single mutants as well as the R60S/K271S double mutant were prepared using our standard UCP2 purification protocol and tested for H+ translocation using a liposome H+ flux assay (Fig. 4A). In this assay, fixed amount of wild type (WT) UCP2 or mutants was reconstituted into liposomes that contain the fluorescent pH sensitive probe HPTS (8-Hydroxypyrene-1,3,6-Trisulfonic Acid) (Experimental Procedure). At the beginning of the experiment, the pHs inside and outside the liposomes are equal, but the internal pH increases due to H+ efflux driven by a Nernst potential generated by a K+ gradient. UCP2-FA mediated H+ efflux is GDP sensitive; it is the highest for the WT and significantly reduced for the mutants (Fig. 4B). We found that each of the R60S and K271S mutations reduces the initial rate of H+ flux to ~40% of the WT value. When the two mutations are combined, the rate further decreases to ~15% of that of the WT. In all three cases, H+ translocation can be inhibited by 100 µM of GDP, indicating that it is the specific activity of UCP2. These results together suggest that FA binding to the peripheral site of UCP2 between H1 and H6 is at least one of the required steps in the process of H+ translocation.
Figure 4. Effect of Mutations on UCP2-Mediated H+ Translocation.
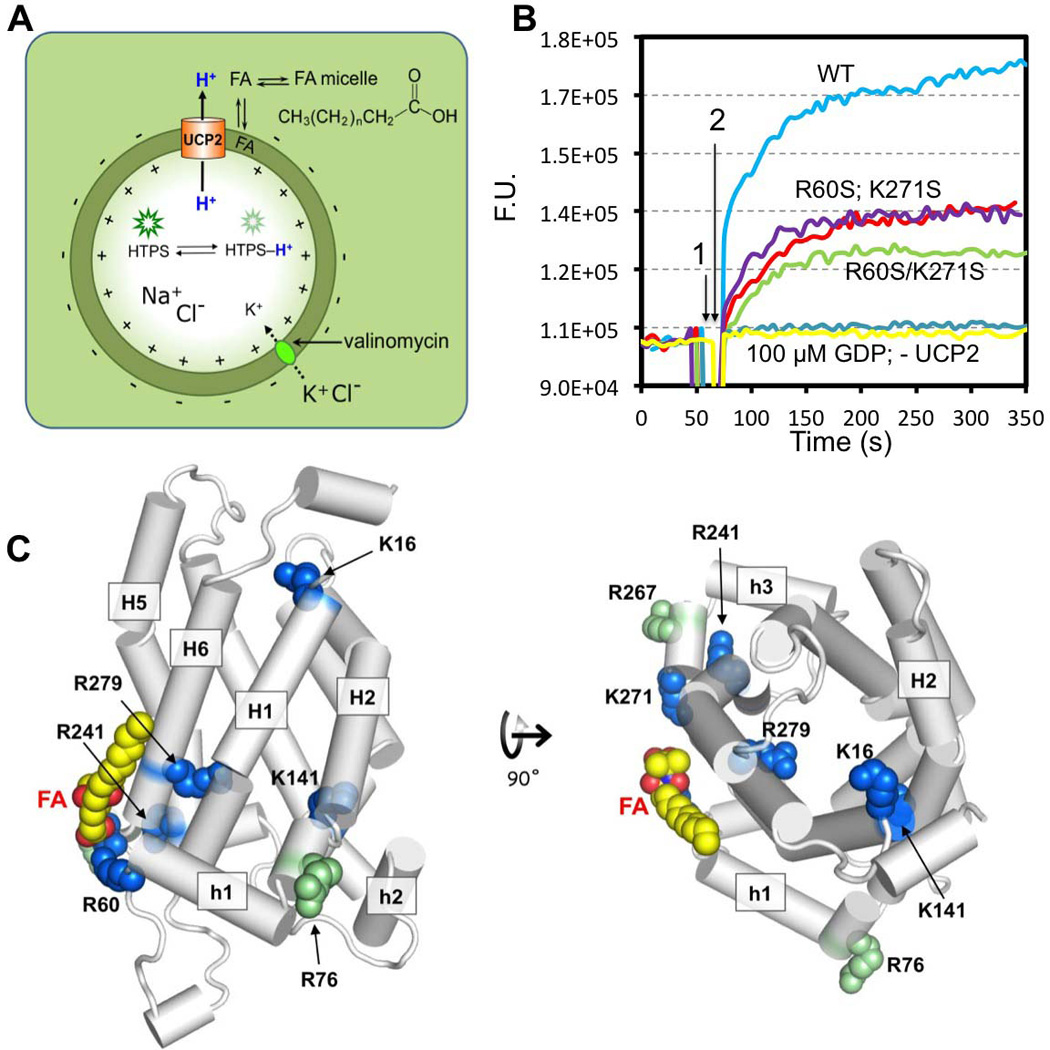
A. Schematic drawing of the liposome based assay for measuring UCP2-mediated H+ translocation across lipid bilayer. In this assay, UCP2 is incorporated into liposomes with random inward and outward orientation, and the pH-sensitive fluorescent dye, HTPS, is encapsulated in the liposomes. Initially, both sides of the bilayer are maintained at pH 6.0 with 10 mM MES buffer. The interior solution contains 5 mM KCl and 95 mM NaCl, whereas the exterior solution contains 100 mM KCl. FA, which is required for UCP2-mediated H+ flux, is added to the external solution. To drive H+ efflux, as mediated by UCP2 and FA, a K+ gradient, or equivalently, membrane potential is introduced by the addition of 4 µM valinomycin. The rate of H+ conduction is measured as increase in fluorescence as H+ leave the liposome lumen.
B. Time traces of fluorescence change from the assay in (A). Time points 1 and 2 correspond to the addition of FA and valinomycin, respectively. Traces are shown for the WT UCP2 (blue), the R60S mutant (magenta), the K271S mutant (red), and the R60S/K271S double mutant (green). The gray trace is from wtUCP2 liposomes pre-incubated with 100 µM GDP, and similar traces of inhibition were observed for the mutants. Estimation of the initial H+ efflux rates using linear approximation are shown in Fig. S3B.
C. Single mutation position displayed in the context of the UCP2 structural model. Residues of which non-conservative mutation caused significant reduction in H+ transport are shown in blue. The mutations that do not affect H+ transport are shown in green.
In addition to R60S and K271S, we also tested basic residue mutations farther away from the FA binding site, including single mutations K16S, R76S, K141T, K241S, K267S, and R279T. To our surprise, most of the mutations except for K267S and R76S have significant (> 20%) reduction in H+ flux (Fig. 4C; Fig. S3). This suggests that basic residues both inside and outside the cavity contribute to UCP2 activity.
UCP2 Can Catalyze the Flipping of ASO−, an Analog of Ionized FA, Across Lipid Bilayer
Having identified the site of FA binding and its involvement in H+ translocation, we next developed a new liposome based assay to investigate the ability of UCP2 to flip ionized FA across the lipid bilayer. In this assay, a water-soluble fluorescent FA binding protein (FABP), for which FA binding shifts the fluorescence emission wavelength from 432 nm to 505 nm (Richieri et al., 1992), was encapsulated inside liposomes with incorporated UCP2 (Experimental Procedures). FA was then added to the external buffer solution. UCP2-catalyzed flipping of FA from the outer to inner leaflet of the liposome membrane can be monitored, in principle, by the change in fluorescence emission of the FABP (Fig. 5A). There was, however, a technical issue with this approach. The pKa of FAs (e.g., oleic acid) in membrane at concentrations above their critical micellar concentration is ~ 7.5 (Kamp and Hamilton, 1992). Therefore, at physiological pH, a significant portion of FAs is protonated or unionized in membrane and thus FA flip-flop is fast. It has been reported that t1/2 of flip-flop of unionized oleic acid in lipid vesicle is 23 ± 12 ms (Kamp et al., 1995). The fast flip-flop of FA made it extremely difficult to capture the initial rate of FA binding to FABP, as the change in fluorescence saturates >80% within the time required to mix solutions in our assay (> 5 s).
Figure 5. Effects of Mutations on UCP2-Catalyzed ASO− Flipping.
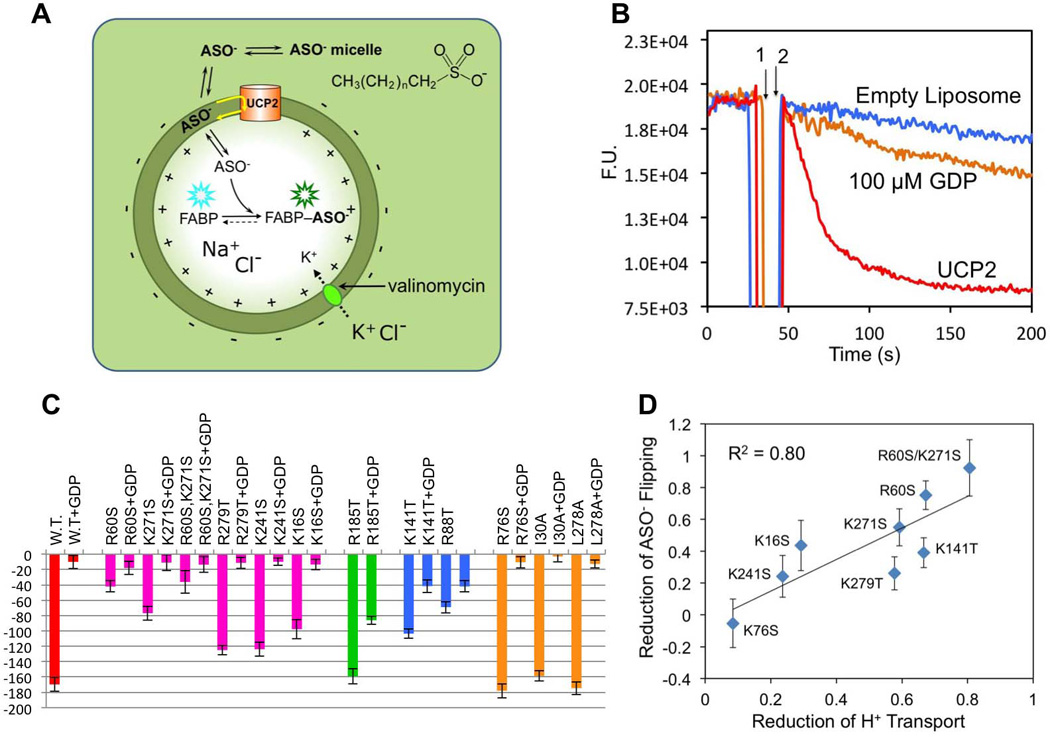
A. Schematic drawing illustrating the design of the liposome based assay for measuring UCP2-catalyzed flipping of ASO− across lipid bilayer. In this assay, UCP2 is incorporated into liposomes with random orientation, and the fluorescent FA binding protein (FABP), which also binds ASO−, is encapsulated in the liposomes at about 1 µM FABP per liposome. Addition of ASO− to the external solution leads to spontaneous partitioning of ASO− in the outer leaflet of the liposome. If UCP2 can catalyze the flipping of ASO− across the lipid bilayer, then ASO− can bind FABP in the liposome lumen, which causes a shift in the fluorescence emission peak from 432 to 505 nm. To drive ASO− flipping in the assay, a K+ gradient or equivalently membrane potential is introduced by the addition of valinomycin to the liposome. The interior solution contains 5 mM KCl and 95 mM NaCl whereas the exterior solution contains 100 mM KCl, in a 10 mM MES buffer at pH 6.0.
B. Time traces of fluorescence change from the assay in (A). After the addition of 100 µM ASO− (1) and 4 µM valinomycin (2) to the external solution, the liposomes without UCP2 shows insignificant change in fluorescence (blue). Liposomes with UCP2 showed a sharp drop in fluorescence emission (red). To test inhibition by GDP, 100 µM GDP was added and followed by mild sonication to allow equilibration of GDP between inside and outside of the liposome. GDP caused > 90% inhibition of ASO− flipping (orange).
C. Bar graph for comparing the rates of ASO− flipping by UCP2 variants in the absence and presence of GDP. The rates are calculated for the traces shown in (Fig. S5B) by fitting to a single exponential model using the program Origin.
D. Correlation between reduction in ASO− flipping and reduction in H+ translocation caused by various mutations. The reduction relative to the WT is defined as (RateWT – RateMUT) / RateWT.
To circumvent the problem, we used the C16 alkyl sulfonate (ASO−) that does not flip-flop (pKa ~ 1). We found that the FABP also binds ASO− with high affinity and binding shifts the emission as in the case of FA (Fig. S4A). Moreover, titrating ASO− into UCP2 induced NMR chemical shift perturbation very similar to that caused by FA, indicating that ASO− and FA both bind to the same peripheral site of UCP2 (Fig. S4B&C). In the absence of UCP2, addition of ASO− to the external buffer did not cause any significant change in the fluorescence (Fig. 5B; blue trace), indicating that ASO− flip-flop rate in membrane is very slow. In the presence of UCP2, however, sharp change in fluorescence was observed (Fig. 5B; red trace), indicating a sharp increase in ASO− flipping. We can conclude that the increased ASO− flipping is catalyzed by UCP2, as the activity can be largely inhibited by the addition of 100 µM GDP (Fig. 5B; orange trace).
UCP2-Catalyzed FA Flipping Is Required for UCP2-Mediated H+ Translocation
The proteoliposome assays above show separately that UCP2-mediated H+ transport requires FA binding and that UCP2 has the ability to catalyze the flipping of ASO− or ionized FA across the membrane. But the relation between FA flipping and H+ transport, which is the essence of the protonophoretic model, has not been examined experimentally. We sought to investigate possible link between this two functions of UCP2 by comparing their sensitivities to various mutations. We tested an extensive collection of mutations for their effect on UCP2-catalyzed ASO− flipping. The mutations cover not only regions close to the FA binding site but also more remote sites inside and outside the hydrophilic cavity of the protein, including those believed to involve in GDP binding (Fig. 5C; Fig. S4D; Table S1). For the subset of mutations that overlap with those tested for H+ flux (Fig. 4), their effects of reducing ASO− flipping correlate strongly with that of reducing H+ flux, with a correlation coefficient of ~ 0.8 (Fig. 5D). This observation provides strong evidence showing that UCP2-catalyzed FA flipping is required for H+ translocation.
Positively Charged Residues Inside and Outside UCP2 Cavity Are Important for ASO− Flipping
The effects of mutations (Fig. 5C; Fig. S4D) can be grouped into four categories. One effect is significant reduction of ASO− flipping but not GDP inhibition. Mutations that cause this effect include single mutations R60S, K271S, K241S, R279T, and K16S, and the double mutation R60S/K271S. The peripheral basic residues Arg60 and Lys271 are in position for electrostatic interaction with the acidic head group of ASO− (Fig. 6A). Therefore, mutating each or both of them to serine may have reduced ASO− flipping simply by affecting initial docking of ASO− to the specific site on UCP2. The three other mutations K241S, R279T, and K16S are not straightforward to understand, as they do not appear to be directly interacting with ASO− in the current structural model of UCP2. Among them, Lys241 and Arg279 are close to the FA binding site and thus may contribute to the electrostatic potential that recruits ASO−, but Lys16 is located on the opposite side of the protein. Another effect is significant reduction of GDP inhibition but not ASO− flipping. The only mutation we tested that causes this effect is R185T of H4. According to the GDP binding model proposed earlier (Berardi et al., 2011), Arg185 is in position for charge-charge interaction with GDP inside the cavity (Fig. 6B). Mutating Arg185 to threonine may weaken GDP binding and thereby reduces inhibition by GDP. In addition to Arg185, the cavity-lining basic residues, Arg88 of H2 and Lys141 of H3, also appear to participate in GDP binding in the model (Fig. 6C). Indeed, mutating them to threonine causes significant decrease in inhibition by GDP. But, unlike the R185T mutation, the R88T and K141T mutations, which are far away from the FA binding site, also cause significant reduction in ASO− flipping. Finally, several mutations affect neither ASO− flipping nor GDP inhibition, and these include R76S, I30A, and L278A (Fig. 6D).
Figure 6. Effects of Mutations on ASO− Flipping: Importance of Positively Charged Residues.
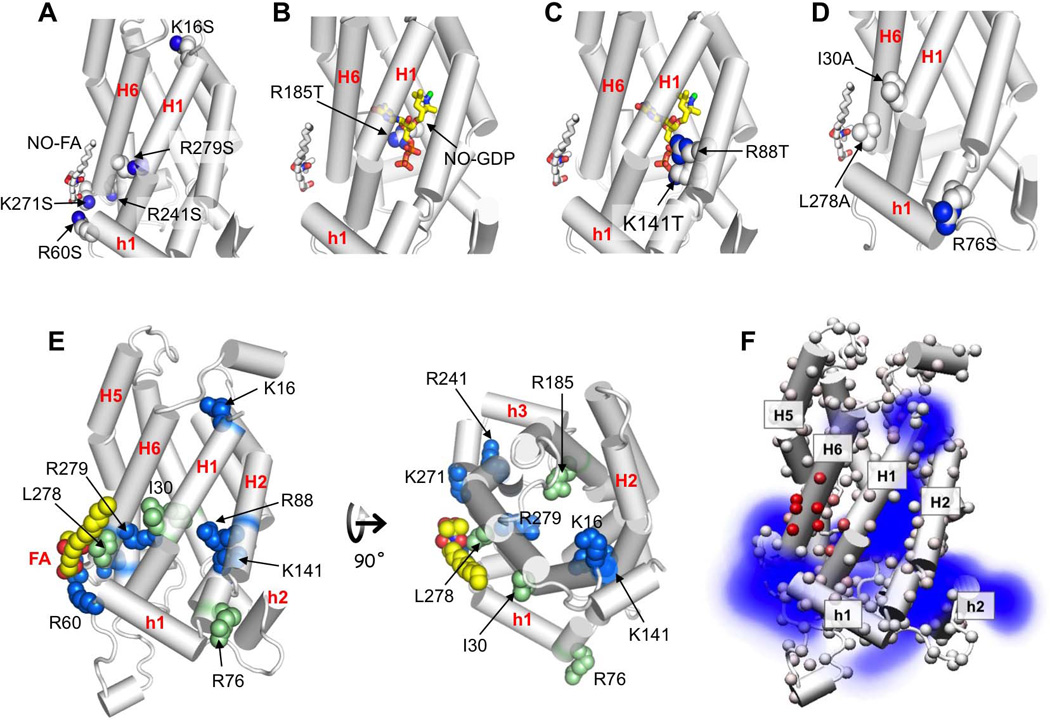
A. Mutations that caused significant reduction of ASO− flipping but not GDP inhibition.
B. Mutations that caused significant reduction of GDP inhibition but not ASO− flipping.
C. Mutations that caused significant reduction for both GDP inhibition and ASO− flipping.
D. Mutations that affected neither ASO− flipping nor GDP inhibition.
E. Single mutation position displayed in the context of the UCP2 structural model. Residues of which non-conservative mutation caused significant reduction in ASO− flipping are shown in blue. The mutations that do not affect H+ transport are shown in green.
F. Average electrostatic potential of the 15 low energy conformations of UCP2 (PDB code: 2LCK), calculated using the program Delphi (Li et al., 2012) and presented as a density map. For clarity, only the positive component (blue) of the electrostatic potential map is displayed, which shows strong and continuous positive charge distribution from the periphery to the cavity of UCP2.
The model used in this figure is the NMR-derived backbone structure of UCP2 in the presence of GDP (PDB code: 2LCK). It is not the conformation of the FA-bound UCP2. The NO-FA and NO-GDP are shown to provide reference points for the mutations.
The mutational effects above are overall consistent with FA recruitment to the peripheral site between H1 and H6 via electrostatic interaction. But, in addition to the peripheral residues such as R60, K271 and R241, several basic residues inside the cavity including K16, R88, K141, and R279 also appear to contribute significantly to ASO− flipping in our assay (Fig. 6E). These basic residues may facilitate ASO− flipping by contributing to the positive potential (Fig. 6F) that draws the acidic head group of ASO− into the UCP2 cavity. On the other hand, the I30A and L278A mutations in the hydrophobic groove between H1 and H6 do not affect ASO− flipping, suggesting that hydrophobic interaction with the acyl chain of ASO− is not a determinant of specific ASO−-UCP2 recognition. In theory, the acyl chain of FA or ASO− is a poor molecular target for specificity in the lipid bilayer, given the large presence of lipid acyl chains around the protein. Our mutagenesis data suggest that the ionized head group of FA holds the specificity for binding and flipping, and that basic residues both inside and outside UCP2 cavity constitute an electrostatic path (Fig. S5) for the initial recognition of ASO− and subsequent transport through the cavity.
DISCUSSION
A model for UCP2 activation by FA and inhibition by GDP can be constructed based on the conclusions drawn from our NMR and functional data as well as previously published results (Fig. 7). Protonated FA carries H+ from the outer to inner face of the inner membrane. Upon releasing the H+ to the matrix, the ionized FA binds specifically to a peripheral site of UCP2 between the H1 and H6 near the matrix side of the protein. GDP, which has been shown earlier to bind inside the UCP2 cavity, can displace FA from its peripheral site. The RDC measurements indicate that the antagonistic effect of GDP is due to an allosteric mechanism by which GDP binding induces change in conformation and/or dynamics of H1 and H6 such that the peripheral site for FA is adversely disrupted. The different structures compatible with FA and GDP binding is consistent with earlier observation that FA and GDP impose opposite effects on UCP2 activity, i.e., GDP inhibits FA-UCP2 mediated H+ conduction in proteoliposomes but the inhibition can be reversed by increasing FA concentration (see Fig. S2e of (Berardi et al., 2011)). The cellular concentration of free GDP/GTP is 100–500 µM (Traut, 1994). According to our observation of complete inhibition of UCP2 activity at 100 µM GDP, we expect UCP2 to be constitutively inhibited by the free GDP. It is possible that the physiological role of GDP inhibition is to constitutively suppress the activity of UCP2 unless activated by a surge of free FA that enter the mitochondria.
Figure 7. A Model for the Interplay Among FA, UCP2, and GDP in Modulating H+ Translocation Across the Mitochondrial Inner Membrane.
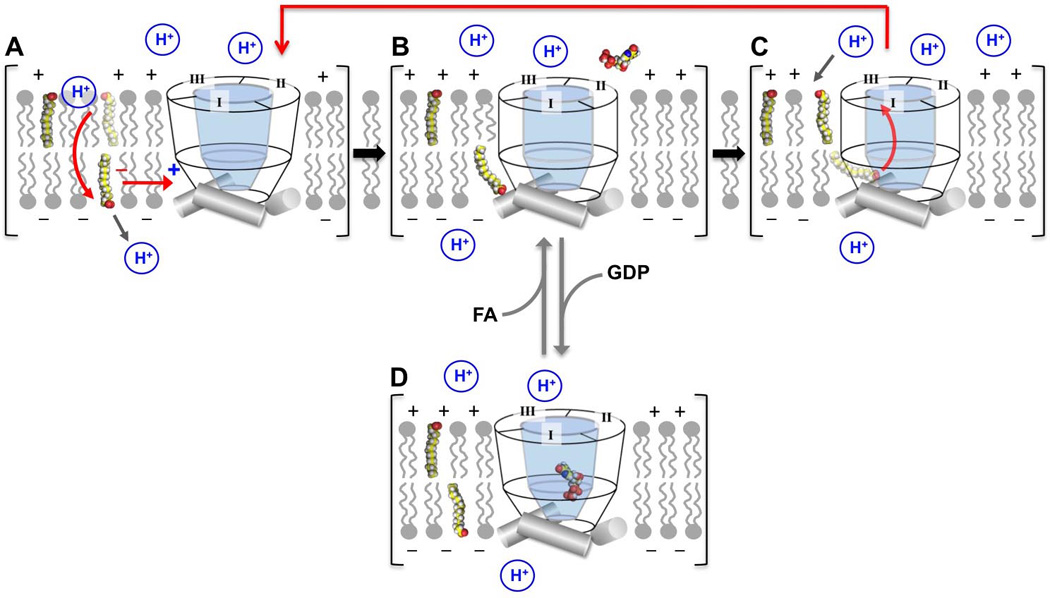
A. Protonated or unionized FA readily undergo flip-flop that carries H+ across the lipid bilayer. Upon releasing the H+ to the matrix, the ionized FA is recruited to the peripheral binding site of UCP2 via electrostatic interaction.
B. Binding FA causes minor structural change in UCP2 which allows the acidic head group of FA to enter the cavity of UCP2.
C. Upon entering the cavity, the acidic head group of FA is retained by the strong positive charge potential of the cavity while being driven across the UCP2 by the strong membrane potential.
D. GDP binding inside the cavity can allosterically displace FA from its binding site, which prevents FA flipping by UCP2 and thus makes H+ shuttling by FA unsustainable.
The liposome-based functional assays show that UCP2 can catalyze the flipping of C16 ASO− across the membrane and this activity can be inhibited by GDP. Although the time resolution of the assay is only sufficient for measuring UCP2-mediated flipping of ASO−, we argue that the same activity of UCP2 should apply to ionized FA because 1) ASO− binds to the same site in UCP2 as FA, as indicated by NMR titration data and 2) mutations in UCP2 that weaken FA binding also reduce the rate of UCP2-mediated ASO− flipping. Furthermore, mutations that reduce UCP2-catalyzed ASO− flipping also reduce FA-UCP2-mediated H+ flux. These results together indicate that FA binding to UCP2 and FA flipping by UCP2 are tightly coupled to H+ translocation, which in turn suggests that H+ from the intermembrane space is carried across the inner membrane as a part of unionized FA and UCP2 allows the recycling of ionized FA. This mechanism is consistent with the previous observation that UCP1-mediated H+ translocation in the presence of FA can be inhibited by addition of ASO− (Garlid et al., 1996), which competes with FA for binding to UCP but does not carry H+ at physiological pH.
The current data cannot provide details of the dynamic changes in UCP2 during the FA flipping process. We believe that in order for the ionized FA to flip across the membrane within functionally relevant timescale, the charged carboxylate head group must enter the hydrophilic cavity to circumvent the hydrophobic barrier of the lipid bilayer. In this case, FA first docks at the peripheral site via electrostatic interactions between its head group and the surface exposed basic residues at the binding site between H1 and H6. After initial docking in the vicinity of residues Arg60 and Lys271, the acidic head group can enter the cavity by interacting with other basic residues inside the cavity, e.g., Arg88, Lys141, and Arg279. The structural difference in H1 and H6 between the FA- and GDP-bound states, as indicated by RDC data, suggests that this region of UCP2 has the conformational variability to undergo the necessary changes to allow easy entrance of the FA head group.
In summary, the model presented in Fig. 7, in which UCP2 acts more as a FA flippase than a H+ conductor, provides physical and molecular basis of the interplay of FA and GDP in modulating UCP2-mediated H+ translocation. UCP2 belongs to a family of mitochondrial carriers whose canonical function is transporting negatively charged substrates such as carboxylates and nucleotides. The FA cycling mechanism proposed earlier for UCP1 (Garlid et al., 1996) suggests an intriguing exception, i.e., rather than transporting soluble substrate, UCP1 catalyzes the flipping of ionized FA partitioned in the membrane, which indirectly allow for sustained shuttling of H+ by FA. We show that long-chain FA in hydrophobic environment can directly bind to UCP2 at a peripheral site and that such binding is essential for UCP2-mediated H+ translocation and FA flipping. UCP2 is thus a special carrier protein that has developed the ability to recruit the acidic carboxylate of FA laterally from within the membrane, rather than receiving substrates longitudinally from either side of the membrane as in the classic alternating access mechanism of solute carriers. While the peripheral basic residues mediate FA recognition through charge-charge interactions, the external charge potential continues into and through the UCP2 cavity due to the basic residues inside. UCP2 appears to have adopted the electrostatic potential to attract the acidic head group of FA into the cavity and to facilitate its transport during FA flipping.
It is not surprising that UCP2 can also bind nucleotides such as GDP because it has over 20% sequence identity with the ADP/ATP carrier. But, UCP2 has evolved to bind the nucleotides but not transport them, in which case the substrates become inhibitors. We show that GDP binding in the UCP2 cavity can allosterically displace FA from its binding site on the periphery, which prevents FA flipping and thus H+ translocation. The newly described physical basis of UCP2 activation by FA and inhibition by GDP demonstrates the remarkable evolution of a mitochondrial carrier, which possibly transformed a nucleotide transport mechanism into a regulatory component of a FA flippase activity, while preserving the overall architecture of the carrier proteins.
EXPERIMENTAL PROCEDURES
Expression and Purification of UCP2
Mouse UCP2 (residues 14–309 with a C-terminal His6 tag) was expressed using a pET-21 vector in E. Coli Rossetta DE3 cells and purified as in previous study (Berardi et al., 2011). A more detailed protocol used for protein preparation in this study is in Supplementary Experimental Procedures.
NMR Titration Experiments
The UCP2-FA samples were prepared using the UCP2-GDP NMR sample as a starting point. First, the buffer was exchanged using a G25 column equilibrated in Buffer C (30 mM potassium phosphate, 0.1% DPC, 0.05 mM GDP, and 80 mM NaCl, pH 6.5). The UCP2 containing fraction was concentrated to ~0.6 mM protein and then dialyzed against Buffer C using a 10 kD MW cutoff membrane. FA or ASO− was added to the desired concentrations using a 100 mM stock solutions in 200 mM potassium phosphate (pH 6.5) and 2% DPC. For PRE experiments, we used a stock dispersion at 2.5 mM of FA-NO (5-DOXYL-stearic acid, Sigma) in 30 mM potassium phosphate (pH 6.5) and 1% DPC. Displacement of NO-FA by GDP was performed using a 0.6 mM UCP2 sample initially containing 0.3 mM NO-FA. GDP was added directly to the NMR sample as a stock solution (400 mM GDP, pH 6.5 and 0.1% DPC) to reach 0.1, 0.5, 1.0, 5.0 and 10 mM final GDP concentrations.
Since FA induced chemical shift changes are overall small, the backbone resonance assignments of the FA-bound UCP2 could be traced from those of GDP-bound UCP2 from earlier study (Berardi et al., 2011) by recording a series of 3D HNCO-TROSYs at different FA concentrations. The assignments of FA-bound UCP2 were also validated using a 3D HNCA-TROSY spectrum.
NMR RDC Measurement
RDC measurements were conducted using UCP2 weakly aligned in DNA nanotube liquid crystal as described in previous studies (Berardi et al., 2011; Douglas et al., 2007) (details in Supplementary Experimental Procedures). To prepare the aligned UCP2 sample, we mixed 300 µl of 25 mg/ml DNA nanotubes and 300 µl of 0.5 mM 15N/13C/2H labeled UCP2 sample containing 50 µM GDP, 10 mM C16FA, 100 mM DPC, 10 mM potassium phosphate (pH 6.5), and 80 mM NaCl. The mixture was concentrated down to ~280 µl. The HDO of the final aligned sample showed 2H quadrupolar splitting of 3.8 Hz. The same sample was then made to contain 25 mM GDP while all other components were kept fixed. This sample showed 2H quadrupolar splitting of 3.6 Hz. The RDCs in the presence of GDP are thus scaled by the factor 3.8/3.6.
The H+ Translocation Assay
The UCP2 proteoliposomes were first made using a lipid composition of DOPC:DOPG:DOPE:CL (Avanti) at 20:5:1:1 molar ratio. A lipid solution containing 20 mg lipids/ml dissolved with 10% detergent (1:1 ratio of DM:OG) was prepared using Buffer D (10 mM MES, 95 mM NaCl, and 5mM KCl, pH 6.0). A 0.5 mM UCP2 sample in NMR buffer was mixed with the lipid solution at 400:1 lipid:protein ratio and then diluted 20× to a lipid concentration of 1mg/ml with Buffer D in the presence of 10 µM HPTS (8-Hydroxypyrene-1,3,6-Trisulfonic Acid) (Sigma), a fluorescent pH sensitive probe. Detergent removal was performed twice using a G25 desalting column equilibrated with Buffer D. The resulting proteoliposomes contained the fluorescent probe and were stable at room temperature. The proteoliposome solution was further diluted 10–15× with Buffer D (10 mM MES and 100 mM KCl, pH 6.0).
For measuring H+ translocation, 100 µM C16-FA was added to the external solution because FA is required for UCP2 activity. In addition, 1 µM valinomycin (Sigma) was added to the external solution to establish K+ electrochemical potential to drive H+ efflux. At the beginning of the experiment, pHs inside and outside of the proteoliposomes are equal. UCP2-mediated H+ translocation resulted in internal pH increase, observed as a function of the HPTS florescence intensity at 510 nm (λex 460 nm) using a dual monochromator fluorometer equipped with a photomultiplier detection system (PTI, Model 814), For measuring GDP inhibition, 100 µM GDP was added to the external solution.
The ASO− flipping assay
In this assay, UCP2 proteoliposomes were made using a similar protocol as in the H+ translocation assay except the fluorescent probe to be encapsulated is a water-soluble acrylodan labeled FA binding protein (ADIFAB, FFA Sciences) (Richieri et al., 1992), for which FA or ASO− binding shifts the fluorescence emission wavelength from 432 nm to 505 nm. Again, the lipid composition used is DOPC:DOPG:DOPE:CL at 20:5:1:1 ratio. A lipid solution containing 20 mg lipids/ml dissolved with 10% detergent (1:1 ratio of DM:OG) was prepared using Buffer E (10 mM HEPES, 95 mM NaCl, 5mM KCl, and 0.5 mM EGTA, pH 7.0). EGTA was added to increase reproducibility since the fluorescence of ADIFAB is sensitive to Ca2+. A 0.5 mM UCP2 sample in NMR buffer, pretreated with Bio-Beads SM-2 to remove endogenous FA, was mixed with the lipid solution at 400:1 lipid:protein ratio and then diluted 20× to a lipid concentration of 1 mg/ml with Buffer E plus 2 µM ADIFAB. Detergent removal was performed by loading 500 µl of the protein/lipid/detergent solution onto a long G-50 Sephadex column equilibrated with Buffer E. Only the front 30% of the elution peak containing proteoliposomes was used in the assay. Well-formed liposomes ranging from 100 to 250 nm were observed using electron microscopy. The proteoliposome solution was further diluted 10× with Buffer F (10 mM HEPES, 100 mM KCl, and 0.5 mM EGTA, pH 7.0).
For measuring ASO− flipping, 100 µM ASO− was added to the external solution, which was immediately followed by the addition of 4 µM valinomycin to establish a K+ electrochemical potential to drive the transport reaction. Flipping of ASO− from the outer to inner leaflet of the liposome membrane resulted in ASO− binding to ADIFAB, which was monitored at 435 nm (λex 380 nm) using a spectrofluorometer (PTI, Model 814). The UCP2 proteoliposomes showed sharp decrease in emission at 435 nm upon the addition of ASO− and valinomycin. UCP2-free liposomes however did not produce significant changes in fluorescence, indicating that ASO− does not flip by itself. For GDP inhibition, UCP2 proteoliposomes were first incubated with Buffer E in the presence of 100 µM GDP and were sonicated for 10 seconds in a bath sonicator (Branson 2510) to equilibrate the GDP inside the liposomes. This resulted in ~95% inhibition of the wtUCP2-catalyzed ASO− flipping. Addition of 4 µM valinomycin and 100 µM ASO− to the sonicated UCP2-free liposomes did not produce significant changes in fluorescence, indicating that ADIFAB leak is negligible.
Statistical Analysis
For liposome assays, the initial transport rates of pooled experiments are expressed as the mean value (µ) ± standard deviation (σ). In the ASO−/H+ transport correlation plot (Fig. 5), the error in the ratio of ASO− flipping of mutant to WT is given by (µMut/µWT) [(σMut/µMut)2 + (σWT/µWT)2]1/2. For NMR titration experiments, percent error in peak intensity is given by the inverse of the signal to noise (S/N) ratio. On average, the S/N ratio of the analyzed peaks is 55.8 ± 37.9. For RDC measurements, only peaks with S/N ratio > 8 are used.
Supplementary Material
Highlights.
Free fatty acid recognizes UCP2 at a peripheral site via electrostatic interaction
GDP binds inside UCP2 cavity and allosterically inhibits fatty acid recognition
UCP2 can catalyze the flipping of ASO− or ionized fatty acid across lipid bilayer
Flipping ionized fatty acid by UCP2 is required for UCP2-mediated H+ transport
ACKNOWLEDGMENTS
We thank Remy Sounier, Sven Brueschweiler, Qin Yang and Kirill Oxenoid for insightful discussions. We thank Jianghong Min and William Shih for preparing DNA nanotubes. This work was supported by NIH Grant GM094608 (to J.J.C.).
Footnotes
Publisher's Disclaimer: This is a PDF file of an unedited manuscript that has been accepted for publication. As a service to our customers we are providing this early version of the manuscript. The manuscript will undergo copyediting, typesetting, and review of the resulting proof before it is published in its final citable form. Please note that during the production process errors may be discovered which could affect the content, and all legal disclaimers that apply to the journal pertain.
REFERENCES
- Almind K, Manieri M, Sivitz WI, Cinti S, Kahn CR. Ectopic brown adipose tissue in muscle provides a mechanism for differences in risk of metabolic syndrome in mice. Proc Natl Acad Sci U S A. 2007;104:2366–2371. doi: 10.1073/pnas.0610416104. [DOI] [PMC free article] [PubMed] [Google Scholar]
- Berardi MJ, Shih WM, Harrison SC, Chou JJ. Mitochondrial uncoupling protein 2 structure determined by NMR molecular fragment searching. Nature. 2011;476:109–113. doi: 10.1038/nature10257. [DOI] [PMC free article] [PubMed] [Google Scholar]
- Cannon B, Hedin A, Nedergaard J. Exclusive occurrence of thermogenin antigen in brown adipose tissue. FEBS Lett. 1982;150:129–132. doi: 10.1016/0014-5793(82)81319-7. [DOI] [PubMed] [Google Scholar]
- Chou JJ, Li SP, Klee CB, Bax A. Solution structure of Ca2+-calmodulin reveals flexible hand-like properties of its domains. Nature Struct Biol. 2001;8:990–997. doi: 10.1038/nsb1101-990. [DOI] [PubMed] [Google Scholar]
- Dehez F, Pebay-Peyroula E, Chipot C. Binding of ADP in the mitochondrial ADP/ATP carrier is driven by an electrostatic funnel. Journal of the American Chemical Society. 2008;130:12725–12733. doi: 10.1021/ja8033087. [DOI] [PubMed] [Google Scholar]
- Derdak Z, Mark NM, Beldi G, Robson SC, Wands JR, Baffy G. The mitochondrial uncoupling protein-2 promotes chemoresistance in cancer cells. Cancer research. 2008;68:2813–2819. doi: 10.1158/0008-5472.CAN-08-0053. [DOI] [PMC free article] [PubMed] [Google Scholar]
- Douglas SM, Chou JJ, Shih WM. From the cover: DNA-nanotube-induced alignment of membrane proteins for NMR. Proceedings of the National Academy of Sciences of the USA. 2007;104:6644–6648. doi: 10.1073/pnas.0700930104. [DOI] [PMC free article] [PubMed] [Google Scholar]
- Fedorenko A, Lishko PV, Kirichok Y. Mechanism of fatty-acid-dependent UCP1 uncoupling in brown fat mitochondria. Cell. 2012;151:400–413. doi: 10.1016/j.cell.2012.09.010. [DOI] [PMC free article] [PubMed] [Google Scholar]
- Garlid KD, Orosz DE, Modriansky M, Vassanelli S, Jezek P. On the mechanism of fatty acid-induced proton transport by mitochondrial uncoupling protein. J Biol Chem. 1996;271:2615–2620. doi: 10.1074/jbc.271.5.2615. [DOI] [PubMed] [Google Scholar]
- Jaburek M, Varecha M, Gimeno RE, Dembski M, Jezek P, Zhang M, Burn P, Tartaglia LA, Garlid KD. Transport function and regulation of mitochondrial uncoupling proteins 2 and 3. J Biol Chem. 1999;274:26003–26007. doi: 10.1074/jbc.274.37.26003. [DOI] [PubMed] [Google Scholar]
- Kamp F, Hamilton JA. pH gradients across phospholipid membranes caused by fast flip-flop of un-ionized fatty acids. Proc Natl Acad Sci U S A. 1992;89:11367–11370. doi: 10.1073/pnas.89.23.11367. [DOI] [PMC free article] [PubMed] [Google Scholar]
- Kamp F, Zakim D, Zhang F, Noy N, Hamilton JA. Fatty acid flip-flop in phospholipid bilayers is extremely fast. Biochemistry. 1995;34:11928–11937. doi: 10.1021/bi00037a034. [DOI] [PubMed] [Google Scholar]
- Klingenberg M. Wanderings in bioenergetics and biomembranes. Biochim Biophys Acta. 2010;1797:579–594. doi: 10.1016/j.bbabio.2010.02.012. [DOI] [PubMed] [Google Scholar]
- Krauss S, Zhang CY, Lowell BB. The mitochondrial uncoupling-protein homologues. Nat Rev Mol Cell Biol. 2005;6:248–261. doi: 10.1038/nrm1592. [DOI] [PubMed] [Google Scholar]
- Kunji ER, Robinson AJ. The conserved substrate binding site of mitochondrial carriers. Biochim Biophys Acta. 2006;1757:1237–1248. doi: 10.1016/j.bbabio.2006.03.021. [DOI] [PubMed] [Google Scholar]
- Li L, Li C, Sarkar S, Zhang J, Witham S, Zhang Z, Wang L, Smith N, Petukh M, Alexov E. DelPhi: a comprehensive suite for DelPhi software and associated resources. BMC biophysics. 2012;5:9. doi: 10.1186/2046-1682-5-9. [DOI] [PMC free article] [PubMed] [Google Scholar]
- Lin CS, Klingenberg M. Isolation of the uncoupling protein from brown adipose tissue mitochondria. FEBS Lett. 1980;113:299–303. doi: 10.1016/0014-5793(80)80613-2. [DOI] [PubMed] [Google Scholar]
- Lin CS, Klingenberg M. Characteristics of the isolated purine nucleotide binding protein from brown fat mitochondria. Biochemistry. 1982;21:2950–2956. doi: 10.1021/bi00541a023. [DOI] [PubMed] [Google Scholar]
- Locasale JW, Grassian AR, Melman T, Lyssiotis CA, Mattaini KR, Bass AJ, Heffron G, Metallo CM, Muranen T, Sharfi H, et al. Phosphoglycerate dehydrogenase diverts glycolytic flux and contributes to oncogenesis. Nature genetics. 2011;43:869–874. doi: 10.1038/ng.890. [DOI] [PMC free article] [PubMed] [Google Scholar]
- Mills EM, Banks ML, Sprague JE, Finkel T. Pharmacology: uncoupling the agony from ecstasy. Nature. 2003;426:403–404. doi: 10.1038/426403a. [DOI] [PubMed] [Google Scholar]
- Mottillo EP, Bloch AE, Leff T, Granneman JG. Lipolytic products activate peroxisome proliferator-activated receptor (PPAR) alpha and delta in brown adipocytes to match fatty acid oxidation with supply. J Biol Chem. 2012;287:25038–25048. doi: 10.1074/jbc.M112.374041. [DOI] [PMC free article] [PubMed] [Google Scholar]
- Negre-Salvayre A, Hirtz C, Carrera G, Cazenave R, Troly M, Salvayre R, Penicaud L, Casteilla L. A role for uncoupling protein-2 as a regulator of mitochondrial hydrogen peroxide generation. FASEB J. 1997;11:809–815. [PubMed] [Google Scholar]
- Nicholls DG. Brown adipose tissue mitochondria. Biochim Biophys Acta. 1979;549:1–29. doi: 10.1016/0304-4173(79)90016-8. [DOI] [PubMed] [Google Scholar]
- Palmieri F, Agrimi G, Blanco E, Castegna A, Di Noia MA, Iacobazzi V, Lasorsa FM, Marobbio CM, Palmieri L, Scarcia P, et al. Identification of mitochondrial carriers in Saccharomyces cerevisiae by transport assay of reconstituted recombinant proteins. Biochimica et biophysica acta. 2006;1757:1249–1262. doi: 10.1016/j.bbabio.2006.05.023. [DOI] [PubMed] [Google Scholar]
- Pebay-Peyroula E, Dahout-Gonzalez C, Kahn R, Trezeguet V, Lauquin GJ, Brandolin G. Structure of mitochondrial ADP/ATP carrier in complex with carboxyatractyloside. Nature. 2003;426:39–44. doi: 10.1038/nature02056. [DOI] [PubMed] [Google Scholar]
- Pecqueur C, Bui T, Gelly C, Hauchard J, Barbot C, Bouillaud F, Ricquier D, Miroux B, Thompson CB. Uncoupling protein-2 controls proliferation by promoting fatty acid oxidation and limiting glycolysis-derived pyruvate utilization. FASEB J. 2008;22:9–18. doi: 10.1096/fj.07-8945com. [DOI] [PubMed] [Google Scholar]
- Rafael J, Ludolph HJ, Hohorst HJ. Mitochondria from brown adipose tissue: uncoupling of respiratory chain phosphorylation by long fatty acids and recoupling by guanosine triphosphate. Hoppe-Seyler's Zeitschrift fur physiologische Chemie. 1969;350:1121–1131. [PubMed] [Google Scholar]
- Richieri GV, Ogata RT, Kleinfeld AM. A fluorescently labeled intestinal fatty acid binding protein. Interactions with fatty acids and its use in monitoring free fatty acids. J Biol Chem. 1992;267:23495–23501. [PubMed] [Google Scholar]
- Samudio I, Fiegl M, Andreeff M. Mitochondrial uncoupling and the Warburg effect: molecular basis for the reprogramming of cancer cell metabolism. Cancer research. 2009;69:2163–2166. doi: 10.1158/0008-5472.CAN-08-3722. [DOI] [PMC free article] [PubMed] [Google Scholar]
- Schrauwen P, Hesselink MK, Vaartjes I, Kornips E, Saris WH, Giacobino JP, Russell A. Effect of acute exercise on uncoupling protein 3 is a fat metabolism-mediated effect. American journal of physiology Endocrinology and metabolism. 2002;282:E11–E17. doi: 10.1152/ajpendo.2002.282.1.E11. [DOI] [PubMed] [Google Scholar]
- Skulachev VP. Fatty acid circuit as a physiological mechanism of uncoupling of oxidative phosphorylation. FEBS Lett. 1991;294:158–162. doi: 10.1016/0014-5793(91)80658-p. [DOI] [PubMed] [Google Scholar]
- Traut TW. Physiological concentrations of purines and pyrimidines. Molecular and cellular biochemistry. 1994;140:1–22. doi: 10.1007/BF00928361. [DOI] [PubMed] [Google Scholar]
- Wang Y, Tajkhorshid E. Electrostatic funneling of substrate in mitochondrial inner membrane carriers. Proc Natl Acad Sci U S A. 2008;105:9598–9603. doi: 10.1073/pnas.0801786105. [DOI] [PMC free article] [PubMed] [Google Scholar]
- Wu J, Bostrom P, Sparks LM, Ye L, Choi JH, Giang AH, Khandekar M, Virtanen KA, Nuutila P, Schaart G, et al. Beige adipocytes are a distinct type of thermogenic fat cell in mouse and human. Cell. 2012;150:366–376. doi: 10.1016/j.cell.2012.05.016. [DOI] [PMC free article] [PubMed] [Google Scholar]
- Zhang CY, Baffy G, Perret P, Krauss S, Peroni O, Grujic D, Hagen T, Vidal-Puig AJ, Boss O, Kim YB, et al. Uncoupling protein-2 negatively regulates insulin secretion and is a major link between obesity, beta cell dysfunction, and type 2 diabetes. Cell. 2001;105:745–755. doi: 10.1016/s0092-8674(01)00378-6. [DOI] [PubMed] [Google Scholar]
- Zhang CY, Parton LE, Ye CP, Krauss S, Shen R, Lin CT, Porco JA, Jr, Lowell BB. Genipin inhibits UCP2-mediated proton leak and acutely reverses obesity- and high glucose-induced beta cell dysfunction in isolated pancreatic islets. Cell metabolism. 2006;3:417–427. doi: 10.1016/j.cmet.2006.04.010. [DOI] [PubMed] [Google Scholar]
- Zhu R, Rupprecht A, Ebner A, Haselgrubler T, Gruber HJ, Hinterdorfer P, Pohl EE. Mapping the nucleotide binding site of uncoupling protein 1 using atomic force microscopy. J Am Chem Soc. 2013;135:3640–3646. doi: 10.1021/ja312550k. [DOI] [PMC free article] [PubMed] [Google Scholar]
Associated Data
This section collects any data citations, data availability statements, or supplementary materials included in this article.