

Summary
The activity of chaperone-mediated autophagy (CMA), a catabolic pathway for selective degradation of cytosolic proteins in lysosomes, decreases with age, but the consequences of this functional decline in vivo remain unknown. In this work, we have generated a conditional knockout mouse to selectively block CMA in liver. We have found that blockage of CMA causes hepatic glycogen depletion and hepatosteatosis. The liver phenotype is accompanied by reduced peripheral adiposity, increased energy expenditure, and altered glucose homeostasis. Comparative lysosomal proteomics revealed that key enzymes in carbohydrate and lipid metabolism are normally degraded by CMA and that impairment of their regulated degradation contributes to the metabolic abnormalities observed in CMA-defective animals. These findings highlight the involvement of CMA in regulating hepatic metabolism and suggest that the age-related decline in CMA may have a negative impact on the energetic balance in old organisms.
Keywords: glucose metabolism, hepatosteatosis, lipid metabolism, liver enzymes, lysosomal membrane proteins, lysosomes, protein degradation
Introduction
Autophagy is the process by which cellular components are delivered to lysosomes for degradation (Mizushima et al., 2008). In chaperone-mediated autophagy (CMA) (Kaushik and Cuervo, 2012), a pathway present in all mammalian cells, cytosolic proteins targeted for degradation are identified by the chaperone hsc70 that recognizes a pentapeptide motif in their amino acid sequence (Chiang et al., 1989; Chiang and Dice, 1988). Once the chaperone-substrate complex reaches the lysosomal membrane, the substrate protein binds the cytosolic tail of the lysosome-associated membrane protein type 2A (LAMP-2A) (Cuervo and Dice, 1996) and drives its multimerization into a translocation complex that transports the substrate protein into the lysosomal lumen for degradation (Bandyopadhyay et al., 2008). LAMP-2A is the only one of three spliced variants of the lamp2 gene (Eskelinen et al., 2005) that participates in CMA (Cuervo and Dice, 1996, 2000b; Massey et al., 2006).
CMA has been extensively studied in liver where it is induced to mediate selective removal of proteins damaged by insults such as oxidative stress, hypoxia or proteotoxicity (Cuervo et al., 1999; Hubbi et al., 2013; Kiffin et al., 2004; Koga et al., 2011). CMA is activated by nutritional changes such as starvation (Cuervo et al., 1995) or in response to lipid overload (Rodriguez-Navarro et al., 2012). Nutritional challenges also drive other autophagic pathways, but temporal differences in the activation of each pathway and the selectivity of CMA for proteins bearing the targeting motif, make it likely that a distinct subproteome undergoes degradation by CMA. Some glycolytic enzymes such as glyceraldehyde 3-phosphate dehydrogenase (GAPDH) and pyruvate kinase have been characterized as CMA substrates in liver (Aniento et al., 1993) and cancer cells (Kon et al., 2011; Lv et al., 2011), respectively. However, the physiological relevance of their nutrition-regulated degradation by CMA and the overall impact on metabolism of the malfunction of this autophagic pathway in vivo remain unknown.
In this work, we have generated a mouse with a conditional knockout for LAMP-2A, the CMA limiting component, to study the physiological function of CMA in liver and the consequences of the failure of this pathway. We have found that loss of CMA leads to pronounced alterations in hepatic carbohydrate and lipid metabolism which have a negative impact on the overall energetic balance of the organism. Using comparative proteomics, we have demonstrated that the liver subproteome normally degraded by CMA includes key enzymes in carbohydrate and lipid metabolism. These findings unveil a previously unknown role of CMA in the control of liver metabolic homeostasis and lead us to propose that the decline of CMA with age may underlie the basis of metabolic dysregulation in old organisms.
Results
A mouse model with defective hepatic CMA
To study the consequences of defective hepatic CMA, we generated a liver-specific conditional knockout mouse for LAMP-2A, the limiting component in CMA (Cuervo and Dice, 2000a). We used the Cre-loxP system to conditionally disrupt the 508bp region in exon 8 of the lamp2 gene that encodes for the cytosolic and transmembrane domains of the LAMP-2A protein (Gough et al., 1995). Crossing mice carrying the floxed LAMP-2A allele (L2AF/F) with mice expressing Cre recombinase under control of the albumin promoter (Postic et al., 1999) allowed us to generate a liver-specific LAMP-2A knockout mouse model (Alb-Cre:L2AF/F thereafter referred to as L2AKO; Fig 1A). L2AKO mice were born at Mendelian frequency and proportional male/female ratios. Levels of LAMP-2A mRNA and protein were almost undetectable in livers of L2AKO mice when compared with L2AF/F mice (Control; Ctr) (Fig. 1B, C). Immunohistochemistry demonstrated the selectivity of LAMP-2A depletion in hepatocytes but not in endothelial cells and macrophages (Fig. 1D). Levels of LAMP-2A were unaltered in other tissues (Fig. S1A) and liver levels of other LAMPs in L2AKO mice were comparable, or in the case of LAMP-2B even slightly higher than in Ctr mice (Fig. 1E and Fig. S1B).
Figure 1. Liver-specific L2AKO mice are incompetent for CMA and display signs of liver damage and reduced liver function.
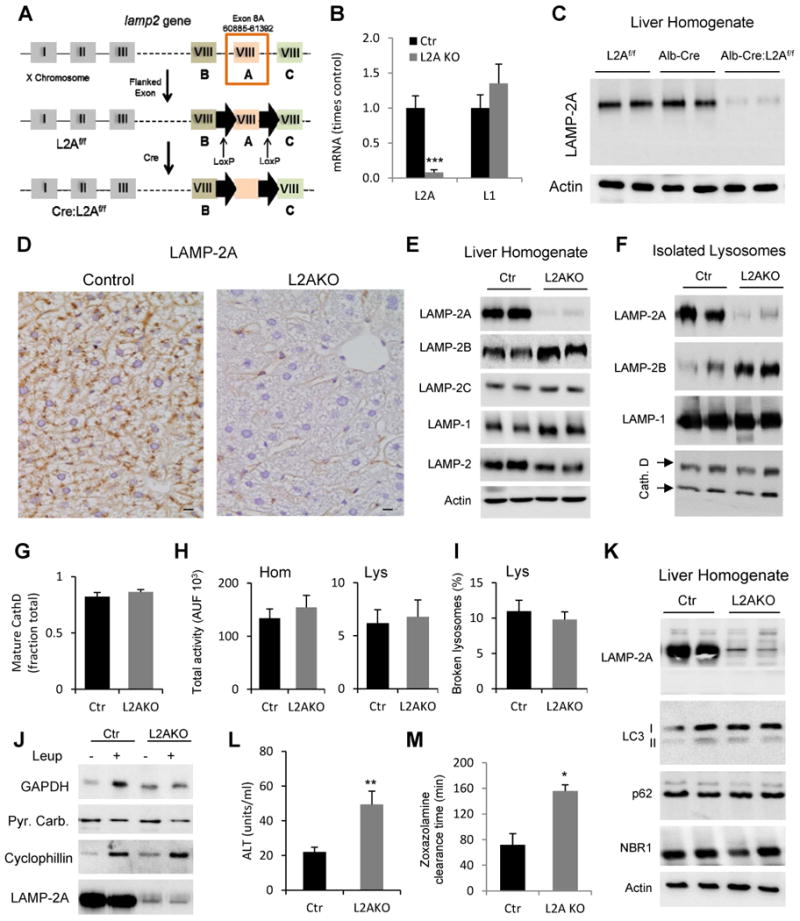
(A) Schematic of the generation of mice with liver-specific deletion of LAMP-2A. (B) RT-PCR quantification of LAMP-2A and LAMP-1 mRNA levels in livers from Albumin-Cre-L2Af/f (L2AKO) and L2Af/f (Control, Ctr) mice, n=4. (C) Immunoblot for LAMP-2A in liver homogenates from the same animal groups (Alb-Cre mice are shown as an additional control). (D) Immunohistochemistry for LAMP-2A in liver sections (scale bar, 20 μm). (E, F) Immunoblot for the indicated proteins in homogenates (E) and lysosomes (F). (G) Quantification of the fraction of mature Cathepsin D relative to total Cathepsin D detected by immunoblot in isolated liver lysosomes, n=5. (H) β-hexosaminidase activity in liver homogenates (left) and isolated lysosomes (right), n=7; AUF: arbitrary units of fluorescence. (I) Lysosomal membrane stability measured as the percentage of lysosomal β-hexosaminidase activity detectable in the media upon lysosomal incubation, n=4. (J) Immunoblot for the indicated cytosolic proteins in lysosomes isolated from livers of 24h starved mice injected or not with leupeptin (Leup); Pyruvate Carboxylase (Pyr. Carb) is shown as negative control. (K) Immunoblot for the indicated macroautophagy-related proteins in liver homogenates. (L) Serum levels of alanine aminotransferase (ALT), n=4-6. (M) Time for recovery of the righting reflex after zoxazolamine-induced paralysis, n=3. All values are mean + s.e.m. Differences with Ctr were significant for * P < 0.05, ** P < 0.01, and *** P < 0.001. See also Fig. S1.
Mice with whole lamp2 gene deletion have been previously generated (Tanaka et al., 2000), but the severe compromise of other autophagic pathways and defective lysosomal biogenesis resulting from the loss of all three LAMP-2 isoforms made this model unsuitable for studying the consequences of only CMA failure. In contrast to the total L2KO mouse model, we did not find differences between lysosomes isolated from Ctr and L2AKO mice in their content of mature hydrolases (cathepsin D shown in Fig. 1F and G), enzymatic activities (total liver and lysosomal β-hexosaminidase activities shown in Fig. 1H) or stability of their membranes (Fig. 1I). Blockage of lysosomal proteolysis in vivo by intraperitoneal injection of leupeptin confirmed that lysosomal delivery and degradation of cytosolic proteins such as cyclophillin (a protein lacking the KFERQ motif and confirmed as a non-CMA substrate (Sahu et al., 2011)) remained unaltered in L2AKO mice (Fig. 1J). However, GAPDH, a well-characterized CMA substrate (Cuervo et al., 1994), was no longer degraded in lysosomes from L2AKO mice (Fig. 1J), confirming that these animals are unable to internalize and degrade select proteins by CMA.
In contrast with the severe compromise in macroautophagy and the accumulation of immature autophagosomes described in the total lamp2 knockout mice (Tanaka et al., 2000), steady-state levels of integral autophagosome components (LC3) and autophagy receptors (p62 or NBR1) (Fig. 1K) were normal in the livers of L2AKO mice. Electron microscopy revealed that most autophagic vacuoles in these livers were autophagolysosomes (post-lysosomal fusion) (Fig. S1C) and that the ratio autophagosome/autophagolysosome was comparable in L2AKO mice and Ctr littermates (Fig. S1D). These findings confirm that LAMP-2A is not required for macroautophagy or lysosomal biogenesis and emphasize the suitability of this mouse model to study the direct consequences of compromised CMA activity in liver.
Although liver-specific L2AKO mice did not display any overt phenotypic manifestations, we found discrete but significantly elevated serum ALT, a marker of hepatocyte damage (Fig. 1L), increased liver apoptosis (Fig. S1E), and reduced liver function as early as 4 months of age (Fig. 1M shows reduction in drug metabolism and clearance). Suppression of hepatic CMA in vivo therefore leads to liver damage and a decline in liver function.
Blockage of hepatic CMA leads to hepatosteatosis
L2AKO mice have enlarged and discolored livers which weigh more than those from Ctr mice (Fig. 2A, B). Hepatocytes from L2AKO mice contained round cytosolic structures (Fig. 2C) that stained positive with the neutral lipid dye Oil-Red-O (Fig. 2D) and become even more evident after starvation (Fig. 2D and Fig. S2A). Ultrastructural analysis confirmed that lipids in L2AKO livers did not accumulate inside organelles (ER or lysosomes) but were instead present as cytosolic lipid droplets (LDs) in increased number and size (Fig. S2B).
Figure 2. Altered lipid metabolism and hepatosteatosis in liver-specific L2AKO mice.
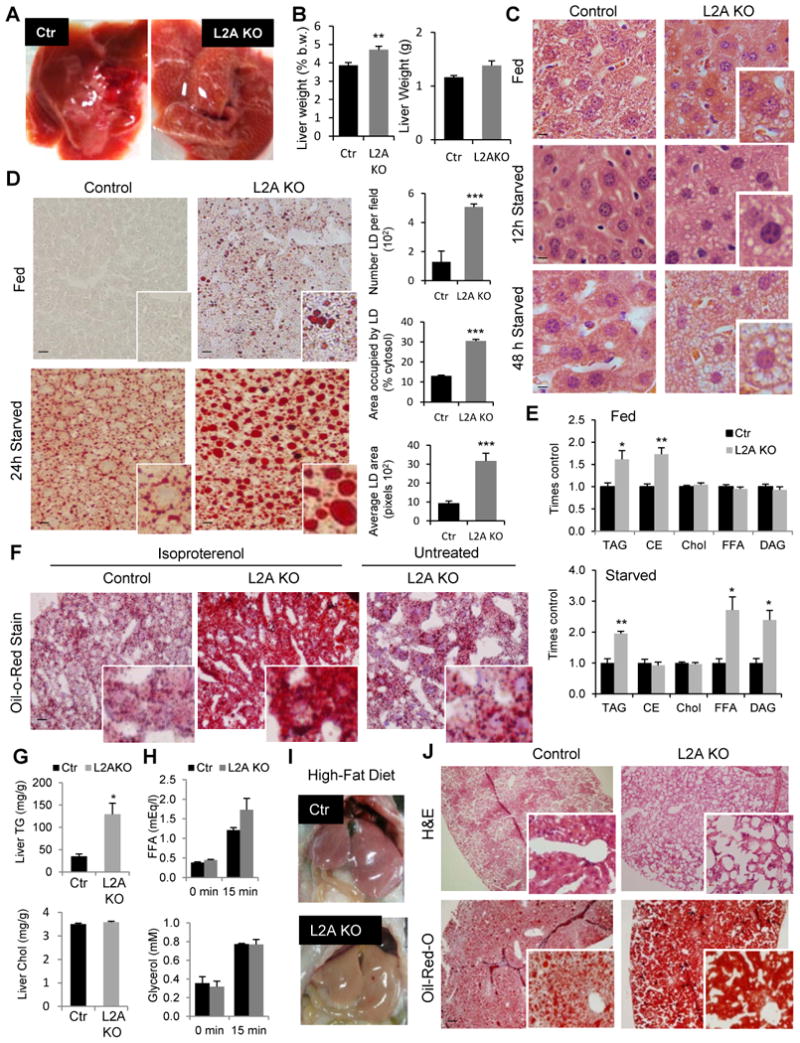
(A) Representative images of livers from 24h starved control (Ctr) and Albumin-Cre-L2Af/f (L2AKO) mice. (B) Total liver weight (right) or relative to body weight (b.w.) (left), n=7. (C) H&E staining of liver sections from fed, 12h or 48h starved mice. Insets show higher magnification images (scale bar, 10 μm). (D) Left: Oil Red O (ORO) staining of liver sections from fed and 24h starved mice. Insets show higher magnification images (scale bar, 20 μm). Right: quantification of number, area occupied and average area of lipid droplets (LD), n=4. (E) Lipid analysis by thin layer chromatography in livers from fed (top) and 24h starved (bottom) mice. Values are expressed relative to control values, n=4. (F) ORO staining of liver sections from mice after two i.p. injections of isoproterenol to induce peripheral lipolysis. Untreated L2AKO mice liver is shown as reference. Insets show higher magnification images. (G) Levels of triglyceride (TG) and cholesterol (Chol) in livers of the same animals 24h after the two-isoproterenol injections, n=3-4. (H) Serum levels of free fatty acids (FFA) and glycerol before and 15 minutes after isoproterenol injection in mice, n=3-4. (I) Representative images of livers from mice after 16 weeks on a high-fat diet (HFD). (J) H&E and ORO staining of liver sections from the same mice in i. All values are mean + s.e.m. Differences with Ctr were significant for * P < 0.05, ** P < 0.01, and *** P < 0.001. See also Fig. S2.
The major lipid species that accumulate in the livers of L2AKO mice were cholesterol esther and triacylglyceride (TG) (Fig. 2E). However, after 24h of starvation, L2AKO livers also accumulated TG precursors, such as free fatty acids (FFA) and diacylglycerol (DAG) (Fig. 2E), suggestive of inadequate adaptation to the increased lipid influx from peripheral adipose tissues. To further evaluate this possibility, we studied the response of L2AKO mice to acute and chronic lipid challenges. We treated mice with isoproterenol to acutely stimulate peripheral lipolysis at a concentration that increased serum levels of glycerol and FFA by 2 and 2.9 folds, respectively, 15 minutes after treatment and TG content in liver by 30% after two injections within 24h (Fig. S2C). LD accumulation after this treatment was markedly more pronounced in L2AKO livers (Fig. 2F) and the difference in TG content between Ctr and L2AKO livers became close to 5-fold, whereas cholesterol content remained unchanged (Fig. 2G). Analysis of changes in serum lipids 15 min after the isoproterenol injection revealed no significant differences in peripheral lipid mobilization between L2AKO and Ctr mice (Fig. 2H), supporting that the abnormal hepatic accumulation of lipids was likely due to a primary defect in the way that L2AKO livers handled the acute lipid influx.
L2AKO mice were also more sensitive to a chronic increase in dietary intake of lipids. After 16 weeks on a high-fat diet (HFD; 60% calories from fat), L2AKO mice had larger livers (Fig. 2I and Fig. S2D), more pronounced LDs accumulation (Fig. 2J) and elevated serum ALT levels (Fig. 2SE). Overall these findings support that loss of hepatic CMA leads to alterations in fat metabolism that render livers more vulnerable to lipid challenges.
Hepatic CMA loss leads to a negative energetic balance
We next analyzed the impact of hepatic CMA blockage on whole-body energy homeostasis. Liver-specific L2AKO male mice have discrete but statistically significant lower body weights than Ctr male littermates early in life (up to 3.5 months of age, Fig. 3A). These differences are no longer visible after 4 months of age (Fig. S3A), but can still be elicited by nutritional deprivation when they lose a significantly greater percentage of their body weight compared to Ctr littermates (Fig. 3B). L2AKO mice have lower total-body fat mass, further accentuated during starvation (Fig. 3C). In fact, starved L2AKO mice have reduced perigonadal white adipose tissue (WAT) weight with smaller adipocyte LDs in perigonadal WAT and interscapular brown adipose tissue (BAT) (Fig. 3D, E).
Figure 3. Increased energy expenditure and reduced peripheral adiposity in liver-specific L2AKO mice.
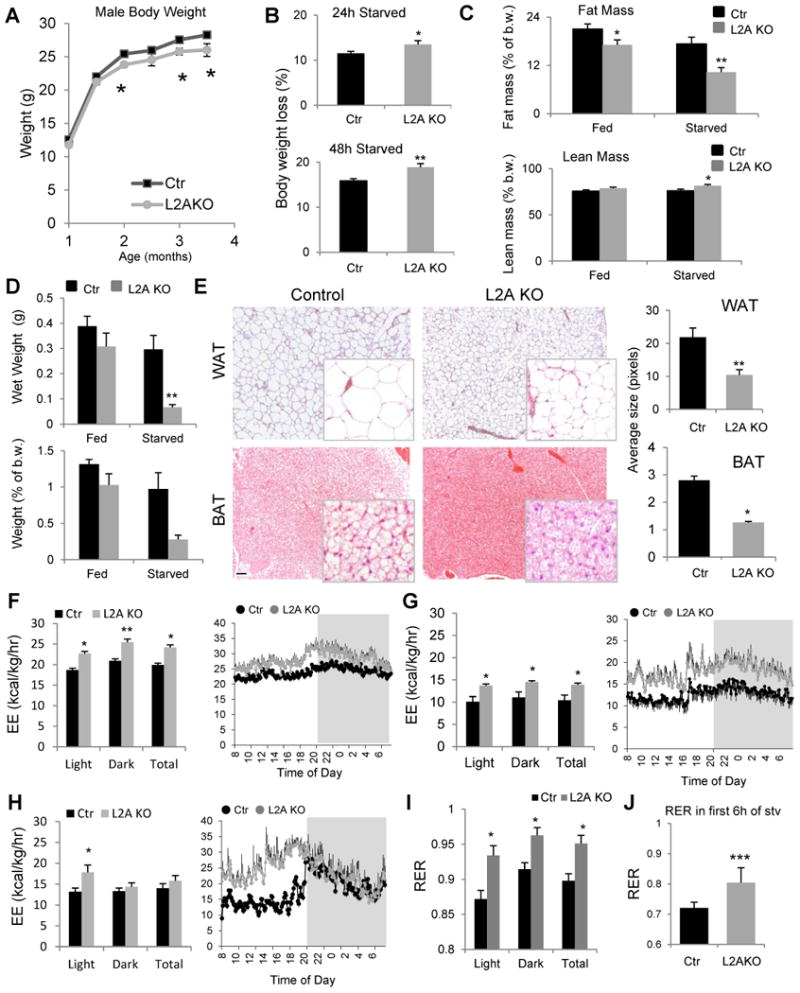
(A) Changes in body weight with age in control (Ctr) and Albumin-Cre-L2Af/f (L2AKO) male mice, n ≥11 (average group size 14.3+0.6 and 13.0+0.4 for Ctr and L2AKO, respectively). (B) Weight loss (in percentage) in the same animals at 4 months of age after 24h (top) or 48h (bottom) starvation, n=11-14. (C) Fat mass (top) and lean (mass) as a percent of body weight (b.w.) in fed or 24h starved mice, n=9-14. (D) Weight of perigonadal white adipose tissue fat in grams (top) or relative to b.w. (bottom) in the same mice as in c, n=3-4. (E) H&E staining sections of perigonadal white adipose tissue (WAT, top) and interscapular brown adipose tissue (BAT, bottom). Right: quantification of the average size of lipid droplets (LD) in the same tissues. (F-H) Average values (left) and 24h time-course (right) of the energy expenditure (EE) during the light and dark cycles or through a 24h cycle (Total) in mice fed a regular chow diet (F; n=8), fed a HFD for 16 weeks (G; n=4), or starved for 24h (H; n=8). (I, J) Average values of the respiratory exchange ratio (RER) during the light and dark cycles and Total in mice fed a regular chow diet (I) or during the first 6h of a 24h starvation period (J), n=8. All values are mean + s.e.m. Differences with Ctr were significant for * P < 0.05, ** P < 0.01, and *** P < 0.001. See also Fig. S3.
To determine the mechanism(s) behind the hepatic accumulation of lipids and the reduced fat mass of L2AKO mice, we used indirect calorimetry. L2AKO mice on a regular chow diet exhibited significantly higher energy expenditure (EE) than Ctr mice throughout a 24 hour cycle (Fig. 3F), which could not be attributed to differences in food intake, as meal number and size were comparable in both groups of animals (Fig. S3B-D), or to changes in physical activity, that was surprisingly reduced in the L2AKO mice (Fig. S3E,F). The metabolic differences between Ctr and L2AKO mice were exacerbated by feeding these mice a HFD which reduced EE in Ctr mice, but had a significantly smaller impact on lowering the EE of L2AKO mice (Fig. 3G). Despite their higher EE, L2AKO mice gained more weight on a HFD and displayed increased fat mass and liver and perigonadal WAT weight gains, further highlighting their inability to accommodate to this nutritional stress (Fig. S3G-I). Using starvation as an opposite nutritional challenge, we found that EE remained significantly higher in L2AKO mice during the day cycle (Fig. 3H). Differences in energy expenditure in both HFD and starvation could not be explained by changes in physical activity (Fig. S3F,J), pointing to an intrinsic metabolic defect.
Next, we analyzed the respiratory exchange ratio (RER) and found that L2AKO mice consistently have higher RER values than Ctr mice during the 24h cycle, suggestive of enhanced reliance on the breakdown and oxidation of carbohydrates for ATP generation (Fig. 3I). In fact, even when forcing lipid consumption through starvation, RER values in L2AKO mice remained higher than in Ctr (Fig. 3J). Although the increase in RER in the L2AKO could contribute to the observed higher EE, the fact that not only CO2 production (VCO2) (Fig. S3K) but also oxygen consumption (VO2) (Fig. S3L) was higher in these animals suggests that the elevated EE is due to an additional increase in oxygen demand. Collectively, these findings support that failure of hepatic CMA activity leads to changes in metabolism that compromise the ability to adapt to the energetic requirements in response to different nutritional challenges.
CMA-deficient livers exhibit a switch toward carbohydrate metabolism
The observed higher reliance on carbohydrate catabolism of L2AKO mice (Fig. 3I,J) prompted us to further characterize glucose metabolism. We found similar blood glucose levels in L2AKO and Ctr mice during fed conditions, but overnight fasting induced a significant drop in blood glucose levels in the L2AKO mice (Fig. 4A). Lower levels of blood glucose in L2AKO mice in response to short- and long-term fasting were noticeable even when subjected to a HFD (Fig. S4A). In agreement with their higher RER (Fig. 3I,J), L2AKO mice displayed improved glucose tolerance (Fig. 4B) even when placed on a HFD (Fig. S4B). The lower blood glucose levels in L2AKO mice during starvation (Fig. 4A) or during the glucose tolerance test (Fig. 4B) were not due to higher circulating levels of insulin in these mice (Fig. S4C, D). Ctr and L2AKO mice exhibited a comparable initial drop of blood glucose after an insulin challenge (Fig. 4C). However, L2AKO mice displayed a delay in the normalization of blood glucose levels compared with Ctr littermates, which likely indicates a defect in the counter regulatory response in hepatic glucose production normally activated to prevent hypoglycemia (Fig. 4C). As an indirect assessment of hepatic gluconeogenesis, we measured blood glucose levels following injection of a pyruvate bolus (converted into glucose in liver) and found a significantly smaller increase in blood glucose in response to pyruvate in L2AKO mice (Fig. 4D). Lower glucose levels during the pyruvate tolerance test are suggestive of reduced hepatic gluconeogenesis in the L2AKO, but could also be a result of increased utilization of the injected pyruvate for glucose oxidative metabolism.
Figure 4. Enhanced glucose tolerance and reduced hepatic glycogen storage in liver-specific L2AKO mice.
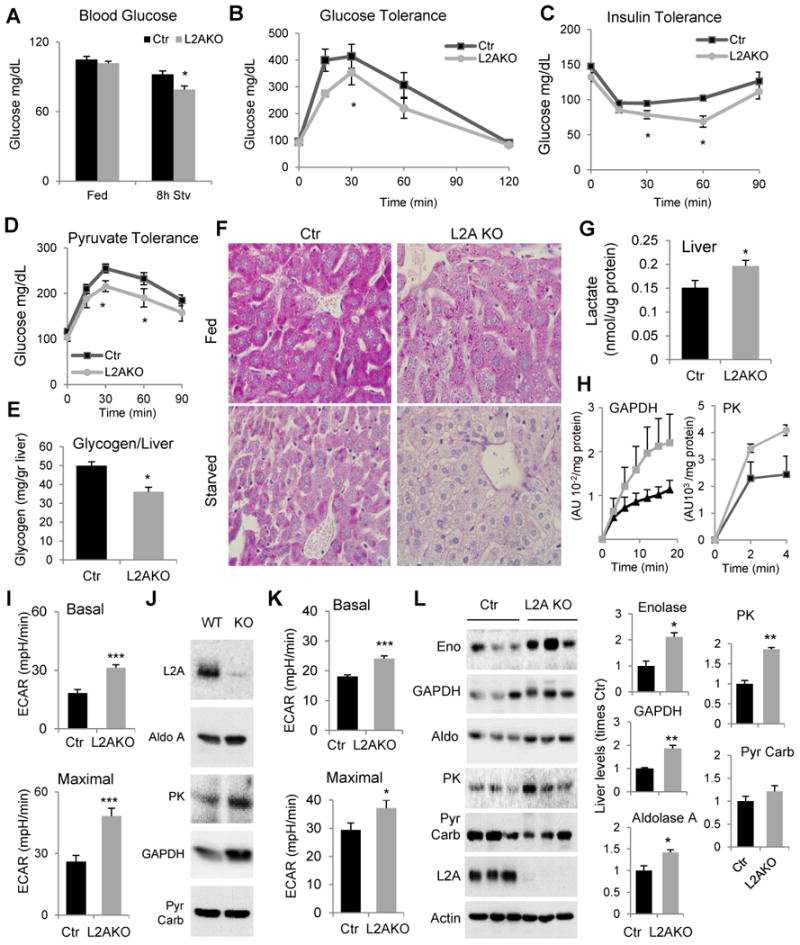
(A) Blood glucose levels in fed and 8h starved control (Ctr) and Albumin-Cre-L2Af/f (L2AKO) mice, n=6-10. (B-C) Glucose (B), insulin (C) and pyruvate tolerance (D) tests after overnight fasting, n=4-8. (E) Glycogen content in livers from normally fed mice, n=4. (F) Periodic acid-Schiff (PAS) staining of liver sections from fed and 24h starved mice (scale bar, 20 μm). (G) Liver lactate content, n=6. (H) Activity of glyceraldehyde-3-phosphate dehydrogenase and pyruvate kinase in fed mice livers (n=4). (I, K) Average extracellular acidification rates (ECAR) in primary hepatocytes from mice maintained in serum-supplemented (I) or -deprived (K) media without addition (Basal, top) or after adding 2,4 dinitrophenol (2,4 DNP) to asses inducible ECAR (Maximal, bottom). (n=6). (J) Immunoblot for the indicated enzymes in the same hepatocytes maintained in serum supplemented media. (L) Immunoblot for the indicated glycolytic enzymes in liver homogenates from 24h starved mice. Three individual mice are shown. Right: Densitometric quantification, values are expressed relative to values in Ctr mice, n=3-4. GAPDH, glyceraldehyde 3-phosphate dehydrogenase, Aldo, aldolase A; PK, pyruvate kinase; Pyr Carb., pyruvate carboxylase. All values are mean + s.e.m. Differences with Ctr were significant for * P < 0.05, ** P < 0.01, and *** P < 0.001. See also Fig. S4.
Analysis of hepatic carbohydrate stores confirmed a switch in L2AKO livers from carbohydrate synthesis and storage to carbohydrate hydrolysis and utilization. Biochemical analysis (Fig. 4E) and PAS staining (Fig. 4F) revealed a marked reduction of glycogen content in livers from L2AKO mice. Low glycogen storage did not seem to result from accelerated glycogenolysis because the fractional decrease in glycogen levels induced by 24h starvation was comparable in both groups of animals (Fig. S4E). Instead, we found that L2AKO mice have lower basal levels of glycogen synthetase (GS) and that a higher percentage of this enzyme is in an inactive phosphorylated state (pGS) (Fig. S4F). Reduced basal GS activity may be reactive to other metabolic changes in the L2AKO mice rather than a primary defect because GS is still efficiently activated, and in fact at higher levels than in Ctr mice, when we stimulate hepatic glycogenesis by insulin injection in starved mice (Fig. S4G). Lower glycogen content in the L2AKO mice cannot be explained either by reduced glycogen synthesis due to decreased sensitivity to insulin signaling. On the contrary, levels of the downstream effector pATK were higher in L2AKO mice than in Ctr in fed conditions (Fig. S4H), and after insulin injection of starved mice (Fig. S4I). Interestingly, despite increased GS activation and insulin signaling in L2AKO mice under these conditions, liver PAS staining at different times after the insulin injection still revealed a lower relative increase in glycogen content in L2AKO mice (9.23±1.67 and 14.73±1.38 folds lower increase than Ctr mice at 20 and 40 min, respectively, when compared to the glycogen content before injection) (Fig. S4J). Overall these findings support that livers of L2AKO mice have enhanced glucose uptake but reduced usage of glucose for glycogen synthesis.
The lower serum glucose levels, reduced glycogen storage capacity, and higher overall reliance on carbohydrate oxidation for energy production in L2AKO mice lead us to hypothesize that most glucose taken up by the liver may be directly consumed in this organ through abnormally enhanced glycolysis. The higher lactate content (Fig. 4G) and specific activity of glycolytic enzymes (GAPDH and PK shown in Fig. 4H) in L2AKO mice livers indirectly supported enhanced glycolysis. To perform a more direct metabolic analysis, we measured the extracellular acidification rate (ECAR) of isolated primary hepatocytes before and after adding the mitochondria uncoupler 2,4 dinitrophenol (2,4 DNP) to maximally activate glycolysis. Hepatocytes isolated from L2AKO mice displayed significantly higher basal glycolytic rates and maximal glycolytic capacity (Fig. 4I) and higher levels of glycolytic enzymes (Fig. 4J) compared to Ctr hepatocytes. The basal and maximal glycolytic capacity of the L2AKO hepatocytes remained significantly higher than in Ctr even 24h after removal of serum from the culture media, a condition in which glycolysis is normally suppressed and CMA is maximally upregulated (Fig. 4K). Immunoblot analysis confirmed that upon starvation, levels of different glycolytic enzymes in L2AKO livers remained higher than in Ctr (Fig. 4L). In fact, even in ad libitum fed animals, the decrease in the levels of some of these glycolytic enzymes observed in Ctr mice during the period of low food consumption, was no longer noticeable in the livers from L2AKO mice (Fig. S4K), further supporting their inability to modify enzyme levels to accommodate to changing nutrient availability.
CMA modulates liver carbohydrate metabolism through regulated enzyme degradation
To unveil how hepatic CMA deficiency leads to metabolic changes, we first investigated the basis for the observed increase in glycolytic enzymes. Transcriptome analysis showed that mRNA expression levels of glycolytic enzymes in livers from Ctr and L2AKO mice did not differ significantly (Fig. 5A and deposited data). To determine if the observed increase in glycolytic enzymes in L2AKO mouse livers was instead a consequence of their impaired degradation by CMA, as 8 out of 10 glycolytic enzymes contain CMA-targeting motifs in their sequence and three of them had been previously reported as bona fide CMA substrates (Aniento et al., 1993 ; Lv et al., 2011), we analyzed the lysosomal content and degradation of these enzymes in vivo. Comparative analysis of the protein content in the pool of CMA-active lysosomes (those containing hsc70 in their lumen) isolated from starved Ctr and L2AKO mice untreated or injected with leupeptin (to block lysosomal proteolysis) allowed us to distinguish among (1) lysosomal constituent proteins and possible cytosolic contaminants (if their lysosomal levels were unaffected by proteolysis inhibition), (2) proteins degraded in lysosomes independently of LAMP-2A (if their lysosomal levels increased upon proteolysis inhibition in both Ctr and L2AKO mice; which likely reach this subpopulation of lysosomes via macroautophagy or endocytosis), and (3) proteins degraded in lysosomes in a LAMP-2A-dependent manner (if their lysosomal levels increased upon proteolysis inhibition only in Ctr mice) (Fig. 5B). Immunoblot from these lysosomal fractions for the glycolytic enzymes that we found increased in L2AKO livers revealed that they all fit in this third group (Fig. 5C and D; pyruvate carboxylase is shown as negative control).
Figure 5. CMA regulates hepatic levels of carbohydrate metabolism enzymes in response to starvation.
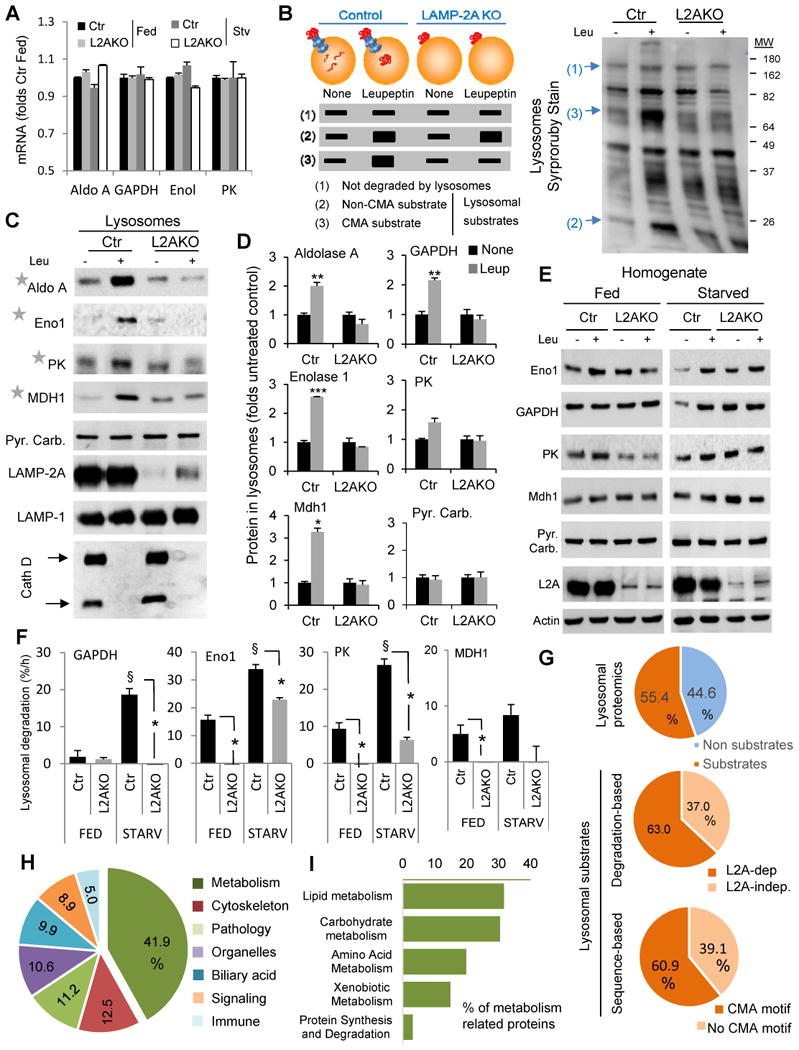
(A) mRNA levels of the indicated glycolytic enzyme genes in livers from fed or 48h starved control (Ctr) and Albumin-Cre-L2Af/f (L2AKO) mice. Values are expressed relative to Ctr fed mice, n=3. (B) Schematic of the hypothetical changes in levels of proteins in lysosomes isolated from 24h starved Ctr and L2AKO mice injected or not with leupeptin 2h before isolation. Proteins are classified depending on these changes as non-substrates (1), substrates for lysosomal degradation (2) and CMA substrates (3). Right: representative electrophoretic pattern of lysosomes isolated from animals in the indicated conditions and subjected to SDS-PAGE and SyproRuby staining. Arrows indicate examples of proteins in each of the categories indicated in the scheme. (C) Immunoblot for the indicated glycolytic enzymes in the same lysosomal samples as in B. PK, pyruvate kinase; Mdh1, malate dehydrogenase 1, cytoplasmic; Pyr. Carb., pyruvate carboxylase; Eno1, enolase 1; Cath D, cathepsin D. (D) Densitometric quantification of immunoblots as the ones shown in C and in Fig. 1J (for GAPDH). Values are expressed relative to values in untreated Ctr mice (none), n=2-5. (E) Immunoblot for the indicated enzymes of liver homogenates from fed or 24h starved mice injected or not with leupeptin. (F) Rates of lysosomal degradation of the indicated enzymes calculated by densitometric quantification of immunoblots as the ones showin in E, n=2-5. (G) Comparative proteomics of the lysosomes from the four experimental groups described in B. Percentage of proteins classified as lysosomal substrates based on their sensitivity to leupeptin (top) and percentage of CMA substrates based on: their loss of sensitivity to leupeptin in L2AKO lysosomes (middle panel) or the presence of a CMA-targeting motif in their sequence in the group of leupeptin-sensitive proteins (bottom panel), n=3. (H,I) Distribution among cellular biological processes (H) and metabolic processes (I) of proteins classified as CMA substrates in the proteomic analysis. Percentages in each group are shown, n=3. All values are mean+s.e.m. Differences with Ctr (*) or with fed (§) were significant for * § P < 0.05, ** P < 0.01, and *** P < 0.001. See also Fig. S5.
Comparative analysis of livers homogenates from fed and starved mice treated or not with leupeptin revealed that the marked increase in lysosomal degradation of these enzymes in Ctr mice was significantly blunted in L2AKO mice (Fig. 5E, F and S5B). Even the lysosomal degradation of some of these enzymes was reduced in normally fed L2AKO mice, suggesting that CMA also contributes to their basal degradation (Fig. 5 E, F and S5B). Increased levels of most of these enzymes in L2AKO mice were even more evident when the cytosolic fractions were compared (Fig. S5A), further supporting that the cytosolic pool of these enzymes is the one undergoing lysosomal degradation. Overall, these results support that CMA contributes to modulating intracellular levels of glycolytic enzymes under basal conditions and in response to nutritional cues such as starvation.
To identify the subproteome normally degraded by CMA, we performed a complete quantitative proteomic analysis of lysosomes isolated from the experimental groups described in Fig. 5B. We found that 55.4% of the proteins associated to CMA active lysosomes underwent degradation in this compartment and that, among those, 63% qualified as CMA substrates because of their failure to accumulate in leupeptin-treated L2AKO mice (Fig. 5G). Remarkably, analysis of CMA-targeting motifs in proteins catalogued as lysosomal substrates in Ctr mice revealed a very similar percentage (60.9%) of putative CMA substrates (Fig. 5G). Data mining using Ingenuity Pathway analysis demonstrated that almost half of the CMA substrate proteins were involved in cellular metabolism (3 folds their representation in the total liver proteome) in agreement with the overrepresentation of cytosolic enzymes in this pool and in support of their selective targeting to lysosomes (Fig. 5H and Fig. S5C, D).
Analysis of the profile of the glycolytic enzymes identified in the proteomic analysis confirmed our immunoblot data and the classification of 5 glycolytic enzymes as CMA substrates (Fig. S5E). We also found an overrepresentation of TCA cycle-related enzymes among the CMA substrates (Fig. S5E,F), suggesting that later steps in the catabolism of glucose may also be modulated by CMA. For example, the cytosolic form of malate dehydrogenase (Mdh1) undergoes lysosomal degradation in Ctr mice both in fed and starved conditions but not in L2AKO livers (Fig. 5C-F). Even some of the mitochondria-resident TCA enzymes, such as citrate synthetase (CS) also showed a profile characteristic of a CMA substrate (Fig. S5E). The higher content of CS observed in the cytosol of L2AKO mice (Fig. S5A) suggests that CMA degradation of this nuclear-encoded enzyme in Ctr mice occurs in the cytosol, presumably before its translocation into mitochondria. Transcriptome analysis indicated that overall, genes involved in other carbohydrate metabolism-related pathways showed minimal changes in transcript levels except for a significant reduction of some genes involved in glucose transport, a potential compensatory response to the abnormally enhanced glycolysis (see deposited data).
Next, we overexpressed glycolytic enzymes alone or in combination in Ctr cells to confirm that the higher levels of glycolytic enzymes in the L2AKO mice were sufficient to drive the higher glycolytic rates observed in these cells. We found that enhanced glycolysis upon CMA blockage was not restricted to liver but also occurs in other cell types. For example, mouse embryonic fibroblasts from constitutive L2AKO mice showed higher basal levels of lactate production (Fig. 6A) and maintained higher basal and maximal glycolytic capability than Ctr fibroblasts upon serum removal (Fig. 6B,C), allowing us to perform over expression experiments in control fibroblasts. Overexpression of GAPDH or PK was sufficient to increase basal and inducible glycolysis in Ctr fibroblasts, whereas overexpression of aldolase only had a discrete effect (Fig. 6D). Combined overexpression of GAPDH and PK had an additive effect on glycolytic rates, supporting that enhanced glycolysis in L2AKO livers was likely a result of the cumulative effect of the higher levels of multiple glycolytic enzymes in these mice. Conversely, we found that partial knock-down of GAPDH and PK alone or in combination in L2AKO MEFs (to bring their levels closer to those in Ctr cells), reduced their elevated glycolysis (Fig. 6E,F).
Figure 6. Reduced degradation of glycolytic enzymes leads to enhanced glycolysis in CMA-defective cells.
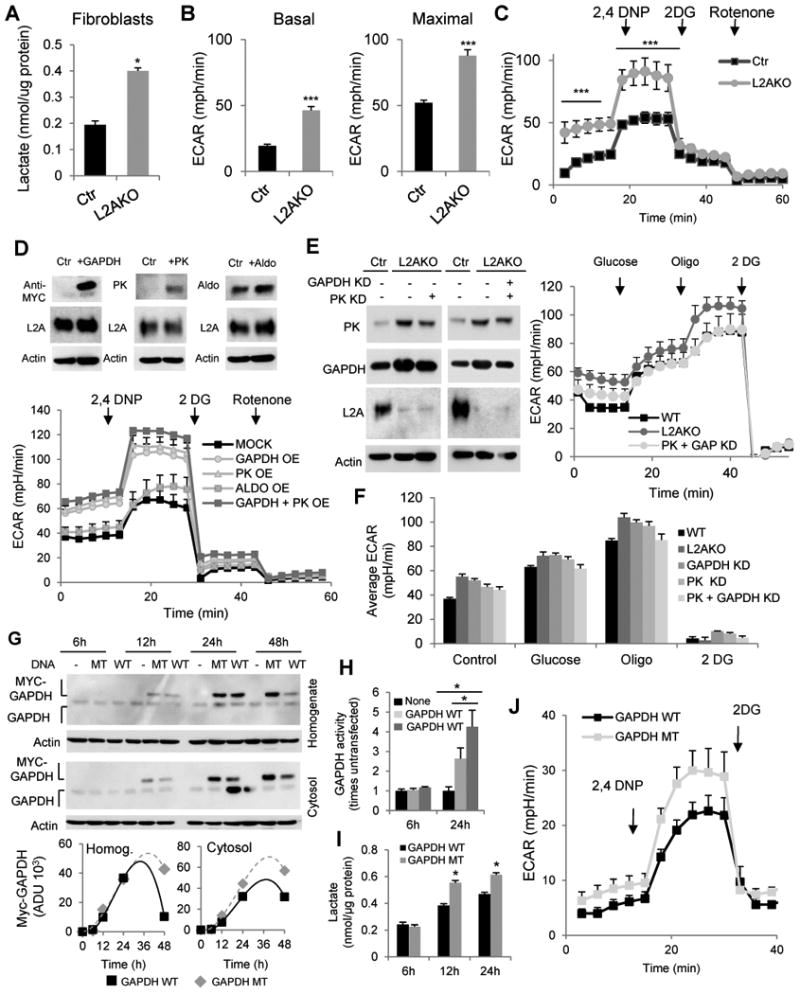
(A) Lactate content in mouse embryonic fibroblasts (right, n=3) from control (Ctr) and L2A-/- (KO) mice. (B) Average extracellular acidification rates (ECAR) in fibroblasts maintained in serum-deprived media without addition (Basal, left) or after adding 2,4 dinitrophenol (2,4 DNP) to asses inducible ECAR. (C) Timecourse of ECAR changes in same cells as in (B) (n=8). (D) Top: Immunoblot for indicated proteins from Ctr fibroblasts transfected with plasmids coding for MYC-tagged GAPDH, Pyruvate Kinase (PK), or Aldolase. Bottom: ECAR values for Ctr fibroblasts overexpressing the indicated glycolytic enzymes individually or in combination, n=4. OE: overexpression. (E,F) Left: Immunoblot for indicated enzymes from fibroblasts transduced with a lentivirus carrying shRNA against GAPDH or PK to knockdown (KD) glycolytic enzymes individually or together (PK+GAP). Right: ECAR values over time and (F) average ECAR values in the transduced cells (n=4). (G) Top: Immunoblot for Myc and GAPDH from total cellular lysates (homogenate) and cytosolic fractions from Ctr fibroblasts transfected with plasmids coding for MYC-tagged wild-type (WT) GAPDH or GAPDH bearing a mutated CMA targeting motif (MT). Bottom: Timecourse of changes of WT and MT GAPDH protein in total and cytosolic cellular fractions. (H) Activity of GAPDH and (I) lactate levels in the same cells at indicated times post-tranfection (n=3). (J) Average ECAR values in the same cells 24h post-transfection (n=4). All values are mean+s.e.m. Differences with Ctr (*) were significant for * P < 0.05 and *** P < 0.001.
Lastly, to confirm that blockage of degradation of glycolytic enzymes by CMA was sufficient to increase cellular glycolysis, we transfected fibroblasts with plasmids coding for wild-type GAPDH or a mutant GAPDH resistant to CMA degradation, generated by disruption of the CMA-targeting motif by targeted mutagenesis (Salvador et al., 2000). Time-course analysis after transfection revealed that although both forms of GAPDH were expressed at similar levels, the overall content of mutant GAPDH remained higher over time due to its inability to undergo degradation (Fig. 6G). These differences were even more noticeable when comparing cytosolic fractions where the GAPDH amenable to CMA degradation resides. We confirmed that the increase in GAPDH activity in transfected cells was significantly higher in those expressing the CMA-resistant mutant GAPDH (Fig. 6H), which also displayed higher lactate levels (Fig. 6I) and increased basal and inducible ECAR (Fig. 6J). Overall, these findings support that compromised degradation of glycolytic enzymes and their subsequent increase in intracellular levels are responsible for the alterations in carbohydrate metabolism observed in L2AKO mice.
Hepatocyte CMA blockage alters liver lipid metabolism
The pronunced accumulation of lipids observed in livers of L2AKO mice (Fig. 2) prompted us to study possible alterations in lipid metabolism in these animals and whether they could be due to changes at the enzymatic level. The comparative proteomic analysis in lysosomes from Ctr and L2AKO livers revealed that almost 30% of the proteins identified as CMA substrates participate in lipid metabolism, predominantly in triglyceride synthesis, steroid metabolism and lipid binding and transport (Fig. 5I, 7A,B and S6A). We validated the presence of this subset of lipid regulatory enzymes in the pool of lysosomes active for CMA (Fig. 7C) and also confirmed that the starvation-induced increase in lysosomal degradation of these lipid metabolism enzymes was significantly reduced in L2AKO mice (Fig. 7D and S5B). For some enzymes, their lysosomal degradation was also reduced in L2AKO mice even under fed conditions (Fig. 7D and S5B). Accordingly, levels of many lipid metabolic enzymes were increased in liver cytosolic fractions from these animals (Fig. S5A). Since we did not find significant changes in the transcript levels for these enzymes between Ctr and L2AKO mice (deposited data), we conclude that the higher content of enzymes involved in lipid metabolism in the livers of L2AKO mice was a consequence of their reduced degradation via CMA.
Figure 7. Liver enzymes related to lipid metabolism undergo regulated degradation by CMA.
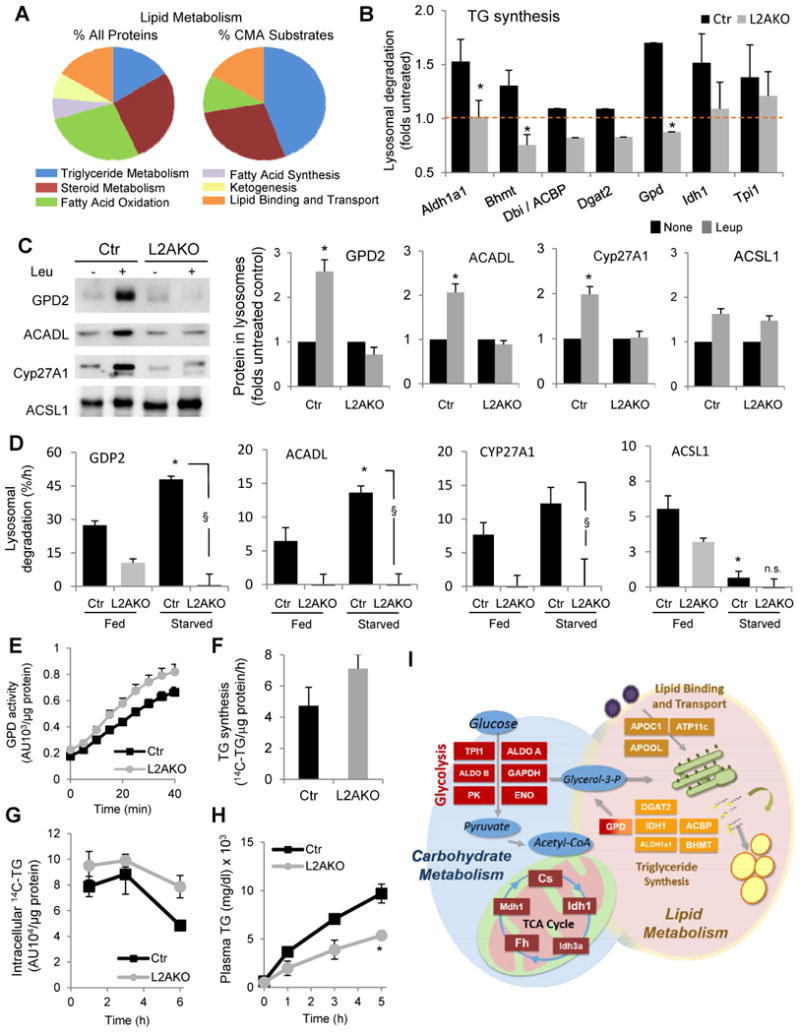
(A) Distribution among pathways related to lipid metabolism of all proteins or proteins classified as CMA substrates through the comparative proteomic analysis of lysosomes isolated from 24h starved control (Ctr) and Albumin-Cre-L2Af/f (L2AKO) mice injected or not with leupeptin 2h before isolation, n=3 (B) Folds increase in levels of the indicated proteins related to lipid metabolism in the same lysosomes after leupeptin treatment as determined in the comparative proteomic analysis, n=3. (C) Immunoblot for the indicated enzymes related to lipid metabolism in the same lysosomal samples as in Fig. 5B. GPD, glycerol-3-phosphate dehydrogenase; ACADL, acyl-coenzyme A dehydrogenase long chain; Cyp27A1, cytochrome P450 cholesterol 27 hydroxylase; ACSL1, long chain acetyl-coenzyme A synthetase. Right: quantification of immunoblots shown on left. Values are presented relative to values in untreated groups, n=3-6. (D) Rates of basal and starvation-induced lysosomal degradation in percentage of protein delivered to lysosomes per hour calculated from the differences in the levels of the indicated proteins in lysosomes from animals treated or not with leupeptin 2h before isolation, n=4-6. Representative immunoblots shown in Fig. S5B. (E) Enzymatic activity of GPD in liver homogenates, n=7 (F) Average rates of newly synthesized radiolabeled TG in cells pulsed with 14C-Glycerol. n=3. (G) Rates of TG hydrolysis in cells incubated overnight with 14C-Oleate and chased in serum free media, n=3. (H) Serum triglyceride (TG) measured at the indicated times before and after treatment with lipoprotein lipase inhibitor, Poloxamer 407, in mice starved overnight, n=3-4. (I) Schematic of the enzymes in the indicated carbohydrate and lipid metabolic pathways validated to undergo regulated degradation by CMA in this study and whose levels increase when CMA is compromised in liver. All values are mean+s.e.m. Differences with Ctr (*) or with fed (§) were significant for * § P < 0.05, ** P < 0.01, and *** P < 0.001. See also Fig. S6 and S7.
The increase in L2AKO mice of levels of lipogenic enzymes, such as glycerol-3-phosphate dehydrogenase (GPD), correlated with higher enzymatic activity (Fig. 7E), but to assess the overall impact of these enzymatic changes in lipid metabolism we used isolated hepatocytes. We confirmed that L2AKO mice hepatocytes had marked accumulation of lipids (Fig. S6B), increased content of enzymes involved in lipid metabolism (Fig. S6C) and reduced lysosomal degradation for these enzymes (Fig. S6D). Consistent with the increase in lipogenic enzymes, direct metabolic measurements revealed higher rates of TG synthesis in cells with abrogated CMA activity (Fig. 7F).
To further elucidate other factors that could contribute to the hepatosteatosis observed in L2AKO mice, we analyzed possible changes in mitochondrial lipid catabolism. Basal oxygen consumption rates were comparable between Ctr and L2AKO hepatocytes, but the maximal respiratory capacity of L2AKO cells was significantly reduced (Fig. S7A). Furthermore, L2AKO cells failed to increase mitochondrial respiration in response to a lipogenic challenge (Fig. S7B,C) and displayed lower rates of β-oxidation in these conditions (Fig. S7D). We did not find apparent changes in mitochondrial morphology by morphometric analysis of liver electron micrographs (Fig. S7E) or any signs of higher mitochondrial depolarization after co-staining hepatoctyes with MitoTracker (mitochondria mass) and MitoCMXRos (polarized mitochondria) (Fig. S7F). Mitochondrial flux through macroautophagy (mitophagy), analyzed by changes in colocalization between MitoTracker-labeled mitochondria and the autophagosomal marker LC3 upon blockage or not of autophagosome/lysosome fusion with vinblastine, revealed that mitophagy was comparable in Ctr and L2AKO cells (Fig. S7G). Reduced maximal mitochondrial respiratory capacity and β-oxidation in L2AKO hepatocytes did not seem to be a primary defect in mitochondrial function, as the respiratory states of mitochondria isolated from Ctr and L2AKO mice were equivalent (Fig. S7H,I). Instead, we propose that reduced lipid oxidation in L2AKO hepatocytes could be secondary to a combination of higher routing of free fatty acids toward lipogenesis and the observed decrease in intracellular TG breakdown (Fig. 7G). Lastly, we also found a significant reduction in the VLDL secretion rate in L2AKO livers (Fig. 7H), which along with enhanced lipogenesis and reduced lipid breakdown could further contribute to the hepatosteatotic phenotype of L2AKO mice.
Discussion
Activation of hepatic CMA in response to prolonged starvation has been known since the initial description of this form of selective autophagy (Cuervo et al., 1995; Wing et al., 1991), but the role of CMA upregulation in liver physiology has remained uncharacterized due to the lack of experimental models for the study of CMA blockage in vivo. In this work, through the generation of a mouse model with ablated CMA activity in the liver, we have identified CMA as a regulator of hepatic metabolism and of the adaptation of this organ to nutritional deprivation and excessive dietary lipids by degrading enzymes involved in distinct metabolic pathways.
The metabolic dysfunction observed upon blockage of hepatic CMA in vivo suggests that the age-dependent decline in the activity of this autophagic pathway may contribute to the energetic deficiencies and reduced ability to adapt to changes in nutrient intake of elders. The previously reported decrease in gluconeogenic capacity and increase in the glycolytic activity (Cao et al., 2001; Dhahbi et al., 1999) of the liver with age coincide with our findings in the livers of L2AKO mice. The fact that these mice did not present with insulin resistance typically detected in old organisms is in agreement with the recently proposed concept that insulin resistance is not causal in aging but it rather constitutes a reactive protective mechanism to prevent peripheral tissues from glucose overload (Barzilai and Ferrucci, 2012). It is plausible that other age-related changes, still not present in our group of young adult mice, are needed to trigger this reactive response. Alternatively, the full extent of the metabolic syndrome observed in old organism may be dependent on changes with age in CMA activity in peripheral tissues. Interetingly, we found that even when blockage of CMA is restricted to liver, peripheral tissues such as WAT and BAT were also affected. Although future studies are required to elucidate the molecular basis of this intercommunication, we found that circulating levels of ketone bodies (previously shown to activate CMA (Finn and Dice, 2005)) were higher in L2AKO mice upon prolonged starvation (Fig. S7J), making possible that some of the observed peripheral changes could be consequence of ketone body-mediated upregulation of CMA in these tissues. This augmented ketogenesis, despite reduced beta-oxidation in L2AKO mice, could originate from excessive acetyl-CoA generated from enhanced glycolysis or changes in amino acid metabolism that lead to higher levels of ketogenic substrates.
Multiple mechanisms contribute to the regulation of enzymatic activity but rapid cessation of an enzymatic process requires inactivation (by post-translational modification or thorugh endogenous inhibitors (Kim and Kyung Lee, 2012; Xiong and Guan, 2012)) or elimination of the active enzyme already present in the cell. Elimination of enzymes by proteolysis, as described in this work by CMA, allows for a more global effect on the composition of the subproteome directly involved in several metabolic pathways. According to our proteomic analysis, starvation-induced activation of CMA in the liver lowers the levels of at least 30 different enzymes. The overall outcome of these enzymatic changes is a reduction in the use and storage of energy resources by the liver (by reducing glycolysis, triglyceride and steroid synthesis) and an increase of their export and use by peripheral tissues. In this work, we have focused on glucose and lipid metabolism guided by the major phenotypic changes observed in the liver of L2AKO mice. Some of the enzymes identified in this study as CMA substrates can also undergo degradation by the proteasome. Depending on the cellular conditions and extracellular signals, degradation by one pathway may be favored over another. Although some of the enzymes identified as CMA substrates in this work reside in mitochondria, the fact that they accumulate in cytosolic fractions upon CMA blockage, and that we did not observe differences in rates of mitochondria degradation, supports that their degradation occurs during their targeting to mitochondria. In fact, only nuclear encoded TCA enzymes were detected as CMA substrates in the proteomic analysis.
The pronounced metabolic changes in L2AKO mice could be in part explained by the mutual influence and tight interconnection between carbohydrate and lipid metabolism pathways. Thus, changes in one pathway may force re-routing of metabolites to a different pathway. For example, early glycolytic intermediates, when elevated, could be shunted toward TG synthesis via the glycerol-3-phosphate pathway. Similarly, an increase in acetyl-CoA production resulting from enhanced glucose oxidation can in part be utilized for fatty acid biosynthesis, further contributing to steatosis.
In this work, we have identified that the consequences of defective hepatic CMA activity go beyond the mere disruption of protein quality control to include a compromised ability to maintain metabolic homeostasis and to adapt to changing energetic demands. This role in the regulation of liver metabolism makes CMA a putative therapeutic target in common metabolic disorders.
Experimental Procedures
Animals
Four- to six-month old male C57BL/6 mice, wild-type or transgenic for Albumin-Cre (Jackson Laboratory), were used. L2AKO mice were generated as detailed in Supplementary Information (SI) using loxP insertion to delete the exon region in the lamp2 gene that encodes for the LAMP-2A variant and crossing this mice with Albumin-Cre mice (Jackson Laboratory) (Fig. 1). Conditions of diets and treatments are described in SI.
Chemicals
Sources of chemicals and antibodies were used as described before (Kaushik et al., 2006; Kiffin et al., 2004; Zhang and Cuervo, 2008). The source of the antibodies used in this study and dilutions used for immnoblot and immunofluorescence are detailed in SI.
Subcellular fractionation and isolation of lysosomes
Mouse liver lysosomes were isolated from a light mitochondrial–lysosomal fraction in a discontinuous metrizamide density gradient, and a fraction enriched in the subpopulation of lysosomes active for CMA was further separated by differential centrifugation as previously described (Cuervo et al., 1997). Lysosomal integrity was verified after isolation by measuring β-hexosaminidase activity latency and only preparations with less than 10% broken lysosomes were used (Storrie and Madden, 1990).
Histological procedures and electron microscopy
Livers were fixed in 10% neutral buffered formalin and stained with H&E and periodic acid-Schiff stain (PAS). For oil-red-O staining, liver tissue was frozen in OCT, sectioned and stained. For electron microscopy, livers were fixed with 2% paraformaldehyde and 2% gluteraldehyde in 0.1M sodium cacodylate buffer. Details of processing and quantification are in SI.
Metabolic analysis
Body composition was determined by magnetic resonance spectroscopy (MRS) using an Echo MRS instrument (Echo Medical System) and energy expenditure using metabolic chambers as described in SI. Carbohydrate metabolism was measured using glucose tolerance, insulin sensitivity and pyruvate tolerance tests and liver and serum lipids were analyzed by chromatography and enzymatic assays as described in SI.
Other methods
Liver function was assessed with the Zoxazolamine-induced paralysis test as described in SI (Zhang and Cuervo, 2008). Proteomic analysis was performed using iTRAQ multiplex (Applied Biomics) and microarray analysis using Affymetrix technology and validated by real-time PCR (see SI for details). The ALT levels were measured in serum samples collected by retro-orbital bleed using a commercial colorimetric assay (TECTO Diagnostics). For immunoblotting, protein concentration was determined by the Lowry method (Lowry et al., 1951) using bovine serum albumin as a standard. After SDS-PAGE, gels were transferred to nitrocellulose membranes using a Mini-TransBlot SD wet transfer cell (Bio-Rad, Richmond, VA) and immunoblotting was performed following standard procedures (Towbin et al., 1979). Proteins recognized by the specific antibodies were visualized by chemiluminescence (RenaissanceR; PerkinElmer Life and Analytical Sciences) using peroxidase conjugated secondary antibodies in a LAS-3000 Imaging System (Fujifilm). Densitometric quantification of the immunoblotted membranes was performed with ImageJ software.
Statistical analysis
All values are reported as mean+s.e.m. and the statistical significance of the difference between experimental groups was determined in instances of single comparisons by the two-tailed unpaired Student's t-test with the Sigma Plot software (Jandel Scientific). In instances of multiple means comparisons, we used one-way analysis of variance (ANOVA) followed by the Bonferroni post-hoc test to determine statistical significance. Microarray data has been deposited in the GEO repository with accession number GSE49553.
Supplementary Material
Highlights.
Blockage of liver CMA leads to hepatosteatosis and altered glucose metabolism
Hepatic CMA failure has a negative impact on the whole-body energetic balance
Metabolic enzymes are a major component of the subproteome degraded by CMA
CMA degradation of metabolic enzymes contributes to regulation of metabolism
Acknowledgments
We thank A. Diaz for his assistance with animal maintenance collection of mice weight data, B. Patel for assistance with the electron microscopy, and JY Park with the microarray analysis. We are also in debt to Drs. R. deCabo, G. Schwartz and N. Barzilai for their advice on experimental design and interpretation of the calorimetric studies, Dr. D. Gross for help with the analytical lipid protocols, Dr. D. Miranda for experimental advice, Dr. X-L Du for hep with the Seahorse readings and Dr. Rani Sellers for help with the histopathology. This work was supported by grants from the National Institutes of Health AG21904, AG031782, AG038072 and DK098408 (to AMC), AG024391 and GM104459 (to YS) andDK20541 (metabolic core). JLS was supported by NIH/NIA T32-GM007288 and F30AG046109.
Abbreviations
- Alb
albumin
- CMA
chaperone-mediated autophagy
- EE
energy expenditure
- FFA
free fatty acids
- GS
glycogen synthetase
- GAPDH
glyceraldehyde 3-phosphate dehydrogenase
- HFD
high-fat diet
- L2AKO
albumin-Cre:LAMP-2Af/f
- LAMP
lysosome-associated membrane protein
- LD
lipid droplet
- RER
respiratory exchange ratio
- TG
triacylglycerol
Footnotes
Publisher's Disclaimer: This is a PDF file of an unedited manuscript that has been accepted for publication. As a service to our customers we are providing this early version of the manuscript. The manuscript will undergo copyediting, typesetting, and review of the resulting proof before it is published in its final citable form. Please note that during the production process errors may be discovered which could affect the content, and all legal disclaimers that apply to the journal pertain.
References
- Aniento F, Roche E, Cuervo AM, Knecht E. Uptake and degradation of glyceraldehyde-3- phosphate dehydrogenase by rat liver lysosomes. J Biol Chem. 1993;268:10463–10470. [PubMed] [Google Scholar]
- Bandyopadhyay U, Kaushik S, Varticovski L, Cuervo AM. The chaperone-mediated autophagy receptor organizes in dynamic protein complexes at the lysosomal membrane. Mol Cell Biol. 2008;28:5747–5763. doi: 10.1128/MCB.02070-07. [DOI] [PMC free article] [PubMed] [Google Scholar]
- Barzilai N, Ferrucci L. Insulin resistance and aging: a cause or a protective response? J Gerontol A Biol Sci Med Sci. 2012;67:1329–1331. doi: 10.1093/gerona/gls145. [DOI] [PubMed] [Google Scholar]
- Cao SX, Dhahbi JM, Mote PL, Spindler SR. Genomic profiling of short- and long-term caloric restriction effects in the liver of aging mice. Proc Natl Acad Sci U S A. 2001;98:10630–10635. doi: 10.1073/pnas.191313598. [DOI] [PMC free article] [PubMed] [Google Scholar]
- Chiang H, Terlecky S, Plant C, Dice JF. A role for a 70-kilodalton heat shock protein in lysosomal degradation of intracellular proteins. Science. 1989;246:382–385. doi: 10.1126/science.2799391. [DOI] [PubMed] [Google Scholar]
- Chiang HI, Dice JF. Peptide sequences that target proteins for enhanced degradation during serum withdrawal. J Biol Chem. 1988;263:6797–6803. [PubMed] [Google Scholar]
- Cuervo AM, Dice JF. A receptor for the selective uptake and degradation of proteins by lysosomes. Science. 1996;273:501–503. doi: 10.1126/science.273.5274.501. [DOI] [PubMed] [Google Scholar]
- Cuervo AM, Dice JF. Regulation of lamp2a levels in the lysosomal membrane. Traffic. 2000a;1:570–583. doi: 10.1034/j.1600-0854.2000.010707.x. [DOI] [PubMed] [Google Scholar]
- Cuervo AM, Dice JF. Unique properties of lamp2a compared to other lamp2 isoforms. J Cell Sci. 2000b;113:4441–4450. doi: 10.1242/jcs.113.24.4441. [DOI] [PubMed] [Google Scholar]
- Cuervo AM, Dice JF, Knecht E. A population of rat liver lysosomes responsible for the selective uptake and degradation of cytosolic proteins. J Biol Chem. 1997;272:5606–5615. doi: 10.1074/jbc.272.9.5606. [DOI] [PubMed] [Google Scholar]
- Cuervo AM, Hildebrand H, Bomhard EM, Dice JF. Direct lysosomal uptake of alpha2-microglobulin contributes to chemically induced nephropathy. Kidney Int. 1999;55:529–545. doi: 10.1046/j.1523-1755.1999.00268.x. [DOI] [PubMed] [Google Scholar]
- Cuervo AM, Knecht E, Terlecky SR, Dice JF. Activation of a selective pathway of lysosomal proteolysis in rat liver by prolonged starvation. Am J Physiol. 1995;269:C1200–C1208. doi: 10.1152/ajpcell.1995.269.5.C1200. [DOI] [PubMed] [Google Scholar]
- Cuervo AM, Terlecky SR, Dice JF, Knecht E. Selective binding and uptake of ribonuclease A and glyceraldehyde-3-phosphate dehydrogenase by isolated rat liver lysosomes. J Biol Chem. 1994;269:26374–26380. [PubMed] [Google Scholar]
- Dhahbi JM, Mote PL, Wingo J, Tillman JB, Walford RL, Spindler SR. Calories and aging alter gene expression for gluconeogenic, glycolytic, and nitrogen-metabolizing enzymes. Am J Physiol. 1999;277:E352–360. doi: 10.1152/ajpendo.1999.277.2.E352. [DOI] [PubMed] [Google Scholar]
- Eskelinen EL, Cuervo AM, Taylor MR, Nishino I, Blum JS, Dice JF, Sandoval IV, Lippincott-Schwartz J, August JT, Saftig P. Unifying Nomenclature for the Isoforms of the Lysosomal Membrane Protein LAMP-2. Traffic. 2005;6:1058–1061. doi: 10.1111/j.1600-0854.2005.00337.x. [DOI] [PubMed] [Google Scholar]
- Finn PF, Dice JF. Ketone bodies stimulate chaperone-mediated autophagy. J Biol Chem. 2005;280:25864–25870. doi: 10.1074/jbc.M502456200. [DOI] [PubMed] [Google Scholar]
- Gough NR, Hatem CL, Fambrough DM. The family of LAMP-2 proteins arises by alternative splicing from a single gene: characterization of the avian LAMP-2 gene and identification of mammalian homologs of LAMP-2b and LAMP-2c. DNA Cell Biol. 1995;14:863–867. doi: 10.1089/dna.1995.14.863. [DOI] [PubMed] [Google Scholar]
- Hubbi ME, Hu H, Kshitiz, Ahmed I, Levchenko A, Semenza GL. Chaperone-mediated Autophagy Targets Hypoxia-inducible Factor-1alpha (HIF-1alpha) for Lysosomal Degradation. J Biol Chem. 2013;288:10703–10714. doi: 10.1074/jbc.M112.414771. [DOI] [PMC free article] [PubMed] [Google Scholar]
- Kaushik S, Cuervo AM. Chaperone-mediated autophagy: a unique way to enter the lysosome world. Trends Cell Biol. 2012;22:407–417. doi: 10.1016/j.tcb.2012.05.006. [DOI] [PMC free article] [PubMed] [Google Scholar]
- Kaushik S, Massey AC, Cuervo AM. Lysosome membrane lipid microdomains: novel regulators of chaperone-mediated autophagy. EMBO J. 2006;25:3921–3933. doi: 10.1038/sj.emboj.7601283. [DOI] [PMC free article] [PubMed] [Google Scholar]
- Kiffin R, Christian C, Knecht E, Cuervo A. Activation of chaperone-mediated autophagy during oxidative stress. Mol Biol Cell. 2004;15:4829–4840. doi: 10.1091/mbc.E04-06-0477. [DOI] [PMC free article] [PubMed] [Google Scholar]
- Kim W, Kyung Lee E. Post-transcriptional regulation in metabolic diseases. RNA biology. 2012;9:772–780. doi: 10.4161/rna.20091. [DOI] [PMC free article] [PubMed] [Google Scholar]
- Koga H, Martinez-Vicente M, Arias E, Kaushik S, Sulzer D, Cuervo AM. Constitutive Upregulation of Chaperone-Mediated Autophagy in Huntington's Disease. J Neurosci. 2011;31:18492–18505. doi: 10.1523/JNEUROSCI.3219-11.2011. [DOI] [PMC free article] [PubMed] [Google Scholar]
- Kon M, Kiffin R, Koga H, Chapochnick J, Macian F, Varticovski L, Cuervo AM. Chaperone-mediated autophagy is required for tumor growth. Science translational medicine. 2011;3:109–117. doi: 10.1126/scitranslmed.3003182. [DOI] [PMC free article] [PubMed] [Google Scholar]
- Lowry OH, Rosebrough NJ, Farr AL, Randall RJ. Protein measurement with the Folin phenol reagent. J Biol Chem. 1951;193:265–275. [PubMed] [Google Scholar]
- Lv L, Li D, Zhao D, Lin R, Chu Y, Zhang H, Zha Z, Liu Y, Li Z, Xu Y, et al. Acetylation targets the M2 isoform of pyruvate kinase for degradation through chaperone-mediated autophagy and promotes tumor growth. Mol Cell. 2011;42:719–730. doi: 10.1016/j.molcel.2011.04.025. [DOI] [PMC free article] [PubMed] [Google Scholar]
- Massey AC, Kaushik S, Sovak G, Kiffin R, Cuervo AM. Consequences of the selective blockage of chaperone-mediated autophagy. Proc Nat Acad Sci USA. 2006;103:5905–5910. doi: 10.1073/pnas.0507436103. [DOI] [PMC free article] [PubMed] [Google Scholar]
- Mizushima N, Levine B, Cuervo AM, Klionsky DJ. Autophagy fights disease through cellular self-digestion. Nature. 2008;451:1069–1075. doi: 10.1038/nature06639. [DOI] [PMC free article] [PubMed] [Google Scholar]
- Postic C, Shiota M, Niswender KD, Jetton TL, Chen Y, Moates JM, Shelton KD, Lindner J, Cherrington AD, Magnuson MA. Dual roles for glucokinase in glucose homeostasis as determined by liver and pancreatic beta cell-specific gene knockouts using Cre recombinase. J Biol Chem. 1999;274:305–315. doi: 10.1074/jbc.274.1.305. [DOI] [PubMed] [Google Scholar]
- Rodriguez-Navarro JA, Kaushik S, Koga H, Dall'armi C, Shui G, Wenk MR, Di Paolo G, Cuervo AM. Inhibitory effect of dietary lipids on chaperone-mediated autophagy. Proc Natl Acad Sci U S A. 2012 doi: 10.1073/pnas.1113036109. [DOI] [PMC free article] [PubMed] [Google Scholar]
- Sahu R, Kaushik S, Cannizzo E, Scharf B, Follenzi A, Clement C, Potolicchio I, Nieves E, Cuervo A, Santambrogio L. Microautophagy of cytosolic proteins by late endosomes. Develop Cell. 2011;20:131–139. doi: 10.1016/j.devcel.2010.12.003. [DOI] [PMC free article] [PubMed] [Google Scholar]
- Salvador N, Aguado C, Horst M, Knecht E. Import of a cytosolic protein into lysosomes by chaperone-mediated autophagy depends on its folding state. Journal of Biological Chemistry. 2000;275:27447–27456. doi: 10.1074/jbc.M001394200. [DOI] [PubMed] [Google Scholar]
- Storrie B, Madden EA. Isolation of subcellular organelles. Meth Enzymol. 1990;182:203–225. doi: 10.1016/0076-6879(90)82018-w. [DOI] [PubMed] [Google Scholar]
- Tanaka Y, Guhde G, Suter A, Eskelinen EL, Hartmann D, Lullmann-Rauch R, Janssen P, Blanz J, von Figura K, Saftig P. Accumulation of autophagic vacuoles and cardiomyopathy in Lamp-2-deficient mice. Nature. 2000;406:902–906. doi: 10.1038/35022595. [DOI] [PubMed] [Google Scholar]
- Towbin H, Staehelin T, Gordon J. Electrophoretic transfer of proteins from polyacrylamide to nitrocellulose sheets: procedure and some applications. Proc Natl Acad Sci. 1979;76:4350–4354. doi: 10.1073/pnas.76.9.4350. [DOI] [PMC free article] [PubMed] [Google Scholar]
- Wing SS, Chiang HL, Goldberg AL, Dice JF. Proteins containing peptide sequences related to KFERQ are selectively depleted in liver and heart, but not skeletal muscle, of fasted rats. Biochem J. 1991;275:165–169. doi: 10.1042/bj2750165. [DOI] [PMC free article] [PubMed] [Google Scholar]
- Xiong Y, Guan KL. Mechanistic insights into the regulation of metabolic enzymes by acetylation. J Cell Biol. 2012;198:155–164. doi: 10.1083/jcb.201202056. [DOI] [PMC free article] [PubMed] [Google Scholar]
- Zhang C, Cuervo AM. Restoration of chaperone-mediated autophagy in aging liver improves cellular maintenance and hepatic function. Nat Med. 2008;14:959–965. doi: 10.1038/nm.1851. [DOI] [PMC free article] [PubMed] [Google Scholar]
Associated Data
This section collects any data citations, data availability statements, or supplementary materials included in this article.