

Significance
The Immunological Genome Project Consortium has recently identified a gene-expression program that links invariant natural killer T (iNKT) cells to NK cells. While this is true, our study provides molecular and functional evidence demonstrating that CD1d-independent NKT cells are uniquely programmed with a hybrid function far superior to that of iNKT cells. Such a unique feature enables this subset of NKT cells to contribute to adaptive immunity (like T cells) and at the same time act as a prominent player in innate defense (like NK cells).
Keywords: granzyme B, CD1d, MHC, NK receptors
Abstract
Invariant natural killer T (iNKT) cells to date represent the best example of cells known to have a hybrid function, representing both innate and adaptive immunity. Shared phenotypic similarities with NK cells together with a rapid response to a cytokine stimulus and a productive TCR engagement are the features that underline the hybrid nature of iNKT cells. Using these criteria, we provide molecular and functional evidence demonstrating that CD1d-independent (CD1dind) NKT cells, a population of CD1d-unrestricted NKT cells, are endowed with a hybrid function far superior to that of iNKT cells: (i) an extensive shared program with NK cells, (ii) a closer Euclidian distance with NK cells, and (iii) the ability to respond to innate stimuli (Poly:IC) with cytotoxic potential in the same manner as NK cells identify a hybrid feature in CD1dindNKT cells that truly fulfills the dual function of an NK and a T cell. Our finding that CD1dindNKT cells are programmed to act like NK cells in response to innate signals while being capable of adaptive responses is unprecedented, and thus might reemphasize CD1d-unrestricted NKT cells as a subset of lymphocytes that could affect biological processes of antimicrobial and tumor immunity in a unique way.
Natural killer T (NKT) cells are increasingly regarded as cells endowed with a hybrid function between an NK cell and a T cell (1, 2). The current classification of NKT cells places them into three categories: type I, type II, and NKT-like cells (1). Type I comprises invariant NKT (iNKT) cells that recognize the glycolipid α-galactosylceramide (α-GalCer) loaded into the MHC class I molecule, CD1d, and contain an invariant TCR repertoire of Vα14-Jα18 (3–5). Type II NKT cells are also CD1d dependent but do not respond to α-GalCer in the same way as iNKT cells do (6, 7). NKT-like cells encompass all other NKT cells and are CD1d independent (CD1dind) (8); they are by far the most heterogeneous and the least characterized.
Recent studies have increasingly shown a shared expression of NK cell-related receptors on other effector cells. CD8+ T cells are known to up-regulate NK markers, such as NK1.1, and can even respond quickly like NK cells (9). Other work has described NKT cells that express NKp46 (10), a marker selectively associated with conventional NK cells and NK22 cells in the gut (11). Moreover, γδ T cells have been shown to express NK markers and display an innate-like response (12). Collectively, these reports converge to raise the following key questions. What qualifies as an NKT cell? Do the cells need to express only NK1.1 and CD3 to be eligible for NKT nomenclature? With the continuous development of both NK and T-cell fields, the simplistic definition that NKT cells are subsets of T cells that express the NK1.1 marker is becoming increasingly misleading and even inaccurate. For instance, NK1.1 complex is expressed in the BALB/c strain but there are allelic divergences with the polymorphism leading to the PK136 antibody not reacting to the BALB/c NK.1.1 (NKrp1) complex (13). This definition is also limited in the C57BL/6 strain because of the discovery of NK1.1−CD1d+ NKT cells (14). Although phenotypic similarities can be misleading, the criteria that best describes an NKT cell is the ability to perform with a hybrid function between an NK cell and a T cell (2).
Nonetheless, the concept of hybrid function is also an elusive notion allowing for a gradient of functions. A number of works refer to an NKT hybrid function as the ability of a T cell with phenotypic similarities to NK cells to perform with innate-like response. The best example of cells endowed with a hybrid NKT cell function are thought to be iNKT cells (2). In this study, we provide molecular and functional evidence demonstrating that CD1dindNKT cells—a population of MHC-unrestricted T cells—are endowed with a hybrid function that associates them to the NK cell lineage in a manner far superior to the known link between NK and iNKT cells. An extensive shared program with NK cells, a similarity in the gene expression profile with NK cells, and their ability to respond (like NK cells) not only to cytokine signals (IL-12 plus IL-18) but also to innate stimuli [in vivo treatment with Poly:IC (Fisher)] with massive production of key effector players of the cytotoxic pathway collectively identify a hybrid feature in CD1dindNKT cells that uniquely fulfills the function of an NK cell and a T cell.
Results
Extensive Phenotypic Similarities Place CD1dindNKT Cells Closer to the NK Cell Lineage.
Based on the differential expression of CD3 and of CD1d tetramer, NK1.1-expressing cells can be divided into three known cell types: NK cells that are among the CD3− gate, iNKT cells that are typically identified by positive staining with CD1d tetramer, and CD1dindNKTcells that are among those cells that express NK1.1 similar to NK cells and CD3 similar to conventional T cells but negative for CD1d tetramer (Fig. 1A). To confirm that these cells are distinct from the iNKT cell type, we examined this phenotype in CD1d-deficient mice and conclusively demonstrated that these cells are bona fide CD1dindNKT cells (Fig. 1B).
Fig. 1.
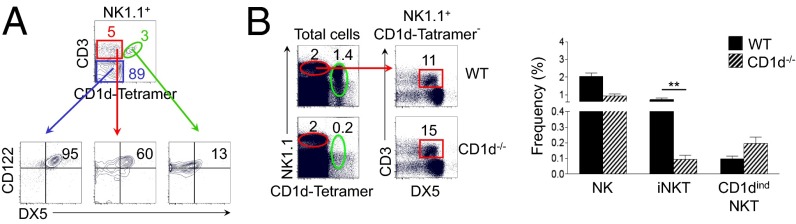
CD1dindNKT cells resemble NK cells more than iNKT cells resemble NK cells. (A) Distribution of CD3 versus CD1d tetramer among NK1.1+ cells in the spleen. Distribution of CD122 versus DX5 is shown among gated NK1.1+CD3+CD1d tetramer+ (green), NK1.1+CD3+CD1d tetramer− (red), and NK1.1+CD3−CD1d tetramer− (blue) cells. Numbers indicate the percentage of cells expressing DX5 and high levels of CD122 among each gate. (B) Distribution of NK1.1 versus CD1d tetramer in the spleen of WT and CD1d−/− mice. (B, Left) Distribution of CD3 versus CD1d tetramer is from gated NK1.1+CD1d tetramer− cells (red). (B, Right) The graph summarizes the frequency of NK (CD3−CD1d tetramer−NK1.1+DX5+), iNKT (CD3+CD1d tetramer+), and CD1dindNKT cells (CD3+CD1d tetramer−NK1.1+DX5+) in WT and CD1d−/− mice. Mean ± SEM; **P < 0.001. Data are representative of three independent experiments with n = 5 mice per experiment in A and n = 3 mice per experiment in B.
To better characterize their phenotype, we used a panel of T- and NK cell markers and directly compared their profile with that of NK and iNKT cells. Our data show that CD1dindNKT cells more closely resemble NK cells than iNKT cells to NK cells (Figs. S1 and S2). Indeed, unlike iNKT cells, CD1dindNKT cells were found to be positive for the NK cell marker DX5 (Fig. 1A and Fig. S1A). Moreover, analysis of IL-2/IL-15 receptor β (CD122) revealed high levels of this cytokine receptor on CD1dindNKT cells similar to that of NK cells, whereas most iNKT cells expressed only intermediate levels (Fig. 1A and Fig. S1B). Furthermore, expression of Ly49A, Ly49C/I, NKG2D, NKG2A, and CD94 were higher in frequency among CD1dindNKT cells compared with the iNKT cell profile (Figs. S1B and S2). However, unlike NK cells, CD1dindNKT cells lacked Ly49H and Ly49D, and a similar profile was observed in iNKT cells (Figs. S1B and S2). To identify the maturation status of CD1dindNKT cells, we next examined markers commonly associated with the development of NK (CD43 and CD11b) and T cells (CD62L and CD44) (Fig. S1C). Interestingly, results showed that CD1dindNKT cells resembled NK cells for markers of T-cell activation (CD62L+CD44+) but resembled iNKT cells for markers of NK cell maturation (CD11b−CD43+) (Fig. S1C). Finally, we compared the expression of CD4 and CD8 in both NKT cell subsets. Whereas iNKT cells had a majority of CD4+ T cells and a minor subset of CD4−CD8− T cells, CD1dindNKT cells had a majority of CD4−CD8− T cells and a minor subset of CD8+ T cells (Fig. S1B).
Despite an NK cell-like phenotype, most CD1dindNKT cells lacked the expression of the NK-specific marker, NKp46 (15) (Figs. S1B and S2). We first considered that NKp46 might be sequestered in the intracellular compartment of CD1dindNKT cells similar to CD3ε in human NK cells (16). However, results from the intracellular staining of NKp46 showed no expression in CD1dindNKT cells (Fig. S3A). We next explored the possibility that expression of NKp46 in CD1dindNKT cells is regulated in an age-dependent manner (Fig. S3B). Surprisingly, results from mice at different ages revealed positive expression of NKp46 in CD1dindNKT cells from neonate (10 d) and infant (20 d) mice, but this marker was down-regulated at adult age (>60 d). In sharp contrast, iNKT cells remained negative for NKp46 at all ages, a result that places CD1dindNKT cells closer to the NK cell lineage.
In line with previous reports (17), we found CD1dindNKT cells in multiple organs with segregation in the spleen and bone marrow (Fig. S4A). These cells were detected as early as 10 d of age with a kinetic of development reaching optimum at adult age (Fig. S4B). Finally, results from CD1dindNKT cell culture in the presence of γc cytokines suggested that their survival could fit both NK and T-cell lineages (Fig. S5). Taken together, these results show that CD1dindNKT cells, as identified in our study by CD3+CD1d tetramer−NK1.1+DX5+ phenotype, exhibit a unique profile at the intersection between NK and T cells.
Global Genome Expression Reveals Higher Similarity Between NK and CD1dindNKT Cells than Between NK and iNKT Cells.
The Immunological Genome Project Consortium has recently identified a gene-expression program that links iNKT cells to NK cells (2). Although it is clear that iNKT cells share patterns with NK cells, our data placed CD1dindNKT cells closer to the NK cell lineage than iNKT cells (Fig. 1 and Figs. S1–S4). To ascertain this finding, we used a global genome expression analysis and directly compared the genetic basis for similarities between NK and CD1dindNKT cells versus NK and iNKT cells (Fig. 2 and Fig. S6).
Fig. 2.

Global genome expression reveals extensive similarities between CD1dindNKT and NK cells that surpass similarities between iNKT and NK cells. (A) Splenic NK (NK1.1+DX5+CD3−CD1d tetramer−), CD1dindNKT (NK1.1+DX5+CD3+CD1d tetramer−), iNKT (NK1.1+DX5−CD3+CD1d tetramer+), and conventional T (NK1.1−DX5−CD3+CD1d tetramer−) cells were sorted, and RNA was extracted and hybridized to the mouse 1.0 ST array. Ratios were generated using normalized raw expression values and then log2 transformed. Total genes were first filtered based on an expression value of at least 16 in one of the four cell populations. Ratios of NK relative to T cells (NK/T), CD1dindNKT relative to T cells (CD1dindNKT/T), and iNKT relative to T cells (iNKT/T) were compared, and the genes that did not have a larger than twofold change in at least one of the three ratios were filtered out. The remaining genes were ranked by the SD of the three values, and k-means (k = 15) clustering was performed in the top 20%. The blowout shows two clusters of genes with higher differential expression in NK/T and CD1dindNKT/T but not in iNKT/T cells. (B) Heat map of hierarchical clustering of the killer cell lectin-like (Ly49) family of receptors. (C) Heat map of hierarchical clustering of various selected genes commonly found in T cells. (D) Heat map showing genes that are selectively up-regulated or down-regulated (more than twofold) in CD1dindNKT but not in NK or iNKT cells (less than twofold) relative to T cells. We subtracted the absolute expression change values in NK and iNKT from the values in CD1dindNKT, sorted the selected genes by this value from high to low, and displayed the top 16 genes as a heat map. A more complete set of genes is shown in Fig. S7. Colors indicate up-regulation (green) and down-regulation (red) relative to T cells. (E–G) Pair-wise Euclidean distance of expression levels between NK, CD1dindNKT, iNKT, and T-cell subsets. E shows the same selected set of genes shown in A, F shows genes with at least twofold differential expression in at least one of these cell subsets, and G shows all expressed genes (with expression levels higher than 16). Colors indicate long (yellow) and short (dark red) distance. Gene chip data are from cell subsets sorted from n = 7 mice.
Although iNKT cells confirmed shared patterns with NK cells, our results revealed extensive similarities between CD1dindNKT and NK cells (Fig. 2A). Strikingly, most of these similarities were related to the NK cell program, including the killer cell lectin-like receptors (Klr), the NK cell receptors 2B4 (cd244) and NKp46 (Ncr1), and the cytotoxic pathway including granzymes (Gzma and Gzmb). Given the large number of Klr genes shared between NK and CD1dindNKT, we next examined the entire Klr gene family (Fig. 2B). Although only a few Klr genes were shared between NK and iNKT cells, most Klr genes expressed in NK cells were also found to be expressed in the CD1dindNKT cell subset (Fig. 2B and Fig. S6A). Beside NK cell markers, CD1dindNKT and iNK cells expressed many T-cell markers (Fig. 2C). This is demonstrated by the expression patterns of the TCR complex Cd3ε, Cd3γ, and Cd3δ. Analyses of other T-cell markers such as Cd4, Cd5, and Cd6 showed similar expression in CD1dindNKT cells compared with T cells. Moreover, like T cells, CD1dindNKT cells expressed the inhibitory T-cell receptor Ctla4 (18) and the costimulatory T-cell molecule Cd40l (19), two key receptors that critically regulate T-cell functions. As expected, the aforementioned genes were not expressed in NK cells (Fig. 2C).
The finding that CD1dindNKT cells share extensive similarities with both NK and T cells raises the question of a distinct molecular signature. To address this question, we first examined the transcription factor program known to govern T-cell lineage commitment, including PLZF/Zbtb16 (20) (iNKT cells), Tbet/Tbx21 (21) (Th1 cells), Gata3 (22) (Th2 cells), Rorc (23) (Th17 cells), and Foxp3 (24) (Treg cells). Results confirmed that CD1dindNKT cells are distinct from iNKT cells because CD1dindNKT cells did not express PLZF/Zbtb16 (Fig. 2C and Fig. S6C). Notably, CD1dindNKT cells showed up-regulation of Tbet/Tbx21 and Eomes, but these transcription factors are commonly expressed by IFNγ-expressing cell types, including NK cells (25) (Fig. 2C and Fig. S6C). Next, we searched for genes specific to CD1dindNKT cells that can distinguish them from NK, iNKT, and T cells (Fig. 2D and Fig. S7). In this family, the genes that emerged with the highest fold of expression or repression were microRNA miR505 and miR194-1 (highly expressed), and small nuclear RNA Snora33 (highly repressed) (Fig. 2D and Fig. S6B). With the emerging interest in the role of miRNAs in the development and function of the immune system, these data identify miR505 and miR194-1 as putative gene candidates for CD1dindNKT cell determination.
To summarize the shared and distinct features between NK, CD1dindNKT, iNKT, and T cells, we calculated the Euclidean distances between these cell populations using the selected set of genes shown in Fig. 2A (Fig. 2E), genes with differential expression in at least one of these cell subsets (Fig. 2F), and all expressed genes (Fig. 2G). Results from all three types of analyses confirmed a much higher similarity between CD1dindNKT and NK cells than iNKT and NK cells (Fig. 2 E–G). Collectively, these data identify a previously undescribed feature of CD1dindNKT cells as a distinct T-cell population with an extensive shared program with NK cells.
Hybrid Nature of CD1dindNKT Cells Uniquely Fulfills the Function of NK and T Cells.
To determine the functional basis for the extensive similarity between CD1dindNKT and NK cells, we examined both IFNγ and granzyme B responses (Fig. 3).
Fig. 3.

CD1dindNKT cells are endowed with a unique hybrid function. (A) Splenocytes from WT mice were stimulated with IL-12 (5 ng/mL) and IL-18 (25 ng/mL) for 4–12 h. Graph shows the intracellular expression of IFNγ among non-T/NK cell gate (CD3−CD1d tetramer−NK1.1−DX5−), NK cells (CD3−CD1d tetramer−NK1.1+DX5+), T cells (CD3+CD1d tetramer−NK1.1−DX5−), CD1dindNKT cells (CD3+CD1d tetramer−NK1.1+DX5+), and iNKT cells (CD3+CD1d tetramer+) as a function of time. Data are representative of three independent experiments with n = 3–5 mice per experiment. Graph shows individual mice. (B) Heat map shows the defined Gene Ontology (GO) pathway of cytolysis (GO 0019835) in NK, CD1dindNKT, and iNKT cells. Colors indicate up-regulation (green) and down-regulation (red) relative to T cells. Results are from cell subsets sorted from n = 7 mice. (C–E) Intracellular expression of granzyme B (GzmB) from Poly:IC-treated WT (C and D) or β2m−/− (E) mice. (C) Plots show the distribution of GzmB versus NK1.1, CD122 and CD8 among non-T/NK, NK, T, CD1dindNKT, and iNKT cells. (D) Graph summarizes the frequency of GzmB-expressing cells among splenic NK, CD1dindNKT, iNKT, and T-cell subsets 16 h after in vivo Poly:IC treatment. Mean ± SEM; **P < 0.001, ***P < 0.0001, ****P < 0.00001. (E) Plots show the distribution of GzmB versus CD8 among splenic NK and CD1dindNKT cells from Poly:IC-treated β2m−/− mice. Data are representative of three (C and D) and two (E) independent experiments with n = 4 Poly:IC-treated mice per experiment.
First, we determined whether CD1dindNKT cells can efficiently respond to IL-12/IL-18 stimulation, a cytokine combination known to rapidly trigger an IFNγ response in NK cells (26). To this aim, splenocytes were stimulated with IL-12/IL-18, and outcomes of IFNγ production were determined after 4, 6, 8, and 12 h. Although iNKT cells responded efficiently after 12 h of stimulation, production of IFNγ from CD1dindNKT cells occurred at an earlier time point, indicating that CD1dindNKT and NK cells have similar sensitivities to IL-12/IL-18 stimulation (Fig. 3A and Fig. S8A). This finding is consistent with the gene expression profile that demonstrated an up-regulation of both Tbet/Tbx21 and Eomes on both NK and CD1dindNKT cell populations (Figs. 2C and 4D). To ensure that the IFNγ response in CD1dindNKT cells was not due to contaminating iNKT or memory CD8+ T cells, this result was further confirmed in β2m−/− mice (Fig. S8B).
Fig. 4.

CD1dindNKT cells develop in the thymus like T cells but unlike T cells do not undergo MHC restriction. (A) Flow cytometry of splenocytes isolated from WT B6, Rag2−/−, Rag2−/−γc−/−, and athymic nude mice. Distribution of CD3 versus CD1d tetramer is from total splenocytes, and distribution of NK1.1 versus DX5 is shown among gated CD3−CD1d tetramer− and CD3+CD1d tetramer− cells. Asterisk indicates frequency below 0.1%. (B) Flow cytometry of splenocytes isolated from WT B6, class II−/−, β2m−/−, and class II−/−β2m−/− mice. Distribution of NK1.1 versus CD1d tetramer is from total splenocytes (Center). Distribution of CD3 versus DX5 is shown among gated NK1.1+CD1d tetramer− cells as indicated by red arrows (Right). Distribution of CD3 versus CD4 is shown from gated NK1.1−CD1d tetramer− cells as indicated by black arrows (Left). For class II−/−β2m−/− mice, we show the distribution of NK1.1 versus DX5 among CD3−CD1d-Teramer− and CD3+CD1d-Teramer− cells. Numbers indicate percentages of cells in gates, and the asterisk indicates frequency below 0.1%. (C) Graphs summarize frequency or numbers of NK (CD3−CD1d tetramer−NK1.1+DX5+), iNKT (CD3+CD1d tetramer+), and CD1dindNKT cells (CD3+CD1d tetramer−NK1.1+DX5+) in WT B6, nude, Rag2−/−, Rag2−/−γc−/−, class II−/−, β2m−/−, and class II−/−β2m−/− mice. Data are representative of three independent experiments with n = 3–4 mice per experiment. Mean ± SEM; *P < 0.01, **P < 0.001, ***P < 0.0001, ****P < 0.00001. P values as calculated between WT and deficient mice. (D) Analysis of microarray data of NK, CD1dindNKT, and iNKT cells described in this study alongside the microarray data obtained from different thymic T-cell precursors and developing T-cell subsets (Immunological Genome Project Consortium) (2). Each cell population is compared relative to each other through a by-row hierarchical clustering using quantile-normalized expression values. Colors indicate high (green) and low (red) gene expression. (E) Hypothetical model of CD1dindNKT cell development in the thymus based on collective results obtained in A–D.
Second, to ascertain that CD1dindNKT cells have a functional TCR, we assessed their response to immobilized anti-CD3 plus anti-CD28 antibodies (Fig. S8C). To this aim, total splenocytes were stimulated with plate-bound antibodies, and the IFNγ response was assessed after 48 h with intracellular staining on the gated population. Consistent with previous reports (27), we found that CD1dindNKT cells were capable of rapid IFNγ production in response to TCR engagement (Fig. S8C). Such a response (48 h) was similar to the iNKT cell response, whereas conventional T cells required a comparatively longer period (4–5 d) to reach optimal response. To ensure that CD1dindNKT cell response to TCR engagement was not the result of contamination from other cell types, this result was further confirmed using sorted CD1dindNKT cells (Fig. S8C).
Finally, to prove that CD1dindNKT cells function like NK cells, we examined granzyme B production outcomes in response to Poly:IC treatment (Fig. 3 C–E and Fig. S9). We used this model because the in vivo treatment with Poly:IC preferentially triggers NK cell cytotoxicity (28, 29), as shown in Fig. 3C. Indeed, although T cells did not respond to Poly:IC and iNKT cells responded poorly, the results revealed that CD1dindNKT cells are able to respond with significant production of granzyme B like NK cells (Fig. 3 C–D). Importantly, to ascertain that the production of granzyme B in CD1dindNKT cells was not the result of contamination by memory CD8+ T cells, this result was further confirmed in Poly:IC-treated β2m−/− mice (Fig. 3E). In addition, we used an established Gene Ontology pathway and examined the cytotoxic pathway in NK, CD1dindNKT, and iNKT cells at steady state (Fig. 3B). As predicted by their efficient cytotoxic response to Poly:IC, resting CD1dindNKT cells revealed pre-existing stocks of granzymes A and B and perforin 1 mRNA similar to that of resting NK cells (Fig. 3B). In contrast, the gzma, gzmb, and prf1 genes were not expressed in resting iNKT cells, a result consistent with their poor response to Poly:IC (Fig. 3C). Taken together, these data identify CD1dindNKT cells as a unique hybrid cell population that truly fulfills the function of an NK and a T cell.
CD1dindNKT Cells Are Thymus Dependent but MHC Unrestricted.
Given the hybrid nature of CD1dindNKT cells, we asked whether these cells develop in the thymus like conventional T cells or whether they follow an extrathymic T-cell development pathway. To address this question, we examined CD1dindNKT cells in nude mice lacking a thymic environment (30) and in mice deficient for the recombination activation genes (Rag) that cannot support T-cell development (31, 32) (Fig. 4 A and C and Fig. S10). We found that CD1dindNKT cells were absent from athymic nude mice, demonstrating that these cells are thymic-dependent lymphocytes. Similar results were obtained in Rag2−/− mice, confirming that these cells are bona fide T cells that require Rag for their development. Accordingly, we next asked whether CD1dindNKT cells are restricted by MHC class I or II (Fig. 4 B and C). We found that CD1dindNKT cells were present in β2m−/− mice indicating that their development is independent of classical MHC class I (Fig. 4 B and C). These cells were also found in MHC class II−/− mice, indicating that their development is independent of MHC class II (Fig. 4 B and C). To conclusively demonstrate that CD1dindNKT cells are MHC-unrestricted T cells, we examined this phenotype in MHC class II−/− β2m−/− mice (Fig. 4 B and C). Consistent with previous reports (27), our data showed normal if not moderately higher numbers of CD1dindNKT cells in MHC class II−/− β2m−/− mice, demonstrating that their development is independent of MHC class I and II (Fig. 4 B and C).
Although the developmental pathway of CD1dindNKT cells remains to be defined, it is clear that these MHC-unrestricted T cells require a thymus for their development. Given the extensive phenotypic and functional similarities shared between CD1dindNKT and NK cells, we hypothesized that they might share a recent common ancestor in the thymus. To gain insight into this possibility, we examined various transcription factors associated with thymic NK, iNKT, and T-cell development (Fig. 4D). We focused on three transcription factors that play a key role in cell subset determination: BTB–zinc finger transcriptional regulator Plzf (Zbtb16), which controls the development of iNKT cells (20); basic leucine zipper transcription factor E4bp4 (Nfil3), which is essential for the generation of NK cell lineage (33); and Bcl11b, which is required for the differentiation and survival of αβ T lymphocytes (34). With information collected from the Immunological Genome Project Consortium (2), we were able to examine the expression pattern of the transcription factor expression in our sorted NK, iNKT, and CD1dindNKT cells compared with thymic progenitors at various stages of development (Fig. 4D). First, this analysis confirmed that CD1dindNKT cells are distinct from iNKT cells as indicated by lack of Plzf (Fig. 4D and Fig. S6C). Second, whereas T and iNKT cells lacked Nfil3, our data uncovered a positive expression of Nfil3 in CD1dindNKT cells, which is reminiscent of NK cell lineage (Fig. 4D and Fig. S6C). Third, CD1dindNKT cells revealed an intermediate expression of Bcl11b, suggesting loss of expression (Fig. 4D and Fig. S6C). Loss of expression of Bcl11b is particularly important because it has been shown that when Bcl11b is turned off in T cells, these T cells were redirected to the NK cell lineage (35–37). Together, the close similarity in key developmental transcription factors between NK and CD1dindNKT cells supports the possibility that these cells diverged from the same lineage. Because NK cells are thought to diverge from the DN2 stage, we theorized that there is a second intermediate between DN2 and NK cells that gives rise to both NK and CD1dindNKT cells based on the expression of Nfil3 and the loss of expression of Bcl11b. Although more work is required to demonstrate that NK and CD1dindNKT cells are closely related in their ontogeny, we have integrated this possibility in a hypothetical scheme based on both our data and the current model of thymic NK and T-cell development (38) (Fig. 4E).
Discussion
NKT cells form a heterogeneous population of lymphocytes that remains intriguing to most (1, 8). One subset, iNKT cells, is well defined and characterized. These cells express a semi-invariant TCR, respond to α-GalCer loaded into CD1d, and have a hybrid function between a T and an NK cell (3–5). Another subset of NKT cells with a relatively variable TCR that recognizes the CD1d molecule has been classified and deemed NKT type II (6, 7). The third subset harbors all NKT cells that are not restricted by CD1d; cells under this category represent the most heterogeneous yet least characterized subsets of the NKT compartment. Whereas a large amount of attention has been attributed to the hybrid function of iNKT cells, here we provide molecular and functional evidence demonstrating that CD1dindNKT cells are uniquely programmed with a hybrid function that truly fulfills the nomenclature of NKT cells. This subset of NKT cells, termed CD1dindNKT cells, is known but very few have sought to determine how these cells fit into the continuum of T and NK cells.
As identified by the expression of NK markers DX5 and NK1.1, we found CD1dindNKT cells are broadly present and are distributed in organs that also harbor NK cells, such as spleen, liver, and thymus and in bone marrow and blood (39). Likewise, they were detected as early as 10 d of age in mice. Besides NK1.1 and DX5, we performed a comprehensive phenotypic characterization using markers commonly associated with NK cells. Consistent with an NK cell phenotype, we found that (i) CD1dindNKT cells expressed CD122 with high intensity, whereas iNKT cells expressed intermediate levels; (ii) expression of NKG2A, NKG2D, and CD94 was dominant on CD1dindNKT compared with iNKT cells; and (iii) expression of 2B4 and NKp46 was detected in CD1dindNKT cells but not in iNKT cells at an early age. However, despite resemblance with NK cells, CD1dindNKT cells are bona fide T cells. Our data showed that these cells expressed a functional CD3/TCRβ as demonstrated by rapid IFNγ production in response to TCR engagement. Moreover, these cells were absent in nude and Rag-deficient mice, indicating that their development occurs in the thymus like conventional T cells. However, unlike conventional T cells, these cells were present in CD1d−/−, MHC class II−/−, β2m−/−, and MHC class II−/− β2m−/−, showing that these are MHC-unrestricted T cells with an extensive resemblance to NK cells.
An irrefutable demonstration that placed CD1dindNKT cells closer to the NK cell lineage came from global gene expression analysis. First, most Klr genes expressed in NK cells were also found expressed in the CD1dindNKT cell subset, whereas relatively fewer were expressed in iNKT cells. Of interest, Ly49A was even expressed at a higher frequency in CD1dindNKT cells compared with NK cells. Subsets of T cells have been described as expressing Ly49 inhibitory receptors (40), and Ly49A specifically has been linked to the suppression of TCR-mediated signaling in T cells (41, 42). However, our data showing a rapid and efficient CD1dindNKT cell response to TCR engagement supports a different role for Ly49A in CD1dindNKT cells that remains to be determined. Second, genes of the cytotoxic pathway, including granzymes and perforins, were expressed in CD1dindNKT cells at steady state similar to that of NK cells, whereas steady-state iNKT cells did not express these genes. As a result, iNKT cells responded poorly to in vivo treatment with Poly:IC. In contrast, results showed a robust granzyme B response from CD1dindNKT cells that is reminiscent of an NK cell response. The efficient response of NK cells is in large part due to the acquisition of a preexisting pool of mRNA of granzymes and perforins during their development (43). In this regard, our data shows that CD1dindNKT but not iNKT cells are preprogrammed with premade mRNA transcripts for granzyme B and perforin that enable them to respond to innate stimuli like NK cells while being capable of adaptive responses via a functional TCR.
This functional evidence makes it plausible that CD1dindNKT and NK cells diverged from a shared common precursor. Considerable work has been done to show that NK cells may rely on V(D)J recombination activity early in their development (44–47). Using a GFP-type marking system, Pilbeam et al. were able to permanently mark NK cells that performed recombination in their developmental history (47). Other models of NK cell development have suggested that liver NK cells develop from a pathway independent of the bone marrow that allows them to support the peripheral pool of NK cells in early ontogeny when Rag-1–dependent NK cell progenitors are absent in the bone marrow (46). Other work has also shown that a thymus-dependent pathway exists for some NK cells and that this subset of NK cells specifically displays a rearrangement of TCRγ genes in the periphery (45). Here we show that CD1dindNKT cells have a high expression of important NK cell developmental genes such as Nfil3 while expressing intermediate levels of Bcl11b (35–38). Our finding is of great interest because of the recent breakthrough that loss of Bcl11b can reprogram T cells into NK cells (35). Therefore, it seems reasonable to hypothesize that there may be an NK progenitor in the bone marrow that has started V(D)J recombination and then home to the thymus to complete its development. Once in the thymus, selective pressures from the microenvironment that control the outcome of completing recombination and allow for the phenotypic display of a TCR give rise to what appears to be an NK cell masquerading as a CD1dindNKT cell. Another possibility is the existence of a population that does not complete V(D)J rearrangement and therefore does not display a TCR; this population would probably be conventional NK cells. Both populations would then leave the thymus and display similar phenotypic and functional characteristics in their resident organs but with one exception: CD1dindNKT cells, unlike NK cells, can also perform adaptive responses. An extensive shared program with NK cells, a close Euclidian distance with NK cells, and the ability to respond to innate signals like NK cells are all in support of this possibility. Nevertheless, the alternative that CD1dindNKT cells are ontogenically distinct from NK cells and therefore convert from T cells to NK cells cannot be ruled out. Such a conversion would require loss of Bcl11b and acquisition of Nfil3, which would give rise to Bcl11blowNfil3+ MHC-unrestricted NKT cells.
The Immunological Genome Project Consortium has recently identified a gene-expression program that linked iNKT cells to NK cells (2). Although this is true, here we provide molecular and functional evidence demonstrating that CD1dindNKT cells are uniquely programmed with a hybrid function that truly fulfills the nomenclature of NKT cells. In this regard, we have identified a family of 287 genes that were selectively expressed or repressed in this cell subset, and genes that emerged with the highest fold change were identified as genes involved in RNA regulation. Future work aimed at defining their ontogeny and scrutinizing their function will further establish the importance of CD1dindNKT cells as a unique population of lymphocytes that contribute to adaptive immunity and perform as a serious player in innate immunity.
Methods
Our data regarding experimental mice, in vivo treatment of mice, fluorochrome-conjugated antibodies, recombinant cytokines, cell preparation and culture, flow cytometry analysis, real-time RT-PCR, and gene chip analysis are detailed in SI Methods. Experimental protocols were approved by the University of Michigan Committee on Use and Care of Animals.
Supplementary Material
Acknowledgments
We thank Dr. A. Laouar (Rutgers University) for discussions on the manuscript, the flow cytometry core facility for cell sorting, the Affimetrix core facility for gene chip analysis, and the Immunological Genome Project Consortium for the availability of data from the different thymic progenitors. This work was supported by US National Institutes of Health Grant R01 AI083642 (to Y.L.).
Footnotes
The authors declare no conflict of interest.
*This Direct Submission article had a prearranged editor.
This article contains supporting information online at www.pnas.org/lookup/suppl/doi:10.1073/pnas.1323405111/-/DCSupplemental.
References
- 1.Godfrey DI, MacDonald HR, Kronenberg M, Smyth MJ, Van Kaer L. NKT cells: What’s in a name? Nat Rev Immunol. 2004;4(3):231–237. doi: 10.1038/nri1309. [DOI] [PubMed] [Google Scholar]
- 2.Cohen NR, et al. ImmGen Project Consortium Shared and distinct transcriptional programs underlie the hybrid nature of iNKT cells. Nat Immunol. 2013;14(1):90–99. doi: 10.1038/ni.2490. [DOI] [PMC free article] [PubMed] [Google Scholar]
- 3.Kawano T, et al. CD1d-restricted and TCR-mediated activation of valpha14 NKT cells by glycosylceramides. Science. 1997;278(5343):1626–1629. doi: 10.1126/science.278.5343.1626. [DOI] [PubMed] [Google Scholar]
- 4.Lantz O, Bendelac A. An invariant T cell receptor alpha chain is used by a unique subset of major histocompatibility complex class I-specific CD4+ and CD4-8- T cells in mice and humans. J Exp Med. 1994;180(3):1097–1106. doi: 10.1084/jem.180.3.1097. [DOI] [PMC free article] [PubMed] [Google Scholar]
- 5.Bendelac A, et al. CD1 recognition by mouse NK1+ T lymphocytes. Science. 1995;268(5212):863–865. doi: 10.1126/science.7538697. [DOI] [PubMed] [Google Scholar]
- 6.Jahng A, et al. Prevention of autoimmunity by targeting a distinct, noninvariant CD1d-reactive T cell population reactive to sulfatide. J Exp Med. 2004;199(7):947–957. doi: 10.1084/jem.20031389. [DOI] [PMC free article] [PubMed] [Google Scholar]
- 7.Girardi E, et al. Type II natural killer T cells use features of both innate-like and conventional T cells to recognize sulfatide self antigens. Nat Immunol. 2012;13(9):851–856. doi: 10.1038/ni.2371. [DOI] [PMC free article] [PubMed] [Google Scholar]
- 8.Hammond KJ, et al. NKT cells are phenotypically and functionally diverse. Eur J Immunol. 1999;29(11):3768–3781. doi: 10.1002/(SICI)1521-4141(199911)29:11<3768::AID-IMMU3768>3.0.CO;2-G. [DOI] [PubMed] [Google Scholar]
- 9.Assarsson E, et al. CD8+ T cells rapidly acquire NK1.1 and NK cell-associated molecules upon stimulation in vitro and in vivo. J Immunol. 2000;165(7):3673–3679. doi: 10.4049/jimmunol.165.7.3673. [DOI] [PubMed] [Google Scholar]
- 10.Yu J, et al. NKp46 identifies an NKT cell subset susceptible to leukemic transformation in mouse and human. J Clin Invest. 2011;121(4):1456–1470. doi: 10.1172/JCI43242. [DOI] [PMC free article] [PubMed] [Google Scholar]
- 11.Cella M, et al. A human natural killer cell subset provides an innate source of IL-22 for mucosal immunity. Nature. 2009;457(7230):722–725. doi: 10.1038/nature07537. [DOI] [PMC free article] [PubMed] [Google Scholar]
- 12.Stewart CA, et al. Germ-line and rearranged Tcrd transcription distinguish bona fide NK cells and NK-like gammadelta T cells. Eur J Immunol. 2007;37(6):1442–1452. doi: 10.1002/eji.200737354. [DOI] [PubMed] [Google Scholar]
- 13.Carlyle JR, et al. Molecular and genetic basis for strain-dependent NK1.1 alloreactivity of mouse NK cells. J Immunol. 2006;176(12):7511–7524. doi: 10.4049/jimmunol.176.12.7511. [DOI] [PubMed] [Google Scholar]
- 14.Hammond KJ, et al. CD1d-restricted NKT cells: An interstrain comparison. J Immunol. 2001;167(3):1164–1173. doi: 10.4049/jimmunol.167.3.1164. [DOI] [PubMed] [Google Scholar]
- 15.Walzer T, et al. Identification, activation, and selective in vivo ablation of mouse NK cells via NKp46. Proc Natl Acad Sci USA. 2007;104(9):3384–3389. doi: 10.1073/pnas.0609692104. [DOI] [PMC free article] [PubMed] [Google Scholar]
- 16.Lanier LL, Chang C, Spits H, Phillips JH. Expression of cytoplasmic CD3 epsilon proteins in activated human adult natural killer (NK) cells and CD3 gamma, delta, epsilon complexes in fetal NK cells. Implications for the relationship of NK and T lymphocytes. J Immunol. 1992;149(6):1876–1880. [PubMed] [Google Scholar]
- 17.Eberl G, et al. Tissue-specific segregation of CD1d-dependent and CD1d-independent NK T cells. J Immunol. 1999;162(11):6410–6419. [PubMed] [Google Scholar]
- 18.Walunas TL, et al. CTLA-4 can function as a negative regulator of T cell activation. Immunity. 1994;1(5):405–413. doi: 10.1016/1074-7613(94)90071-x. [DOI] [PubMed] [Google Scholar]
- 19.Cayabyab M, Phillips JH, Lanier LL. CD40 preferentially costimulates activation of CD4+ T lymphocytes. J Immunol. 1994;152(4):1523–1531. [PubMed] [Google Scholar]
- 20.Kovalovsky D, et al. The BTB-zinc finger transcriptional regulator PLZF controls the development of invariant natural killer T cell effector functions. Nat Immunol. 2008;9(9):1055–1064. doi: 10.1038/ni.1641. [DOI] [PMC free article] [PubMed] [Google Scholar]
- 21.Szabo SJ, et al. A novel transcription factor, T-bet, directs Th1 lineage commitment. Cell. 2000;100(6):655–669. doi: 10.1016/s0092-8674(00)80702-3. [DOI] [PubMed] [Google Scholar]
- 22.Zheng W, Flavell RA. The transcription factor GATA-3 is necessary and sufficient for Th2 cytokine gene expression in CD4 T cells. Cell. 1997;89(4):587–596. doi: 10.1016/s0092-8674(00)80240-8. [DOI] [PubMed] [Google Scholar]
- 23.Ivanov II, et al. The orphan nuclear receptor RORgammat directs the differentiation program of proinflammatory IL-17+ T helper cells. Cell. 2006;126(6):1121–1133. doi: 10.1016/j.cell.2006.07.035. [DOI] [PubMed] [Google Scholar]
- 24.Fontenot JD, Gavin MA, Rudensky AY. Foxp3 programs the development and function of CD4+CD25+ regulatory T cells. Nat Immunol. 2003;4(4):330–336. doi: 10.1038/ni904. [DOI] [PubMed] [Google Scholar]
- 25.Townsend MJ, et al. T-bet regulates the terminal maturation and homeostasis of NK and Valpha14i NKT cells. Immunity. 2004;20(4):477–494. doi: 10.1016/s1074-7613(04)00076-7. [DOI] [PubMed] [Google Scholar]
- 26.Orange JS, Biron CA. An absolute and restricted requirement for IL-12 in natural killer cell IFN-gamma production and antiviral defense. Studies of natural killer and T cell responses in contrasting viral infections. J Immunol. 1996;156(3):1138–1142. [PubMed] [Google Scholar]
- 27.Maeda M, Shadeo A, MacFadyen AM, Takei F. CD1d-independent NKT cells in beta 2-microglobulin-deficient mice have hybrid phenotype and function of NK and T cells. J Immunol. 2004;172(10):6115–6122. doi: 10.4049/jimmunol.172.10.6115. [DOI] [PubMed] [Google Scholar]
- 28.Wulff S, Pries R, Wollenberg B. Cytokine release of human NK cells solely triggered with Poly I:C. Cell Immunol. 2010;263(2):135–137. doi: 10.1016/j.cellimm.2010.03.020. [DOI] [PubMed] [Google Scholar]
- 29.Edwards BS, Borden EC, Smith-Zaremba K. Divergence in activation by poly I:C of human natural killer and killer cells. Cancer Immunol Immunother. 1982;13(3):158–163. doi: 10.1007/BF00205381. [DOI] [PMC free article] [PubMed] [Google Scholar]
- 30.Pantelouris EM, Hair J. Thymus dysgenesis in nude (nu nu) mice. J Embryol Exp Morphol. 1970;24(3):615–623. [PubMed] [Google Scholar]
- 31.Mombaerts P, et al. RAG-1-deficient mice have no mature B and T lymphocytes. Cell. 1992;68(5):869–877. doi: 10.1016/0092-8674(92)90030-g. [DOI] [PubMed] [Google Scholar]
- 32.Shinkai Y, et al. RAG-2-deficient mice lack mature lymphocytes owing to inability to initiate V(D)J rearrangement. Cell. 1992;68(5):855–867. doi: 10.1016/0092-8674(92)90029-c. [DOI] [PubMed] [Google Scholar]
- 33.Gascoyne DM, et al. The basic leucine zipper transcription factor E4BP4 is essential for natural killer cell development. Nat Immunol. 2009;10(10):1118–1124. doi: 10.1038/ni.1787. [DOI] [PubMed] [Google Scholar]
- 34.Wakabayashi Y, et al. Bcl11b is required for differentiation and survival of alphabeta T lymphocytes. Nat Immunol. 2003;4(6):533–539. doi: 10.1038/ni927. [DOI] [PubMed] [Google Scholar]
- 35.Li P, et al. Reprogramming of T cells to natural killer-like cells upon Bcl11b deletion. Science. 2010;329(5987):85–89. doi: 10.1126/science.1188063. [DOI] [PMC free article] [PubMed] [Google Scholar]
- 36.Ikawa T, et al. An essential developmental checkpoint for production of the T cell lineage. Science. 2010;329(5987):93–96. doi: 10.1126/science.1188995. [DOI] [PubMed] [Google Scholar]
- 37.Li L, Leid M, Rothenberg EV. An early T cell lineage commitment checkpoint dependent on the transcription factor Bcl11b. Science. 2010;329(5987):89–93. doi: 10.1126/science.1188989. [DOI] [PMC free article] [PubMed] [Google Scholar]
- 38.Klein Wolterink RG, García-Ojeda ME, Vosshenrich CA, Hendriks RW, Di Santo JP. The intrathymic crossroads of T and NK cell differentiation. Immunol Rev. 2010;238(1):126–137. doi: 10.1111/j.1600-065X.2010.00960.x. [DOI] [PubMed] [Google Scholar]
- 39.Di Santo JP. Natural killer cell developmental pathways: A question of balance. Annu Rev Immunol. 2006;24:257–286. doi: 10.1146/annurev.immunol.24.021605.090700. [DOI] [PubMed] [Google Scholar]
- 40.Ortaldo JR, Winkler-Pickett R, Mason AT, Mason LH. The Ly-49 family: Regulation of cytotoxicity and cytokine production in murine CD3+ cells. J Immunol. 1998;160(3):1158–1165. [PubMed] [Google Scholar]
- 41.Leavenworth JW, Pauza ME. Engagement of transgenic Ly49A inhibits mouse CD4 cell activation by disrupting T cell receptor, but not CD28, signaling. Cell Immunol. 2009;257(1-2):88–96. doi: 10.1016/j.cellimm.2009.03.003. [DOI] [PubMed] [Google Scholar]
- 42.Zajac AJ, et al. Impaired anti-viral T cell responses due to expression of the Ly49A inhibitory receptor. J Immunol. 1999;163(10):5526–5534. [PubMed] [Google Scholar]
- 43.Fehniger TA, et al. Acquisition of murine NK cell cytotoxicity requires the translation of a pre-existing pool of granzyme B and perforin mRNAs. Immunity. 2007;26(6):798–811. doi: 10.1016/j.immuni.2007.04.010. [DOI] [PubMed] [Google Scholar]
- 44.Igarashi H, Gregory SC, Yokota T, Sakaguchi N, Kincade PW. Transcription from the RAG1 locus marks the earliest lymphocyte progenitors in bone marrow. Immunity. 2002;17(2):117–130. doi: 10.1016/s1074-7613(02)00366-7. [DOI] [PubMed] [Google Scholar]
- 45.Veinotte LL, Greenwood CP, Mohammadi N, Parachoniak CA, Takei F. Expression of rearranged TCRgamma genes in natural killer cells suggests a minor thymus-dependent pathway of lineage commitment. Blood. 2006;107(7):2673–2679. doi: 10.1182/blood-2005-07-2797. [DOI] [PubMed] [Google Scholar]
- 46.Andrews DM, Smyth MJ. A potential role for RAG-1 in NK cell development revealed by analysis of NK cells during ontogeny. Immunol Cell Biol. 2010;88(2):107–116. doi: 10.1038/icb.2009.94. [DOI] [PubMed] [Google Scholar]
- 47.Pilbeam K, et al. The ontogeny and fate of NK cells marked by permanent DNA rearrangements. J Immunol. 2008;180(3):1432–1441. doi: 10.4049/jimmunol.180.3.1432. [DOI] [PMC free article] [PubMed] [Google Scholar]
Associated Data
This section collects any data citations, data availability statements, or supplementary materials included in this article.