Significance
X-ray Talbot−Lau grating interferometry provides a differential phase contrast and a dark-field image containing scattering information. The dark-field image is sensitive to granular and fibrous microstructures with sizes in the range of the grating periods (circa 5 μm), much below the typical resolution of medical imaging techniques like angiography or fluoroscopy (circa 150 μm). Dark-field contrast is influenced by the orientation of the microstructure in the object. We present an approach to recover the local microstructure orientation in a tomographic 3D reconstruction. Per voxel, we quantitatively reconstruct the vector of the dominant local orientation and the amount of (an)isotropic scattering for relatively large samples using a standard medical X-ray setup. This is experimentally shown for various specimens exhibiting varying degrees of structural orderings.
Keywords: X-ray phase contrast, grating interferometer, microstructure orientation, anisotropic scattering
Abstract
Grating-based X-ray dark-field imaging is a novel technique for obtaining image contrast for object structures at size scales below setup resolution. Such an approach appears particularly beneficial for medical imaging and nondestructive testing. It has already been shown that the dark-field signal depends on the direction of observation. However, up to now, algorithms for fully recovering the orientation dependence in a tomographic volume are still unexplored. In this publication, we propose a reconstruction method for grating-based X-ray dark-field tomography, which models the orientation-dependent signal as an additional observable from a standard tomographic scan. In detail, we extend the tomographic volume to a tensorial set of voxel data, containing the local orientation and contributions to dark-field scattering. In our experiments, we present the first results of several test specimens exhibiting a heterogeneous composition in microstructure, which demonstrates the diagnostic potential of the method.
X-ray dark-field images, which are obtained using a Talbot−Lau grating interferometer, reveal differences in the real part of the refractive index of a material at micrometer scale, commonly subsumed as ultra-small-angle scattering (1–3). This can be observed in specimens with a high level of porosity or granularity. As such, dark-field imaging yields the potential for novel diagnostic methods in medical imaging as well as approaches to nondestructive testing. A high sensitivity especially to structures composed of weakly absorbing materials has been shown. Ultra-small-angle scattering can be either isotropic or anisotropic, generated by structures of the order of magnitude of the grating period of the interferometer. For the exploitation of isotropic scattering, several groups reported experiments in dark-field radiography and computed tomography in a wide spread of promising applications such as detection of micrometer-sized calcifications in breast tumor lesions or the investigation of lung and joints (3–5). Until now, however, the exploitation of anisotropic scattering has remained largely unexplored. Anisotropic scattering is produced by ordered structures, such as layers, or fibers with radii of few micrometers. Recently, Bayer et al. (6) presented the observation of periodic dark-field projections caused by the orientations in microstructures and illustrated the potential of exploiting full information of specimens. Hence, special attention has to be paid to the orientation of these structures relative to the grating bars, making the exploitation of anisotropic scattering information challenging. Prior work reported partial retrieval of structured information regarding isotropic and anisotropic properties in materials (6–9). Revol et al. (7) separated isotropic and anisotropic components of individual orientations by known orientations as prior knowledge. Malecki et al. (8) formulated the product of directional scattering and the sensitivity vector of the grating interferometer based on a certain number of different scattering directions. However, no attempt has been made to fully reconstruct the 3D local orientation in each voxel and its contribution to scattering. In this paper, we present an approach to separate scalar and vectorial components of the dark-field imaging process. The separation is the solution to an inverse problem within a system of linear equations. The proposed method recovers the observed projection of the isotropic component and the amount and direction of the anisotropic scattering component in each voxel in a sample object. It operates on data obtained by a grating interferometer-based, single tomographic scan; i.e., no additional views are required. Hence, the method is also applicable retrospectively to already existing data. Experimental results demonstrate the feasibility of our reconstruction method. The unprecedented information derived by these orientation-specific dark-field reconstructions could potentially have great impact on biomedical imaging as well as on material sciences.
Orientation-Dependent Dark-Field Tomography
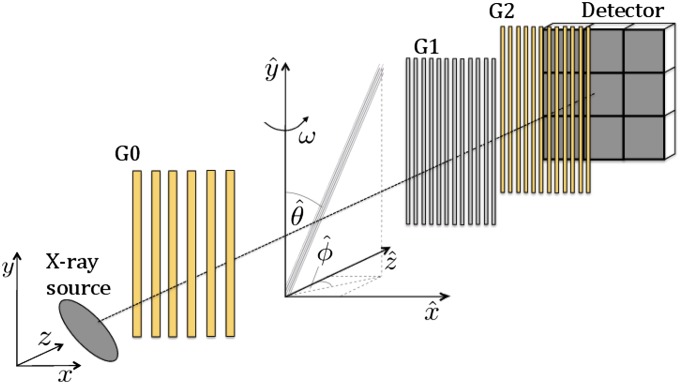
We introduce the measurement coordinate system (x, y, z) of the Talbot−Lau interferometer as indicated in Fig. 1, and additionally the object coordinate system . An object voxel at position contains fibers with orientation angles and as indicated in Fig. 1. For tomographic imaging, the object is rotated around the axis by an angle ω. According to Bayer et al. (6) and Revol et al. (7), the contribution of an object voxel at position to the logarithmic dark-field signal is given by
| [1] |
where diso is a measure of the isotropic scattering contribution, and daniso is the amount of anisotropic scattering, which has maximum impact to the logarithmic dark-field signal at the angle . As thick samples are observed and diso and daniso already incorporate effects of scattered as well as unscattered photons, the contribution of unscattered photons to the dark field does not need to be considered separately and can be ignored.
Fig. 1.
Grating interferometer with a fiber stack as object to be imaged. The fiber orientation angles and in the object frame are indicated. For tomography, the object is rotated around the axis by an angle ω. In this example, ω = 0°.
In a parallel-beam imaging system, reconstruction is done within a plane of constant height . Hence, for clarity, we subsequently omit the parameter , such that
| [2] |
The dark field can be factorized using addition theorems,
| [3] |
where
| [4] |
Note that the quantities of interest , , and can be calculated from , , , which must be obtained from the measurement.
Let the resolution of an object slice at height be M × N voxels. For a projection with rotation angle ω, the logarithmic dark-field signal measured at a detector pixel s is given by the sum of the per-voxel contributions along the ray traversing the object, i.e.,
| [5] |
with the constraint that the positions of the contributing object voxels must lie on the line of sight of pixel s at rotation angle ω, i.e., . Here, we use a parallel-beam geometry. To accommodate a cone-beam geometry, appropriate corrections could be applied to this expression. Expanding with the right-hand side of Eq. 3 yields
| [6] |
Let the detector length be S, and the sample is scanned from L different projection angles ωl(1 ≤ l ≤ L). In computed tomography, the formation of the projection values D(st, ωl) (with 1 ≤ t ≤ S, 1 ≤ l ≤ L) for one investigated slice is often modeled as a system of linear equations. Here,
| [7] |
The exact content of D, M, Q, and d is presented below. The overall goal is to estimate for each of the N × M voxels in a reconstructed slice three unknown scatter coefficients in d; d is reconstructed from the observations in D by selecting per detector cell the voxels that are traversed by a beam (using M) and transformed according to Eq. 3 (using Q).
We proceed by defining the variables in Eq. 7. Here, D is the logarithmic dark-field signal observed at the detector,
| [8] |
M is a SL × LMN block matrix where is the contribution of voxel to the ray D(s, l),
| [9] |
and Qd is the projected portion of the isotropic and anisotropic scattering and treated as a tensor product by previous literature (10, 11). Q has the dimension LMN × 3MN, consisting of L submatrices for each angle ωl,
| [10] |
where is the MN × MN identity matrix and ⊗ denotes the Kronecker product; d is the unknown vector for which the system is solved. Let with 1 ≤ r ≤ 3, 1 ≤ i ≤ M, 1 ≤ j ≤ N, then
| [11] |
Note that it is not feasible to solve Eq. 7 directly for d, i.e., by matrix inversion, due to the large dimensionality of the linear system of equations. Additionally, the solution might be numerically unstable. Instead, we applied a gradient descent method (12) with zero constraints. The zero constraint is obtained by the reconstructed attenuation images of the sample based on the same phase-stepping procedure. A zero or negligibly small attenuation value indicates nonobject regions that do not contribute to ultra-small-angle scattering. This zero-constrained gradient descent method improves the speed of convergence and is formulated as follows:
-
•
Step 1: Initial dk=0 = 0.
-
•
Step 2: dk+1 = dk + λQTMT(AQdk − D), where λ is the searching step size set manually for different samples.
-
•
Step 3: Apply zero constraint to dk+1, i.e., set elements in dk+1 to be zero according to the zero points in the reconstructed attenuation image.
-
•
Repeat Step 2 and Step 3 until a convergence criterion is satisfied; in our case, the maximum of iteration numbers was used as the stopping criteria.
For each object voxel , the isotropic component diso, the anisotropic component daniso, and the in-plane angle can be reconstructed. Properties of different materials may become visible by the isotropic and anisotropic component. Subtle structure variations may be accessible by the angle.
Results
The orientation-dependent dark-field tomography reconstruction was evaluated using four different objects. First, we numerically simulated an object with known parameters, which we call a numerical phantom, to examine the dark-field line integral model and evaluate the zero-constrained reconstruction algorithm. Second, we investigate three real samples, namely a wooden block, a carbon fiber reinforced carbon (CFRC) sample, and a peanut, that are increasingly complex in microstructure.
Numerical Phantom.
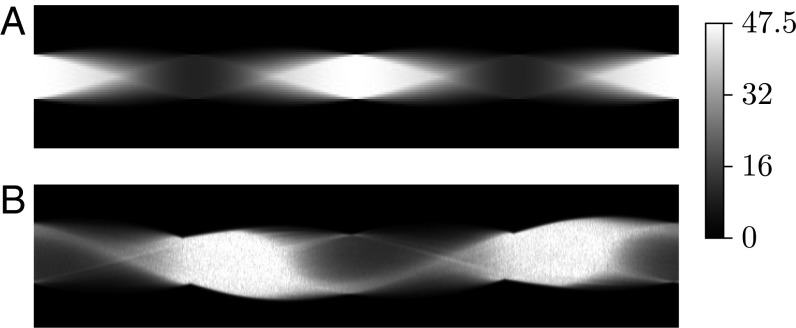
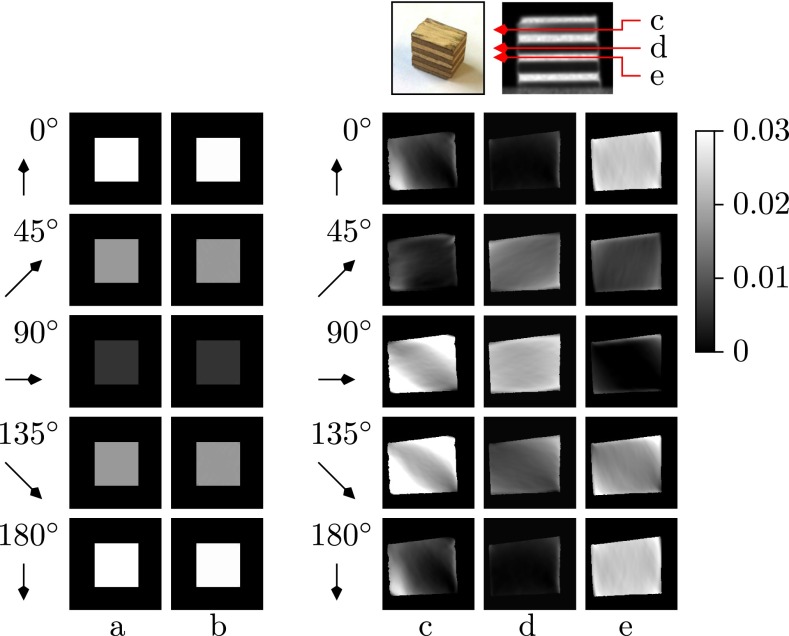
A computer-simulated numerical phantom was created as a mathematical 20 × 20 pixel block positioned in an image of size 40 × 40 pixels. The block has the isotropic parameter , anisotropic parameter , and local orientation . This numerical phantom was projected based on Eq. 5. The projection sinogram is shown in Fig. 2A. Fig. 3 shows the orientation-dependent dark-field values of the simulated digital object as ground truth (column a) and its tomographic reconstruction (column b). Projection angles ωl from top to bottom are 0°, 45°, 90°, 135° and 180°. The image displays uniformly a minimum at projection angle 90° and a maximum at projection angles 0° and 180°. Visually, the vectorial reconstructions (Fig. 3, column b) match the ground truth values (Fig. 3, column a) very well. As a quantitative measure of the algorithm convergence, we calculated the errors between reconstructed value and ground truth per slice separately for the isotropic component , vector magnitude and local orientation . The metrics are defined as
| [12] |
where N × M is the resolution of an object slice. Fig. 4 Left shows the results for each iteration step in a representative slice.
Fig. 2.
Dark-field sinograms (A) of the numerical phantom and (B) of a horizontal slice of the fibrous wooden block.
Fig. 3.
(Lower) Reconstructed slices illustrating the orientation-dependent dark-field values . Each row shows voxel values with projection angle ωl = 0°, 45°, 90°, 135°, or 180° (from top to bottom), respectively. Columns a and b show ground truth and reconstruction result of the numerical phantom. Columns c, d, and e show representative reconstruction results of the wooden block in layers 61 (c), 99 (d), and 141 (e); see photograph and dark-field projection image (Upper). The arrows indicate the fiber orientation which could give maximum contribution to the dark-field measured for the given projection angle ωl. If an image region is dark, it contains no fibers oriented in arrow direction. Conversely, bright regions contain fibers oriented close to the arrow direction.
Fig. 4.

For the numerical phantom, the error in the isotropic and anisotropic contribution as well as the angular component could be reduced to almost zero after less than 30 iterations (Left). The raw data error for the wooden sample is reduced to 30% of its initial value after only three iterations (Right).
Wooden Sample.
Fig. 2B shows the sinogram of a horizontal slice of a tomographic measurement of a wooden block. Note the similarity with the phantom data in Fig. 2A, in particular the same periodic dark-field signal pattern. The orientation-dependent reconstruction of the wooden sample from 601 projections is presented on the right-hand side of Fig. 3 Right, by showing three representative layers: the 61st (c), 99th (d), and 141st (e) layer. For each layer, five images present the orientation-dependent dark-field corresponding to five projection angles ωl = 0°, 45°, 90°, 135°, and 180°. The orientation-dependency can be observed in each column. The phase of dark-field signal in layer d is shifted by from the phase in layer c, and a phase shift of is obtained between layers d and e.
To exploit the convergence of the algorithm to projection data, we investigated the raw data error er between the forward projection of our reconstruction and the captured raw data (13), defined based on Eq. 7 as
| [13] |
This metric essentially captures the convergence of the projection of the reconstructed dark-field value and the acquired signal. The raw data error for the wooden sample (shown in Fig. 4 Right) is reduced after three iterations to only 30% of the initial error. To illustrate the local orientation of the sample structure with its fibers with diameters in the micrometer scale, the reconstruction result was visualized in ParaView. The microstructure denoted by is visualized by lines. The length of the lines indicates the magnitude of the anisotropic contribution, daniso, to the scattering and the direction of the lines shows the structure orientation. Fig. 5 reveals different local orientations in different layers. The wooden sample was composed by eight major plies. We chose the 45th (a), 61st (b), 81st (c), and 99th (d) layers for visualizing the difference in structure orientation between the different plies. The length of each line indicates the anisotropic scattering strength of a voxel and points in its predominant direction. The b layer showed a orientation difference to the neighboring layers. The other layers were arranged at an additional rotation of (also the remaining four layers, which are not shown due to space limitations). This result is consistent with the reconstruction images shown above in Fig. 3, layers c−e.
Fig. 5.

Visualization of the microstructure of the wooden sample in the 45th (a), 61st (b), 81st (c), and 99th (d) layers. The length of each line indicates the anisotropic scattering strength of a voxel and points in its predominant direction.
CFRC Sample.
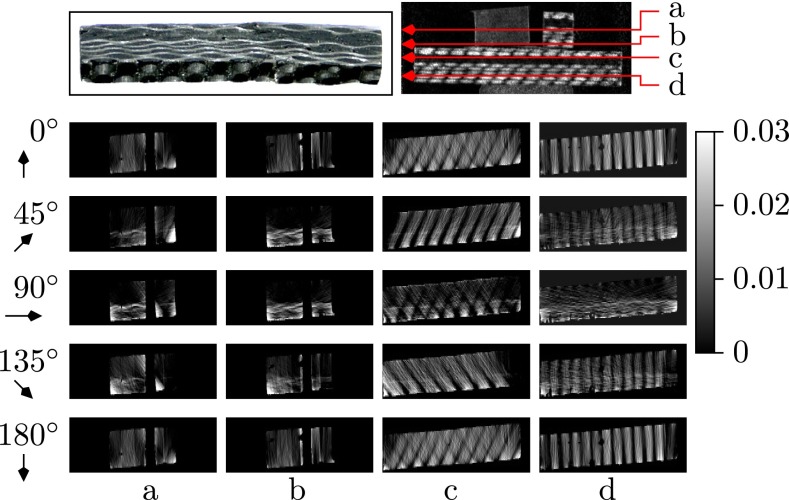
The next sample we studied was a piece of structured CFRC, with individual block aligned in different directions. Four representative layers along the axis, the 37th, 63rd, 100th, and 130th, are shown in Fig. 6 and demonstrate the orientation-dependent reconstruction of the sample. These layers are shown column-wise in Fig. 6. In each row, from top to bottom, the presented projection angles are ωl = 0°, 45°, 90°, 135°, 180°. In layer c and layer d, a periodic directional scattering pattern can be observed consistent with the macroscopic structure visible in a photograph of the block (Fig. 6, Upper Left). The sample structure of layers a and b, however, is more complicated because fibers were both parallel and perpendicular to the rotation plane. As a result, the scattering orientation is only partially reconstructed. Based on the tomographic reconstruction, we can draw the following conclusions about the sample: layer d has a periodic cross-woven structure that is aligned with the sample boundaries; the structure in layer c is rotated by compared with layer d; the right block in layers a and b exhibited similar fiber orientations as the bigger, underlying block in layers c and d.
Fig. 6.
Dark-field projection image (Upper Right) and tomographic reconstructions (Lower) of a CFRC sample object in the 37th (a), 63rd (b), 100th (c), and 130th layer (d). Each column shows a series of dark-field scattering images corresponding to projection angles ωl = 0°, 45°, 90°, 135°, 180° (from top to bottom). (Upper Left) A photograph of the CFRC block, which forms the lower part of the sample including investigated layers c and d. Layers a and b correspond to smaller blocks placed onto the latter one.
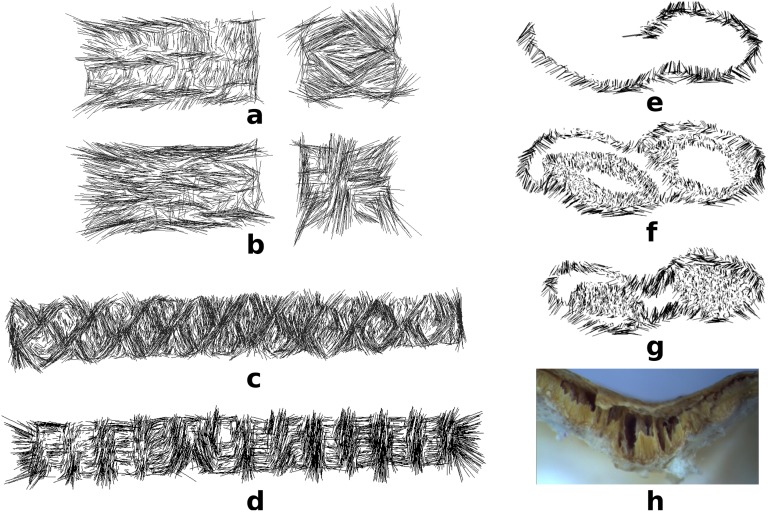
Fig. 7 Left allows the study of the microstructure of the sample, through visualization of anisotropic scattering of slices a to d from Fig. 6. Each line in these samples indicates the strength and direction of the anisotropic portion (hence, a line in this visualization can run over the border of the object, if its anisotropic component is sufficiently strong). Varied in-plane directional information can be observed in this visualization. In both layers a and b, the structure in the left block is roughly identical, while the right block exhibits a rotation of between layer a and layer b. The main microstructures in layer c are cross-woven, which forms a angle toward the sample boundary. Layer d exhibits the cross-woven structure in a similar manner. Here, the bundles of fibers point mainly in direction along with the object edges.
Fig. 7.
(Left) CFRC sample. Visualization of microstructures using the 37th (a), 63rd (b), 100th (c), and 130th slice (d) of the CFRC sample. The length of each line indicates the anisotropic scattering strength of a voxel and points in its predominant direction. (Right) Peanut sample. Visualization of microstructures using the 41st (e), 100th (f), and 133rd (g) slice and microscopy image of the shell waist (h). The seeds show weak anisotropy, whereas fibrous components in the shell exhibit a high anisotropic contribution and are mostly aligned along the shell surface. Slice g shows that the microstructure of the peanut waist is oriented mostly perpendicular to the surface to obtain mechanical stability.
The tomographic projection data for this experiment are considerably noisier than for the other experiments. One of the reasons is that the path length varies between 44 mm along the major axis and 6 mm along the minor axis. Still, the raw data error also drops to 50% of its initial value after three iterations (see Fig. 8 Left).
Fig. 8.

(Left) The raw data error for the CFRC sample is reduced to 50% after only three iterations. (Right) The raw data error for the peanut is reduced to 15% after three iterations.
Peanut Sample.
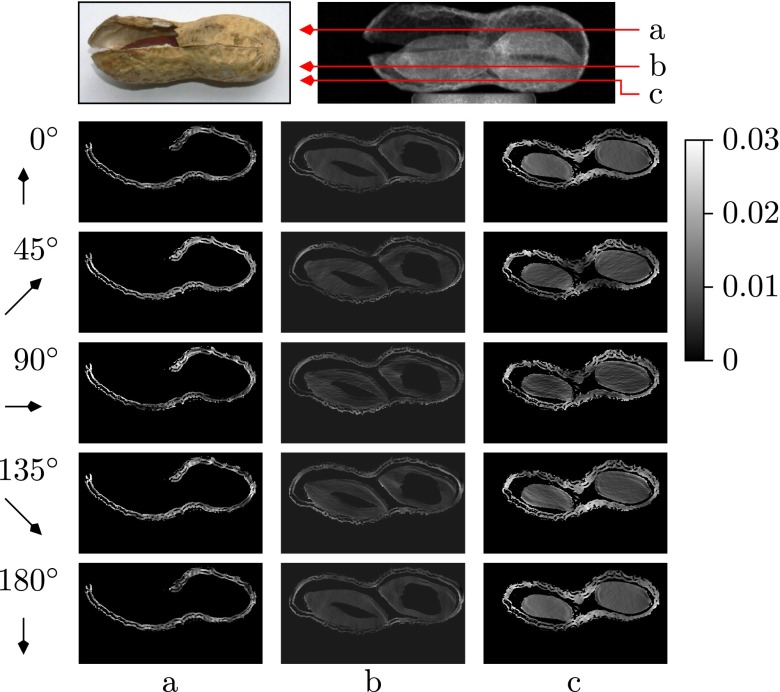
Our final physical sample is a peanut, which shows less angular dependence (see Fig. 9). In each column from top to bottom, the imaging angles are again ωl = 0°, 45°, 90°, 135°, 180°. From left to right, three representative slices are shown. We chose the 41st layer, in which the tomography contains only the upper part of the peanut shell, and the 100th and 133rd, in which peanut shell, peanut seed coat, and peanut seed, respectively, were present. Due to the fact that the peanut shell consists mostly of wooden fiber structure, the shell part in each layer exhibits the strongest directional scattering effect.
Fig. 9.
Dark-field projection image (Upper Right) and tomographic reconstructions (Lower) of a peanut sample (see photograph Upper Left) in the 41st layer (a), 100th layer (b), and 133rd layer (c). Each column shows a series of dark-field scattering images with projection angles ωl = 0°, 45°, 90°, 135°, 180° (from top to bottom).
The visualization of the microstructure in Fig. 7 Right (slices e−g) supports these findings. Essentially no angular-dependent scattering could be observed from the seed parts. The structure of the shell shows mostly alignment along its surface, whereas the waist contains fibers in perpendicular direction, which supports the mechanical stability of the shell. We also visually examined the fiber direction structures under an optical microscope (Fig. 7, subimage h). The waist visually shows microstructure that is orientated exactly in the direction of the microstructure visualization.
The raw data error was reduced to about 15% of the original error after three iterations, as shown in Fig. 8 Right.
Discussion
A method for orientation-dependent X-ray dark-field reconstruction and its application to experimental data was presented. The main benefit of this approach is that isotropic and anisotropic scattering are separated in the projection space, and high-quality reconstructions of the per-voxel scatter direction are obtained. To implement this method, no prior knowledge about the sample itself is required. Limitations arise in the angular reconstruction that only the projection of the 3D angle into the xz plane can be reconstructed. This can be overcome by calculating the elevation angle from two in-plane projected angles. The remaining projected angle can be recovered by reconstructing the sample after rotation around the origin. The reconstruction operates on a standard tomographic dark-field scan; i.e., no additional data are required. For validation of the proposed algorithm, we used a numerical phantom whose sinogram exhibits high similarity to a wooden block (see Fig. 2). The error plot in Fig. 4 shows that the iterative algorithm converges quickly. Experimental results from the wooden and CFRC sample demonstrated the method’s ability to separate the directional information on the microstructure both within a single layer and across different layers. Qualitative results on a peanut further illustrate the potential of the approach on a biologic specimen.
Conclusion and Outlook
We proposed a reconstruction method for X-ray dark-field tomography. The underlying model formulates the dark-field signal as linear combinations of different directional scatterers in the beam path, hence being subject to a varying dark-field signal. For any ray, the directional scatterers are formed by linear combinations of three coefficients composed of an isotropic component, an anisotropic component, and a local geometric orientation. Based on this model, the reconstruction problem can be formulated as a system of linear equations. As a solution, we propose to use a zero-constrained gradient descent method. This makes it possible to fully reconstruct for each voxel the isotropic and anisotropic component, as well as the local orientation of the fibers in the specimen. The presented algorithm is experimentally verified with a fibrous wooden sample, a CFRC sample, and a common peanut. The specimens demonstrated the feasibility to reconstruct microstructure both in-plane and in-layer.
We believe that the separation of scattering contributions in dark-field reconstruction is a powerful concept. It enriches each voxel in the volume with the orientation and strength of the anisotropic scatter. These quantities can be recovered from any grating-based tomographic scan, and hence could become a standard source of information for medical diagnosis and investigation of nondetachable specimens in material testing. One potential benefit lies in the diagnosis of osteoporosis, where different bone structures have shown particular differences in the dark-field signal (14). Another benefit might come from the early detection of cancer. At a stage where malignant nodules are still very small, their signal in standard attenuation X-ray or MRI is weak. However, dark-field has the ability to visualize structural tissue variations below resolution limit of the system. Hence, the vectorial dark-field reconstruction could have great impact in visualizing varying nodule vascularization, which is present due to metabolic demands in tumor tissue already at early stages (15). In principle, the presented method can be scaled up to a larger FOV, e.g., to investigate large specimens, assembly units, etc., while still leveraging the advantage of being sensitive to structures below imaging setup resolution.
Materials and Methods
Grating Interferometer Setup.
A polychromatic X-ray spectrum from a commercial rotating anode tube (MEGALIX CatPlus 125/40/90, Siemens AG) was used to illuminate the three gratings of the Talbot−Lau interferometer setup (compare to Fig. 1). The first grating downstream of the X-ray tube is a source grating denoted as G0, assuring the horizontal spatial coherence as required for the subsequent configuration consisting of a phase grating G1 and an analyzer grating G2. The heights of the grating bars are 8.7 μm nickel with period 4.37 μm for G1, and 150 μm and 110 μm gold for G0 and G2, respectively. The period of G0 is 24.39 μm, and 2.4 μm for G2. All gratings were manufactured by the Karlsruhe Institute of Technology. The distances are dG0−G1 = 161.2 cm and dG1−G2 = 15.9 cm. Radiographs are recorded downstream of G2 using a conventional flat-panel detector (Varian PaxScan 2520D, Varian, Inc.) with CsI scintillator and a detector pixel sampling of 127 μm.
Image Acquisition.
For the tomography scans, 601 (wooden and CFRC sample) or 361 projections (peanut) were taken over 360°, with four phase steps for each projection image. An exposure time of 4 s (CFRC and peanut) or 32 s (wooden sample) per projection was used. The X-ray tube was operated at 40 kV (wooden sample and peanut) or 60 kV voltage (CFRC sample) and a tube power of 2 kW. After every 25 projections, a reference image was taken to account for image artifacts because of intensity changes arising from moving Moiré fringes due to thermal expansion of the gratings.
Investigated Samples.
A cubic wooden sample (see picture in Fig. 3 Upper) was examined as first tomography specimen. It consists of eight different layers, in each of which wood fibers are almost perfectly parallel aligned. The fiber orientations of consecutive layers are crossed at 90°, sequentially, except the second uppermost layer, which is rotated by 45°. The wooden sample has outer dimensions (L×W×H) of 11 mm × 9.5 mm × 9.5 mm.
The second investigated sample is an arrangement of blocks of CFRC. A sample block with dimensions of 44 mm × 6.0 mm × 5.5 mm is shown in Fig. 6 Upper Left. The CFRC material blocks contain woven fabric sheets of carbon fiber bundles of some tens of millimeters, embedded in a quasi-amorphous graphite matrix that ensures the cohesion between the fibers and layers. The test sample consists of layers with cross-woven bundles forming a rectangular pattern. These layers are stacked to a bulk sample. The preferential directions of the fibers in different layers vary: The fibers in top and bottom layers are oriented along x and z axes (for ω = 0°). Two intermediate layers are rotated by 45° around the y axis. One block (top left one in the projection image in Fig. 6, Upper Right) is turned by 90° around the x axis.
As the third specimen in this study, a dried peanut was used with one side opened (see picture in Fig. 9 Upper Left). This sample forms an interesting biological specimen, exhibiting areas with predominantly isotropic or anisotropic scattering.
Algorithms and Visualization.
The presented algorithm is implemented in Java on a Fujitsu Celsius R930 Power computer with eight cores Intel(R) Xeon(R) CPU E5-2650 v2/2.60 GHz, 64 GB RAM, and NVIDIA GeForce GTX TITAN graphic card running on Windows 8. The reconstructed results are visualized in ParaView 3.10.1. ParaView is an open-source 3D-visualization software (http://www.paraview.org) that allows users to analyze their data both qualitatively and quantitatively. The reconstruction time is 163.779 s for the numerical phantom, 146.136 s for the wooden sample, 153.390 s for the CFRC sample, and 197.335 s for the peanut.
Supplementary Material
Acknowledgments
A.M. and C.P.R. acknowledge support from the Research Training Grant 1773 by the German Research Foundation. F.L.B. acknowledges the close research collaboration with the Fraunhofer Development Center X-Ray Technology (EZRT) within the project “Phase-contrast imaging for the characterization of microstructured matter,” financed by Fraunhofer IIS. This work was partly carried out with the support of the Karlsruhe Nano Micro Facility, a Helmholtz Research Infrastructure at Karlsruhe Institute of Technology.
Footnotes
The authors declare no conflict of interest.
This article is a PNAS Direct Submission. M.P. is a guest editor invited by the Editorial Board.
References
- 1.Pfeiffer F, et al. Hard-X-ray dark-field imaging using a grating interferometer. Nat Mater. 2008;7(2):134–137. doi: 10.1038/nmat2096. [DOI] [PubMed] [Google Scholar]
- 2.Yashiro W, Terui Y, Kawabata K, Momose A. On the origin of visibility contrast in x-ray Talbot interferometry. Opt Express. 2010;18(16):16890–16901. doi: 10.1364/OE.18.016890. [DOI] [PubMed] [Google Scholar]
- 3.Bravin A, Coan P, Suortti P. X-ray phase-contrast imaging: From pre-clinical applications towards clinics. Phys Med Biol. 2013;58(1):R1–R35. doi: 10.1088/0031-9155/58/1/R1. [DOI] [PubMed] [Google Scholar]
- 4.Michel T, et al. On a dark-field signal generated by micrometer-sized calcifications in phase-contrast mammography. Phys Med Biol. 2013;58(8):2713–2732. doi: 10.1088/0031-9155/58/8/2713. [DOI] [PubMed] [Google Scholar]
- 5.Bech M, et al. Quantitative x-ray dark-field computed tomography. Phys Med Biol. 2010;55(18):5529–5539. doi: 10.1088/0031-9155/55/18/017. [DOI] [PubMed] [Google Scholar]
- 6.Bayer F, et al. Projection angle dependence in grating-based X-ray dark-field imaging of ordered structures. Opt Express. 2013;21(17):19922–19933. doi: 10.1364/OE.21.019922. [DOI] [PubMed] [Google Scholar]
- 7.Revol V, Kottler C, Kaufmann R, Neels A, Dommann A. Orientation-selective X-ray dark field imaging of ordered systems. J Appl Phys. 2012;112:114903. [Google Scholar]
- 8.Malecki A, et al. X-ray tensor tomography. EPL. 2014;105(3):38002. [Google Scholar]
- 9.Jensen T, et al. Directional x-ray darkfield imaging of strongly ordered systems. Phys Rev B. 2010;82(21):214103. [Google Scholar]
- 10.Gullberg GT, Roy DG, Zeng GL, Andrew A, Parker D. Tensor tomography. Nuclear Science. 1999;46(4):991–1000. [Google Scholar]
- 11.Defrise M, Gullberg G. 2005. 3D Reconstruction of Tensors and Vectors (Lawrence Berkeley Natl Lab, Washington, DC), Tech Rep LBNL-54936.
- 12.Manhart MT, et al. Dynamic iterative reconstruction for interventional 4-D C-arm CT perfusion imaging. IEEE Trans Med Imaging. 2013;32(7):1336–1348. doi: 10.1109/TMI.2013.2257178. [DOI] [PubMed] [Google Scholar]
- 13.Zeng GL. Medical Image Reconstruction: A Conceptual Tutorial. Berlin: Springer; 2009. [Google Scholar]
- 14.Wen H, Bennett EE, Hegedus MM, Rapacchi S. Fourier X-ray scattering radiography yields bone structural information. Radiology. 2009;251(3):910–918. doi: 10.1148/radiol.2521081903. [DOI] [PMC free article] [PubMed] [Google Scholar]
- 15.Hillen F, Griffioen AW. Tumour vascularization: Sprouting angiogenesis and beyond. Cancer Metastasis Rev. 2007;26(3-4):489–502. doi: 10.1007/s10555-007-9094-7. [DOI] [PMC free article] [PubMed] [Google Scholar]


