Abstract
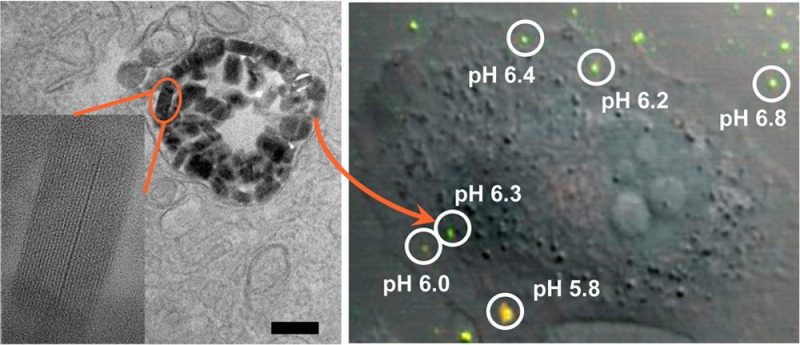
Real-time measurement of intracellular pH in live cells is of great importance for understanding physiological/pathological processes and developing intracellular drug delivery systems. We report here the first use of nanoscale metal–organic frameworks (NMOFs) for intracellular pH sensing in live cells. Fluorescein isothiocyanate (FITC) was covalently conjugated to a UiO NMOF to afford F-UiO NMOFs with exceptionally high FITC loadings, efficient fluorescence, and excellent ratiometric pH-sensing properties. Upon rapid and efficient endocytosis, F-UiO remained structurally intact inside endosomes. Live cell imaging studies revealed endo- and exocytosis of F-UiO and endosome acidification in real time. Fluorescently labeled NMOFs thus represent a new class of nanosensors for intracellular pH sensing and provide an excellent tool for studying NMOF–cell interactions.
Intracellular pH (pHi) plays an essential role in regulating cellular behaviors, including vesicle trafficking, cellular metabolism and signaling, and cell proliferation and apoptosis.1 In eukaryotic cells, the functions of subcellular organelles are highly dependent on the pH values in these individual compartments.3 The organelles participating in the secretory and endocytic pathways, such as endosomes and lysosomes, have a relatively low pH ranging from 4.5 to 6.5.1 Real-time sensing and monitoring of pH changes inside live cells are thus of great importance for understanding physiological and pathological processes and the rational design of intracellular drug delivery systems. pHi can be measured with a variety of techniques, including proton-permeable microelectrodes, NMR, absorption spectroscopy, and fluorescence imaging.4 Fluorescence-based techniques are among the most powerful tools for pH sensing, owing to their high sensitivity and outstanding spatiotemporal resolution.7 In particular, ratiometric sensing by measuring fluorescent signals at two excitation or emission wavelengths of a pH-sensitive probe is not adversely influenced by fluctuation of local probe concentration, allowing accurate and reliable pHi measurements.8 Since Kopelman et al. designed PEBBLEs (probes encapsulated by biologically localized embedding) as the first generation of ratiometric fluorescence nanosensors,9 a number of polymeric nanoparticles, silica nanoparticles, quantum dots, latex nanobeads, and zeolite-based nanoparticles have been developed for pHi sensing.6,10
Metal–organic frameworks (MOFs) are a new class of hybrid materials self-assembled from organic bridging ligands and metal-ion connecting points, and have been exploited as chemical sensors for metal ions, gas molecules, enantiopurity, and pH in aqueous solution.16 Recently, nanoscale MOFs (NMOFs) have also been developed for the delivery of chemotherapeutics and biologics.27 Herein we report the design of the first NMOF-based pH sensor for real-time pHi measurements in live cells.
Fluorescein isothiocyanate (FITC) is pH sensitive and exhibits pH-dependent ratiometric fluorescence changes, conferring its ability to sense the pHi in live cells.34 However, the utility of FITC in live cell imaging is severely limited by its rapid release from cells.35 We hypothesize that covalent conjugation of FITC to the bridging ligands of an NMOF will generate a novel NMOF sensor for real-time pHi measurements in live cells (Figure 1a). The advantages of using such FITC-conjugated NMOFs for pHi sensing include the following: (1) The periodic and porous structures of NMOFs enable high FITC loadings without dye aggregation, thus preventing deleterious self-quenching. (2) The open channels of NMOFs allow rapid and free diffusion of hydronium ions to afford fast sensor response.36 (3) The covalent conjugation of FITC to NMOFs prevents dye leaching, thus eliminating background interference stemming from the released dye during pHi sensing.
Figure 1.
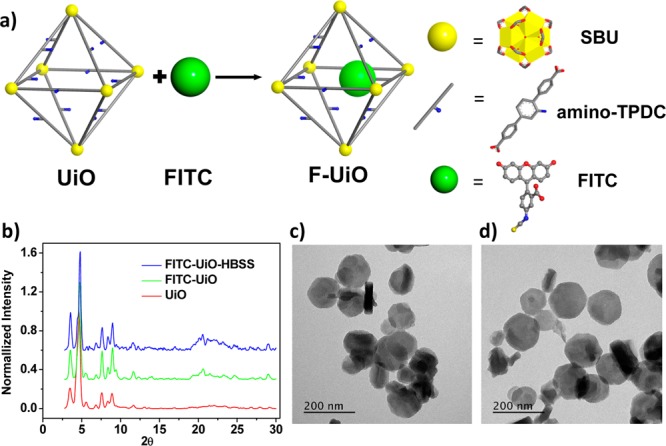
Preparation, characterization, and stability of F-UiO. (a) Schematic presentation of F-UiO synthesis. (b) PXRD patterns of UiO, F-UiO, and F-UiO after incubating in HBSS for 12 h. TEM images showing the morphology of F-UiO (c), and F-UiO after incubating in HBSS for 12 h (d). Bar: 200 nm.
The UiO NMOF with the amino-triphenyldicarboxylic acid (amino-TPDC) bridging ligand was synthesized by heating a dimethylformamide (DMF) solution of ZrCl4 and amino-TPDC at 80 °C for 5 days.28 Transmission electron microscopy (TEM) micrographs showed the hexagonal plate-like morphology of the UiO NMOF and gave a diameter of ∼100 nm and a thickness of ∼30 nm (Figure S1, Supporting Information [SI]). FITC was covalently conjugated to the UiO NMOF to afford F-UiO by forming a thiourea linkage between the isothiocyanate group on FITC and the amino group of the bridging ligand (Figure 1a). 1H NMR spectroscopy and mass spectrometry supported the covalent attachment of FITC to amino-TPDC (Figures S3 and S4). F-UiO retained the hexagonal plate-like morphology and powder X-ray diffraction (PXRD) pattern of the UiO NMOF as shown in Figures 1b,c and S5. Dynamic light scattering (DLS) measurements gave average diameters of 111.8 nm (PDI = 0.140) and 123.2 nm (PDI = 0.135) for UiO and F-UiO, respectively (Figures S2 and S6).
Negligible dye leaching, good structural stability, and high quantum efficiency are key attributes of ideal fluorescence nanosensors. The covalent conjugation of FITC to UiO efficiently prevents the dye leaching. Less than 4.5% of FTIC fluorescence was observed in the supernatant after incubating F-UiO in Hanks’s Balanced Salt Solution (HBSS) for 24 h (Figures S7 and S8).38 After incubating in HBSS for 12 h, F-UiO exhibited unaltered morphology and PXRD patterns (Figures 1b,d, S9, and S10), indicating its structural stability in the media used for pHi sensing.
Low fluorescence efficiency is another common issue for dye-loaded nanosensors, which can be attributed to the insufficient dye loading or self-quenching due to dye aggregation. Typical fluorescence dye loadings in amorphous nanosensors range from 0.1% to 0.5% to avoid self-quenching resulting from dye aggregation.11,39 In contrast, the porous and regular structures of UiO allow exceptionally high dye loadings without dye aggregation (see below).
We evaluated the fluorescence efficiency of F-UiO with a series of FITC loadings to obtain optimal F-UiO for pHi sensing. The FITC loading increased with the FITC feed amount (1, 3, 5, 8, 12, 17, and 30 wt%) and exhibited saturation behaviors when the FITC feed reached 12 wt% (Figures S11–S13). The fluorescence efficiency of F-UiO at different FITC loadings was evaluated by comparing the absorbance of F-UiO at 490 nm (Figures S14 and S15) and the fluorescence intensity of F-UiO at 516 nm (with excitation at 490 nm), respectively. As shown in Figures 2a and S16, the absorbance of F-UiO increased linearly as the FITC loading increased (after subtracting the light scattering of the blank UiO). In contrast, the fluorescence linearly increased as the FITC loading increased up to an FITC loading of ∼7 wt% (corresponding to 8 wt% of feed amount), and then saturated as the FITC loading further increased, suggesting appreciable self-quenching of FITC dyes at >7 wt% loading. For subsequent pHi sensing and imaging studies, we use F-UiO with an FITC loading of 4 wt% to avoid self-quenching of FITC dyes and potential complications from different pH dependence behaviors of dye aggregates.
Figure 2.
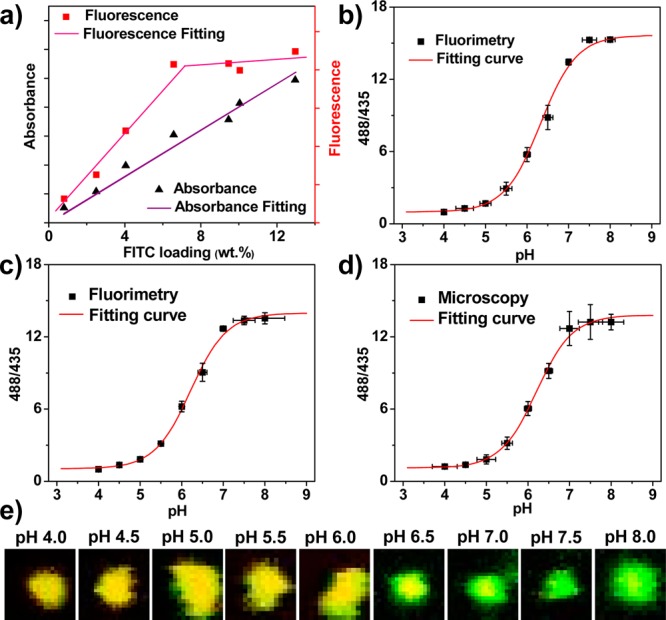
(a) Correlation between FITC absorbance and fluorescence at various FITC loadings. (b–d) pH calibration curves of free FITC (b) and F-UiO acquired by fluorimetry (c) and by CLSM (d). 488/435 in the Y-axis represents I488/520/I435/520. (e) CLSM images showing the overlay of green (488 nm excitation) and red (435 nm excitation) colors of F-UiO particles in HBSS buffers with different pH values.
The ratiometric pH-sensitivity of F-UiO was then determined and compared with free FITC to confirm that F-UiO is an efficient pH sensor with a rapid response. FITC acts as a pH sensor by providing pH-specific ratios of fluorescence intensities at 520 nm when excited at 488 and 435 nm, respectively. pH calibrations for both free FITC solution and F-UiO suspension were carried out in acetate and PBS buffers with pH values ranging from 4.0 to 8.0 by fluorimetry. The 520 nm fluorescence intensity ratios by exciting at 488 and 435 nm (I488/520/I435/520) were calculated, and the correlation of fluorescence intensity ratio r to pH was established by nonlinear curve fitting with the following equations (Figure 2b,c):
| 1 |
| 2 |
where [H+] stands for proton activity in eq 1. P1, P2, and Q1 are fitting parameters. Detailed derivations of these equations are shown in the SI.
Moreover, F-UiO was mixed with HBSS buffers with pH values ranging from 4.0 to 8.0 and subjected to confocal laser scanning microscopy (CLSM) imaging. The images of F-UiO were acquired using dual excitation wavelengths, 488 and 435 nm, and analyzed by ImageJ to quantify the fluorescence intensity of F-UiO particles. A calibration curve was generated using the same fitting method as for the fluorimetric data (Figures 2d,e and S17).
As shown in Figure 2, the pH-dependent changes in the I488/520/I435/520 ratios remain the same for free FITC and F-UiO, indicating that the FITC sensing function was completely preserved in F-UiO. The open channels of F-UiO facilitate the rapid and free diffusion of hydronium ions, allowing the rapid pH response of conjugated FITC.36 The pH calibration curves of F-UiO acquired by fluorimetry and CLSM were similar, verifying the validity of the CLSM quantification method for subsequent live cell imaging studies. The pH response of F-UiO exhibits high sensitivity and relatively small deviations at pH = 5.0–7.0, the typical pH range for cell culture media, cytosol, and endocytic compartments. The standard deviations of pH were below 0.2 pH unit in this pH range. Thus, F-UiO represents an excellent nanosensor for sensing pHi and is ideally suited for real-time monitoring of endocytosis of NMOF and endosome maturation.
pH measurements of live cells at fixed pH values were then performed to confirm the validity of the pH calibration curve in vitro. Human non-small cell lung cancer H460 cells were incubated with F-UiO in HBSS for 2 h and then incubated with fresh pH clamping buffers containing 100 μM nigericin and with fixed pH values ranging from 4.0 to 8.0.41 CLSM images were obtained with dual excitation wavelengths, and the I488/520/I435/520 ratios of F-UiO particles inside the cells clamped at different pH values were analyzed by ImageJ (Figure S18). The pH vs I488/520/I435/520 curve shown in Figure S19 fits well with the pH calibration curve presented in Figure 2c, which further validates the pH calibration curves established by both fluorimetry and CLSM.
The endocytosis of F-UiO in H460 cells was investigated. The time-dependent cellular uptake of F-UiO was quantified by inductively coupled plasma-mass spectrometry (ICP-MS). Efficient cellular uptake was observed for F-UiO in the first 30 min of incubation (Figure 3a). No significant difference was noticed between the uptake amounts after incubating for 30 and 120 min, indicating rapid internalization of F-UiO.
Figure 3.
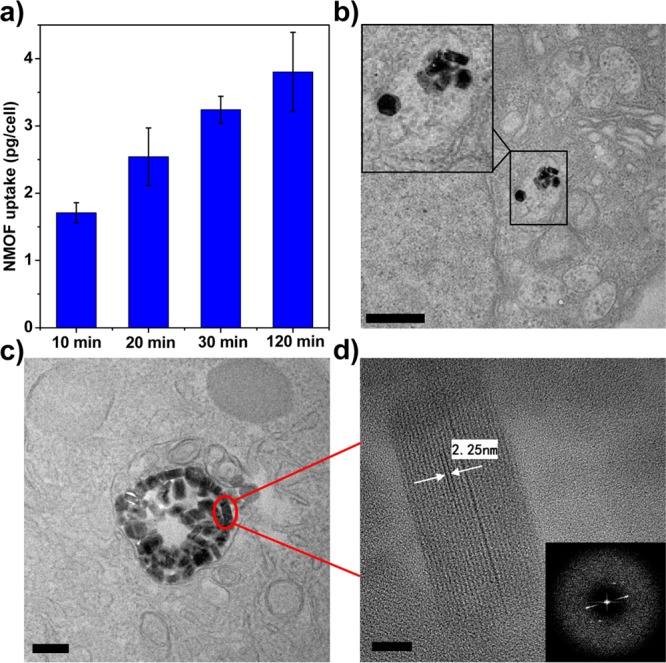
Cellular uptake and intracellular distribution of F-UiO in H460 cells. (a) Time-dependent cellular uptake of F-UiO in H460 cells determined by ICP-MS. (b–d) High-resolution TEM image showing the distribution and structural integrity of UiO NMOFs in the endosomes. Inset in (b) is a zoomed-in view showing the UiO inside one endosome. (d) Zoomed-in view showing the UiO NMOF marked by red circle in (c). Inset in (d) is the FFT image showing the electron diffraction pattern of (d). Bar represents 600, 200, and 20 nm in (b)–(d), respectively.
The intracellular distribution and stability of UiO NMOFs were directly observed by TEM (Figures 3b–d and S20). Upon entering the cells, UiO NMOFs were distributed in the endosomes and maintained the structural integrity (hexagonal plate-like structure) inside the endosomes. UiO lattice fringes are clearly visible for endosome-trapped particles. The distance between lattice fringes was measured to be 2.25 nm (Figure 3d), in agreement with the d110 value of 2.26 nm for the UiO structure. Fast Fourier Transform (FFT) analysis of the endosome-trapped UiO NMOFs gave an electron diffraction pattern that is consistent with that of pristine UiO NMOF (Figure 3d), confirming that UiO NMOFs remain crystalline inside endosomes. These results collectively demonstrate that F-UiO is a reliable pHi sensor owing to its efficient endocytosis and adequate stability inside cells.
The luminal pH of endocytic organelles is acidic, and acidification constitutes an important part of endosome maturation.42 Endosome maturation can be completed within 30 min, with the pH dropping from ∼6.8 (early endosome) to ∼5.0 (late endosome).1,42 Because of the high sensitivity of F-UiO in sensing pH ranging from 5.0 to 7.0 and its rapid and efficient endocytosis, we surmised that F-UiO would be able to reveal the endosome acidification process and its own intracellular fate. Live cell imaging was thus performed to monitor the endocytosis of F-UiO (Figure 4). Images were acquired every 20 s using dual excitation wavelengths (488 and 435 nm). The internalized F-UiO particles were tracked, and the 488/435 fluorescence intensity ratios were quantified by ImageJ. The pH of each individual endosome with F-UiO entrapment was calculated using the pH calibration curve of F-UiO obtained by CLSM (Figure 2c) and plotted against time. F-UiO particles shown in region of interest (ROI) 1 and ROI 2 in Figure 4a and video 1 (SI) were stuck on the cell membrane and were not internalized into the cells as evidenced by the orthogonal view obtained from the Z-stack series (Figure S21); the pH of these F-UiO particles remained constant at ∼6.8–7.0 over time (Figure 4c). The pH values of ROI 3 and ROI 4 in video 1 and ROI 3 in video 2 dropped from ∼6.6–6.8 to ∼5.3–5.5 (Figure 4c), suggesting that these F-UiO particles were entrapped in endosomes and experienced endosome maturation. Interestingly, we also observed exocytosis of F-UiO: ROI 1 in Figure 4b and video 2 (SI) did not show significant acidification in the first 300 s, and the F-UiO particles were recycled back to the cell membrane and underwent exocytosis in 300 s. Five individual F-UiO particles were observed after exocytosis, likely from one single endosome. Additionally, the pH of ROI 1 in Figure 4b and video 2 (SI) was about 6.5 before exocytosis (Figure 4d), which was consistent with the pH for typical recycling endosomes (pH 6.5). ROI 2 in Figure 4b and video 2 also experienced exocytosis after about 500 s, and its pH remained at ∼6.5 (Figure 4d). These results suggest that sufficient endosome acidification is necessary for intracellular trafficking of NMOFs. In the absence of the acidification process, NMOFs undergo exocytosis mediated by recycling endosomes.1
Figure 4.
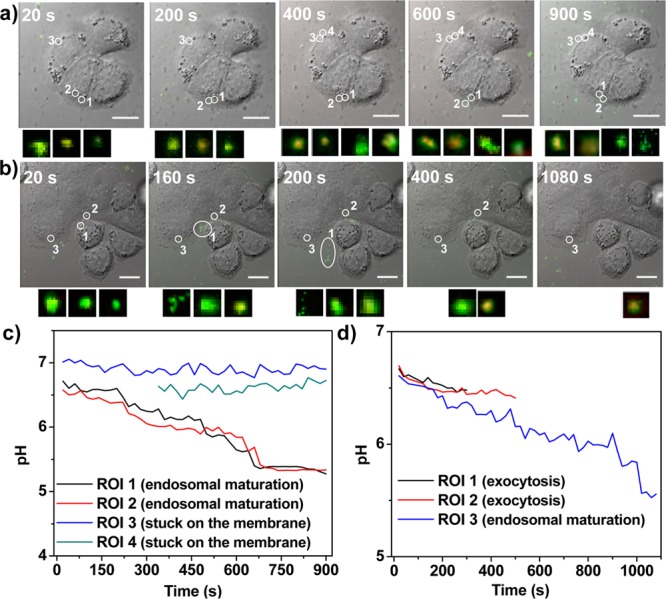
Time relapse pH changes in individual endosomes. (a,b) CLSM images shown are overlays of DIC, green (488 nm excitation), and red (435 nm excitation). Each ROI was labeled with white circle and number. Small images showing under each CLSM image are zoomed-in views of overlays of green (488 nm excitation) and red (435 nm excitation) for each ROI. The small images represent ROI 1 to ROI 4 (a, video 1 in SI) or ROI 1 to ROI 3 (b, video 2 in SI) from left to right. Bar: 10 μm. (c,d) The pH evolution curve of each ROI was obtained by fitting the I488/520/I435/520 with the calibration curve. (c) and (d) were generated from (a) and (b), respectively.
We also performed pHi measurements on fixed cells that had been incubated with F-UiO. The cells were incubated with F-UiO for 5–20 min, fixed, and subjected to CLSM observation. The pH values of individual endosome in cells incubated with F-UiO for different time periods were analyzed to provide histograms showing the numbers of endosomes of different pH values (Figures S22–S24). The endosome maturation evolved over time, with the peak pH decreasing from 6.4 at 5 min to 5.6 at 20 min, consistent with previously reported endosome maturation processes.42
In conclusion, we report the first example of NMOFs for real-time intracellular pH sensing in live cells. FITC conjugated UiO NMOFs exhibited desired structural stability, fluorescence efficiency, pH response sensitivity, and efficient cellular uptake. By combining all these advantages of F-UiO, this novel fluorescence nanosensor provides a reliable and accurate method for real-time intracellular pH sensing. Additionally, the present study also offers the first insight into the endocytosis and intracellular trafficking process of NMOFs.
Acknowledgments
We thank the NIH (UO1-CA151455) for funding support. We appreciate Dr. Vytas Bindokas’s help with the live cell imaging and Christopher Poon’s help with the ICP-MS analysis.
Supporting Information Available
Experimental details for the synthesis and characterization of F-UiO, pH calibration and fitting, cellular uptake, live cell imaging, and data analysis. This material is available free of charge via the Internet at http://pubs.acs.org.
Author Contributions
† C.H. and K.L. contributed equally.
The authors declare no competing financial interest.
Funding Statement
National Institutes of Health, United States
Supplementary Material
References
- a Casey J. R.; Grinstein S.; Orlowski J. Nat. Rev. Mol. Cell Biol. 2010, 11, 50. [DOI] [PubMed] [Google Scholar]; b Webb B. A.; Chimenti M.; Jacobson M. P.; Barber D. L. Nat. Rev. Cancer 2011, 11, 671. [DOI] [PubMed] [Google Scholar]
- Paroutis P.; Touret N.; Grinstein S. Physiology 2004, 19, 207. [DOI] [PubMed] [Google Scholar]
- a Loiselle F. B.; Casey J. R. Membrane Transporters in Drug Discovery and Development: Methods and Protocols 2010, 637, 311. [DOI] [PubMed] [Google Scholar]; b Wray S. Am. J. Physiol. 1988, 254, C213. [DOI] [PubMed] [Google Scholar]; c Modi S.; Swetha M. G.; Goswami D.; Gupta G. D.; Mayor S.; Krishnan Y. Nat. Nanotechnol. 2009, 4, 325. [DOI] [PubMed] [Google Scholar]
- Han J. Y.; Burgess K. Chem. Rev. 2010, 110, 2709. [DOI] [PubMed] [Google Scholar]
- Charier S.; Ruel O.; Baudin J. B.; Alcor D.; Allemand J. F.; Meglio A.; Jullien L. Angew. Chem., Int. Ed. 2004, 43, 4785. [DOI] [PubMed] [Google Scholar]
- Clark H. A.; Kopelman R.; Tjalkens R.; Philbert M. A. Anal. Chem. 1999, 71, 4837. [DOI] [PubMed] [Google Scholar]
- a Benjaminsen R. V.; Sun H. H.; Henriksen J. R.; Christensen N. M.; Almdal K.; Andresen T. L. ACS Nano 2011, 5, 5864. [DOI] [PubMed] [Google Scholar]; b Chen S. J.; Hong Y. N.; Liu Y.; Liu J. Z.; Leung C. W. T.; Li M.; Kwok R. T. K.; Zhao E. G.; Lam J. W. Y.; Yu Y.; Tang B. Z. J. Am. Chem. Soc. 2013, 135, 4926. [DOI] [PubMed] [Google Scholar]; c Patrick M. J.; Janjic J. M.; Teng H. B.; O’Hear M. R.; Brown C. W.; Stokum J. A.; Schmidt B. F.; Ahrens E. T.; Waggoner A. S. J. Am. Chem. Soc. 2013, 135, 18445. [DOI] [PMC free article] [PubMed] [Google Scholar]; d Doussineau T.; Smaihi M.; Mohr G. J. Adv. Funct. Mater. 2009, 19, 117. [Google Scholar]; e Medintz I. L.; Stewart M. H.; Trammell S. A.; Susumu K.; Delehanty J. B.; Mei B. C.; Melinger J. S.; Blanco-Canosa J. B.; Dawson P. E.; Mattoussi H. Nat. Mater. 2010, 9, 676. [DOI] [PubMed] [Google Scholar]; f Wang X. D.; Stolwijk J. A.; Lang T.; Sperber M.; Meier R. J.; Wegener J.; Wolfbeis O. S. J. Am. Chem. Soc. 2012, 134, 17011. [DOI] [PubMed] [Google Scholar]
- a Jiang H. L.; Feng D. W.; Wang K. C.; Gu Z. Y.; Wei Z. W.; Chen Y. P.; Zhou H. C. J. Am. Chem. Soc. 2013, 135, 13934. [DOI] [PubMed] [Google Scholar]; b Liu D.; Lu K.; Poon C.; Lin W. Inorg. Chem. 2014, 53, 1916. [DOI] [PMC free article] [PubMed] [Google Scholar]; c Rao X. T.; Song T.; Gao J. K.; Cui Y. J.; Yang Y.; Wu C. D.; Chen B. L.; Qian G. D. J. Am. Chem. Soc. 2013, 135, 15559. [DOI] [PubMed] [Google Scholar]; d Rieter W. J.; Taylor K. M. L.; Lin W. J. Am. Chem. Soc. 2007, 129, 9852. [DOI] [PMC free article] [PubMed] [Google Scholar]; e Xie Z. G.; Ma L.; deKrafft K. E.; Jin A.; Lin W. J. Am. Chem. Soc. 2010, 132, 922. [DOI] [PubMed] [Google Scholar]; f Wanderley M. M.; Wang C.; Wu C. D.; Lin W. J. Am. Chem. Soc. 2012, 134, 9050. [DOI] [PubMed] [Google Scholar]; g Harbuzaru B. V.; Corma A.; Rey F.; Jorda J. L.; Ananias D.; Carlos L. D.; Rocha J. Angew. Chem., Int. Ed. 2009, 48, 6476. [DOI] [PubMed] [Google Scholar]; h Hirai K.; Sumida K.; Meilikhov M.; Louvain N.; Nakahama M.; Uehara H.; Kitagawa S.; Furukawa S. J. Mater. Chem. C 2014, 2, 3336. [Google Scholar]; i Beauvais L. G.; Shores M. P.; Long J. R. J. Am. Chem. Soc. 2000, 122, 2763. [DOI] [PubMed] [Google Scholar]; j Lu G.; Farha O. K.; Kreno L. E.; Schoenecker P. M.; Walton K. S.; Van Duyne R. P.; Hupp J. T. Adv. Mater. 2011, 23, 4449. [DOI] [PubMed] [Google Scholar]; k Yoon M.; Srirambalaji R.; Kim K. Chem. Rev. 2012, 112, 1196. [DOI] [PubMed] [Google Scholar]
- a Horcajada P.; Chalati T.; Serre C.; Gillet B.; Sebrie C.; Baati T.; Eubank J. F.; Heurtaux D.; Clayette P.; Kreuz C.; Chang J. S.; Hwang Y. K.; Marsaud V.; Bories P. N.; Cynober L.; Gil S.; Ferey G.; Couvreur P.; Gref R. Nat. Mater. 2010, 9, 172. [DOI] [PubMed] [Google Scholar]; b He C.; Lu K.; Liu D.; Lin W. J. Am. Chem. Soc. 2014, 136, 5181. [DOI] [PMC free article] [PubMed] [Google Scholar]; c Morris W.; Briley W. E.; Auyeung E.; Cabezas M. D.; Mirkin C. A. J. Am. Chem. Soc. 2014, 136, 7261. [DOI] [PubMed] [Google Scholar]; d Della Rocca J.; Liu D.; Lin W. Acc. Chem. Res. 2011, 44, 957. [DOI] [PMC free article] [PubMed] [Google Scholar]; e Zhuang J.; Kuo C. H.; Chou L. Y.; Liu D. Y.; Weerapana E.; Tsung C. K. ACS Nano 2014, 8, 2812. [DOI] [PubMed] [Google Scholar]; f Harding J. L.; Reynolds M. M. J. Mater. Chem. B 2014, 2, 2530. [DOI] [PubMed] [Google Scholar]; g Hinks N. J.; McKinlay A. C.; Xiao B.; Wheatley P. S.; Morris R. E. Micropor. Mesopor. Mater. 2010, 129, 330. [Google Scholar]
- Lanz Edvard G. M.; Slavik J.; Kotyk A. J. Fluoresc. 1997, 7, 3. [Google Scholar]
- Bradley M.; Alexander L.; Duncan K.; Chennaoui M.; Jones A. C.; Sanchez-Martin R. M. Bioorg. Med. Chem. Lett. 2008, 18, 313. [DOI] [PubMed] [Google Scholar]
- a Rowsell J. L. C.; Yaghi O. M. Angew. Chem., Int. Ed. 2005, 44, 4670. [DOI] [PubMed] [Google Scholar]; b Yang Q. Y.; Zhong C. L. J. Phys. Chem. B 2005, 109, 11862. [DOI] [PubMed] [Google Scholar]
- Sun H.; Scharff-Poulsen A. M.; Gu H.; Almdal K. Chem. Mater. 2006, 18, 3381. [Google Scholar]
- a Peng H. S.; Stolwijk J. A.; Sun L. N.; Wegener J.; Wolfbeis O. S. Angew. Chem., Int. Ed. 2010, 49, 4246. [DOI] [PubMed] [Google Scholar]; b Akers W. J.; Kim C.; Berezin M.; Guo K.; Fuhrhop R.; Lanza G. M.; Fischer G. M.; Daltrozzo E.; Zumbusch A.; Cai X.; Wang L. V.; Achilefu S. ACS Nano 2011, 5, 173. [DOI] [PMC free article] [PubMed] [Google Scholar]
- Bright G. R.; Fisher G. W.; Rogowska J.; Taylor D. L. J. Cell Biol. 1987, 104, 1019. [DOI] [PMC free article] [PubMed] [Google Scholar]
- Huotari J.; Helenius A. EMBO J. 2011, 30, 3481. [DOI] [PMC free article] [PubMed] [Google Scholar]
Associated Data
This section collects any data citations, data availability statements, or supplementary materials included in this article.


