

Abstract
Metabolic chemical reporters (MCRs) of glycosylation are analogues of monosaccharides that contain bioorthogonal functionalities and enable the direct visualization and identification of glycoproteins from living cells. Each MCR was initially thought to report on specific types of glycosylation. We and others have demonstrated that several MCRs are metabolically transformed and enter multiple glycosylation pathways. Therefore, the development of selective MCRs remains a key unmet goal. We demonstrate here that 6-azido-6-deoxy-N-acetyl-glucosamine (6AzGlcNAc) is a specific MCR for O-GlcNAcylated proteins. Biochemical analysis and comparative proteomics with 6AzGlcNAc, N-azidoacetyl-glucosamine (GlcNAz), and N-azidoacetyl-galactosamine (GalNAz) revealed that 6AzGlcNAc exclusively labels intracellular proteins, while GlcNAz and GalNAz are incorporated into a combination of intracellular and extracellular/lumenal glycoproteins. Notably, 6AzGlcNAc cannot be biosynthetically transformed into the corresponding UDP sugar-donor by the canonical salvage-pathway that requires phosphorylation at the 6-hydroxyl. In vitro experiments showed that 6AzGlcNAc can bypass this roadblock through direct phosphorylation of its 1-hydroxyl by the enzyme phosphoacetylglucosamine mutase (AGM1). Taken together, 6AzGlcNAc enables the specific analysis of O-GlcNAcylated proteins, and these results suggest that specific MCRs for other types of glycosylation can be developed. Additionally, our data demonstrate that cells are equipped with a somewhat unappreciated metabolic flexibility with important implications for the biosynthesis of natural and unnatural carbohydrates.
Introduction
There are three common types of protein glycosylation that modify large numbers of protein substrates in mammalian cells. Proteins localized to the secretory pathway and the cell surface or secreted into the extracellular space can be modified by oligosaccharide structures, such as N-linked glycosylation (linked through asparagine) or mucin O-linked glycosylation (linked through serine and threonine). Additionally, cytoplasmic, nuclear, and mitochondrial proteins can be substrates for the addition of the single monosaccharide N-acetyl-glucosamine, termed O-GlcNAc modification (O-GlcNAcylation, linked through serine and threonine).1−4 Unlike other forms of glycosylation, O-GlcNAcylation is dynamic. It is added to protein substrates by one of three isoforms of O-GlcNAc transferase (OGT) and removed by two isoforms of O-GlcNAcase (OGA).5 The expression of these enzymes is also required for embryonic development in mice and Drosophila.(6−8)O-GlcNAc modification displays significant crosstalk with other posttranslational modifications (PTMs), most significantly phosphorylation and ubiquitination, setting up O-GlcNAcylation as a key regulator of cellular pathways.9 A wide variety of proteins have been shown to be O-GlcNAc modified, including regulators of transcription and translation, cytoskeletal proteins, signaling proteins, and metabolic enzymes. The specific consequences of most of these modifications are unknown; however, limited biochemical analyses demonstrate that O-GlcNAc modification can change protein localization, stability, molecular interactions, and activity. Critically, O-GlcNAcylation is also misregulated in Alzheimer’s disease and cancer. For example, in neurodegenerative disorders such as Alzheimer’s disease, O-GlcNAcylation levels are diminished directly leading to protein aggregation and cell death,10 and we have demonstrated that it likely plays a similar role in Parkinson’s disease.11 Finally, higher levels of O-GlcNAc modification are a common feature of many cancers and are necessary for tumorigenesis and proliferation.12−15
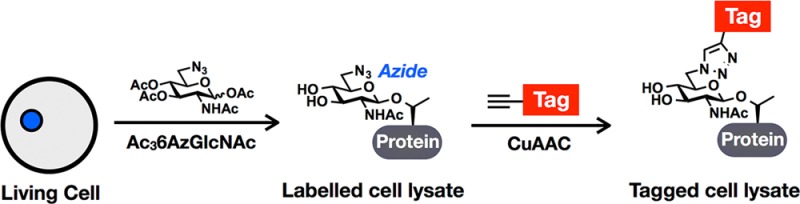
To identify and characterize O-GlcNAc modifications, complementary chemical methods have been developed.16,17 In general, these technologies take advantage of bioorthogonal chemistries, such as the copper(I)-catalyzed azide–alkyne cycloaddition (CuAAC or “click chemistry”, Figure 1A).18−21 This reaction relies upon small, abiotic chemical reporters (azides and alkynes) that can be selectively reacted with alkyne- and azido-probes, respectively, for the installation of visualization and affinity tags. One of these methods, initiated by the Bertozzi laboratory, takes advantage of monosaccharide analogues that directly incorporate azides or alkynes into their structures.22 These analogues, termed metabolic chemical reporters (MCRs),23 are taken up by cells through carbohydrate salvage pathways and subsequently feed into the biosynthesis of nucleotide sugar-donors for use by glycosyltransferases. For example, the first O-GlcNAc-targeted MCR, N-azidoacetyl-glucosamine (GlcNAz, Figure 1B), has been used for the visualization and proteomic identification of labeled proteins.24−26 Unlike other methods (e.g., Western blotting), MCRs do not necessarily read-out on endogenous levels of O-GlcNAcylation, as they must compete with GlcNAc in the cell. However, because they must be metabolically transformed before their incorporation onto proteins, they not only report on O-GlcNAc modification but also on the integration of upstream metabolic pathways. Additionally, they can be used much like radioactivity to isolate new modification events and subsequent rates of removal in pulse and pulse-chase labeling experiments. Despite the clear utility of this technology, the previous iterations have limitations. Until recently, GlcNAz and other MCRs were presumed to label only one type of glycosylation (i.e., GlcNAz treatment results in O-GlcNAcylation labeling), but several enzymatic pathways exist that can interconvert different monosaccharides, raising the possibility that MCRs are converted in the same manner.27 Upon careful characterization, it was demonstrated that GlcNAz can be readily transformed to N-azidoacetyl-galactosamine (GalNAz, Figure 1B) and vice versa, resulting in the labeling of both O-GlcNAcylated and mucin O-linked glycosylated proteins.26−29 Furthermore, we showed that GlcNAz treatment leads to labeling of N-linked glycosylation.26 This can be overcome using cellular fractionation;29 however, since we have complete chemical control over the MCR, we predicted that structural alterations can limit this “off-target” labeling and produce an O-GlcNAcylation-specific reporter. Indeed, we previously demonstrated that an alternative MCR, N-pentynyl-glucosamine (GlcNAlk), which contains a larger functional group at the N-acetyl position, is not converted to the galactosamine derivative and therefore could not label mucin O-linked glycoproteins.26 Unfortunately, GlcNAlk was still incorporated into N-linked glycans, preventing its use as a completely selective O-GlcNAcylation reporter.
Figure 1.
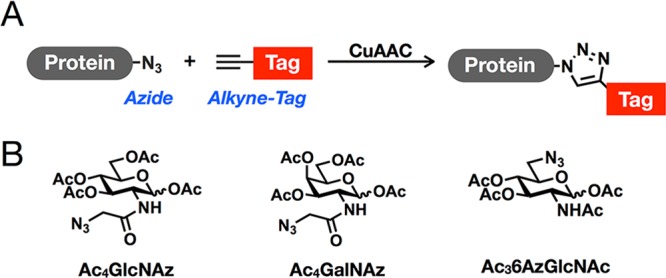
Metabolic chemical reporters (MCRs). (A) Copper(I)-catalyzed azide–alkyne cycloaddition (CuAAC). (B) Peracetylated MCRs used in this study.
We report here the development and application of 6-azido-6-deoxy-N-acetyl-glucosamine (6AzGlcNAc, Figure 1B and Scheme S1 and Figure S7 in Supporting Information (SI)) as a MCR in living cells. Cellular analysis of this MCR using CuAAC and fluorescent probes demonstrated that, unlike previous reporters, it is highly selective for O-GlcNAcylated proteins, allowing for the robust visualization of O-GlcNAc modifications using in-gel fluorescence scanning. Furthermore, comparative proteomics using 6AzGlcNAc, GlcNAz, and GalNAz confirmed the specificity of 6AzGlcNAc toward O-GlcNAc modifications. 6AzGlcNAc-labeling resulted in the enrichment of zero proteins, out of 367, which are annotated to have exclusively extracellular or lumenal localization. In contrast, GlcNAz and GalNAz identified 9 and 72 such proteins, respectively. Finally, we also demonstrate that 6AzGlcNAc can bypass an assumed biosynthetic roadblock by being phosphorylated by the enzyme phosphoacetylglucosamine mutase.
Results and Discussion
6AzGlcNAc Is a Robust Metabolic Chemical Reporter in Living Cells
Our previous data using MCRs demonstrated that even small alterations in chemical structure can have dramatic effects on the distribution of chemical reporters into different types of glycosylation.26,30 Therefore, to find a specific MCR of O-GlcNAcylation, we synthesized a small panel of O-acetylated N-acetyl-glucosamine analogues bearing azides at different positions; the acetate protecting-groups allow diffusion across the cell membrane and are subsequently removed by endogenous lipases/hydrolases. NIH3T3 cells were treated with these compounds at 200 μM concentrations for 16 h, followed by lysis, CuAAC with an alkyne-containing rhodamine dye (alk-rho), and analysis by in-gel fluorescent scanning. One of these compounds, Ac36AzGlcNAc (Figure 1B), gave a protein-labeling pattern that was subjectively similar in both intensity and pattern to Ac4GlcNAz (Figure 2A).
Figure 2.

Ac36AzGlcNAc labels proteins in living cells. (A) NIH3T3 cells were treated with Ac4GlcNAz (200 μM), Ac36AzGlcNAc (200 μM), or DMSO vehicle for 16 h, followed by CuAAC and analysis by in-gel fluorescence scanning. (B) NIH3T3 cells were treated with varying concentrations of Ac4GlcNAz or Ac36AzGlcNAc for 16 h, followed by CuAAC and analysis by in-gel fluorescence scanning. (C) NIH3T3 cells were treated with Ac36AzGlcNAc (200 μM), or DMSO vehicle for the times indicated and were tested for toxicity using an MTS assay. (D) Proteins modified by 6AzGlcNAc were enriched from NIH3T3 cells treated with Ac36AzGlcNAc (200 μM) or DMSO vehicle using CuAAC with alkyne-azo-biotin and analyzed by Western blotting. Error bars represent ± SEM from three biological replicates.
To further characterize this MCR, NIH3T3 cells were treated with various concentrations of Ac36AzGlcNAc or Ac4GlcNAz for 16 h before reaction with alk-rho. In-gel fluorescence scanning revealed labeling of a wide-range of proteins in concentrations as low as 50 μM and maximal labeling achieved at approximately 200 μM (Figure 2B), consistent with our other MCRs of glycosylation.26,30,31 To examine the toxicity of Ac36AzGlcNAc, the viability of NIH3T3 cells was measured after treatment with 200 μM Ac36AzGlcNAc for 16 or 72 h using a MTS cell-proliferation assay. Only minimal loss of cell growth/survival was seen even after 72 h of treatment (Figure 2C). To determine if 6AzGlcNAc could report on O-GlcNAc modifications, we treated NIH3T3 cells with Ac36AzGlcNAc (200 μM) for 16 h. The cells were then lysed and reacted with an alkyne-containing cleavable affinity tag (alk-azo-biotin, Scheme S2 and Figures S8–S12 (SI)) using CuAAC. Labeled proteins were enriched using streptavidin beads before elution with sodium dithionite. Enriched proteins were then subjected to Western blotting using antibodies against the known O-GlcNAc modified proteins NEDD4,26,32 pyruvate kinase,26 and nucleoporin 62 (nup62).33 All three proteins were selectively enriched using 6AzGlcNAc (Figure 2D and Figure S1 (SI)), showing that the MCR does label known O-GlcNAcylated proteins.
6AzGlcNAc Is Metabolically Incorporated by Bypassing GlcNAc-6-Kinase
MCRs are enzymatically transformed into their nucleotide sugar-donors by monosaccharide salvage pathways. Previous O-GlcNAc MCRs are thought to largely utilize the GlcNAc salvage pathway (Figure S2A (SI)).24 The first step of this pathway is the phosphorylation of MCRs at the 6-position of the carbohydrate ring by N-acetylglucosamine kinase (GNK). This is followed by enzymatic mutation of the phosphate to the 1-position and conversion to the uridine-diphosphate (UDP) sugar donor by N-acetylglucosamine-phosphate mutase (AGM1) and uridine-diphosphate-N-acetylglucosamine pyrophosphorylase (AGX1/2), respectively. Although UDP-6AzGlcNAc is known to be accepted by OGT,34 6AzGlcNAc cannot be phosphorylated at the 6-position, as we have replaced the 6-hydroxyl functionality with an azide. Therefore, we first took a candidate-based approach to identify a kinase that could directly phosphorylated 6AzGlcNAc at the 1-position and chose N-acetyl-galactosamine kinase (GalK2), which performs this reaction on N-acetylgalactosamine (GalNAc) and poorly on GlcNAc.35 To test this possibility, NIH3T3 cells were stably transformed with five different short-hairpin RNA vectors targeting GalK2 using retroviral infection and then treated with Ac36AzGlcNAc (200 μM) for 16 h. Subsequent CuAAC with alk-rho and in-gel fluorescent scanning showed no loss of fluorescent signal, despite a clear reduction of GalK2 mRNA as measured by semiquantitative RT-PCR (Figure S3 (SI)), suggesting that GalK2 is not the enzyme responsible for 6AzGlcNAc metabolism. To confirm this result, we subjected 6AzGlcNAc (Scheme S3A and Figures S13–S15 (SI) for details of synthesis and characterization) to in vitro phosphorylation by recombinant GalK2.36 Specifically, GalK2 was incubated with 40 mM concentrations of GalNAc, GlcNAc, or 6AzGlcNAc and [32P]γATP (5 mM). At these elevated substrate-concentrations, GalK2 readily phosphorylated both GalNAc and GlcNAc but gave no detectable modification of 6AzGlcNAc (Figure 3A). Next, we tested whether phosphoacetylglucosamine mutase (AGM1) could directly generate 6AzGlcNAc-1-phosphate. AGM1 typically converts GlcNAc-6-phosphate to GlcNAc-1-phosphate during the biosynthesis of UDP-GlcNAc. As part of its enzymatic cycle, AGM1 removes the 6-phosphate from substrate sugars, resulting in a phosphoenzyme intermediate (Figure 3B).37 Therefore, once loaded, phosphorylated AGM1 might be capable of phosphorylating 6AzGlcNAc. To test this possibility, human AGM1 was heterologously expressed in Escherichia coli and purified. The enzyme was then incubated with 6AzGlcNAc (2.25 mM) with or without different “cofactors” that could generate phosphorylated AGM1, specifically glucose-6-phosphate or glucose-1,6-bisphosphate or GlcNAc-6-phosphate (all at 1 mM). To isolate any 6AzGlcNAc-1-phosphate that had been produced, the enzymatic reactions were first subjected to copper-free click chemistry with a fluorescein-conjugated cyclooctyne tag. Fluorescein-labeled compounds (i.e., 6AzGlcNAc and 6AzGlcNAc-1-phosphate) were then separated from the phosphorylated-cofactors by paper chromatography. Finally, any fluorescent-spots were eluted and analyzed by mass spectrometry (LC–MS, Figure S4 (SI)). Incubation of AGM1 with 6AzGlcNAc alone, or with glucose-6-phosphate or glucose-1,6-bisphosphate, resulted in no detectable formation of 6AzGlcNAc-1-phosphate. However, in the presence of GlcNAc-6-phosphate as a cofactor, the formation of 6AzGlcNAc-1-phosphate was unambiguously detected. This demonstrates that direct phosphorylation of 6AzGlcNAc by AGM1 represents one pathway that circumvents the GNK biosynthetic-roadblock. However, because the conversion is very low (<1% conversion to product based on ion-intensities in ESI-MS), AGM1 may not be the only enzyme that can produce 6AzGlcNAc-1-phosphate in living cells. We next analyzed the final enzyme in the biosynthetic pathway, UDP-N-acetylhexosamine pyrophosphorylase (AGX1), by first synthesizing 6AzGlcNAc-1-phosphate (Scheme S3B and Figures S16–S30 (SI) for synthetic details and characterization). Recombinant AGX1 was then incubated with different concentrations of GlcNAc-1-phosphate or 6AzGlcNAc-1-phosphate and [3H]UTP. Subsequent Michaelis–Menten kinetic analysis demonstrated that 6AzGlcNAc-1-phosphate is a substrate of AGX1, although at a significantly lower efficiency than GlcNAc-1-phosphate (Figure 3C). Taken together, these data suggest that in living cells 6AzGlcNAc can be directly phosphorylated by AGM1 and enter the remainder of the GlcNAc salvage pathway to generate UDP-6AzGlcNAc (Figure S2B (SI)).
Figure 3.
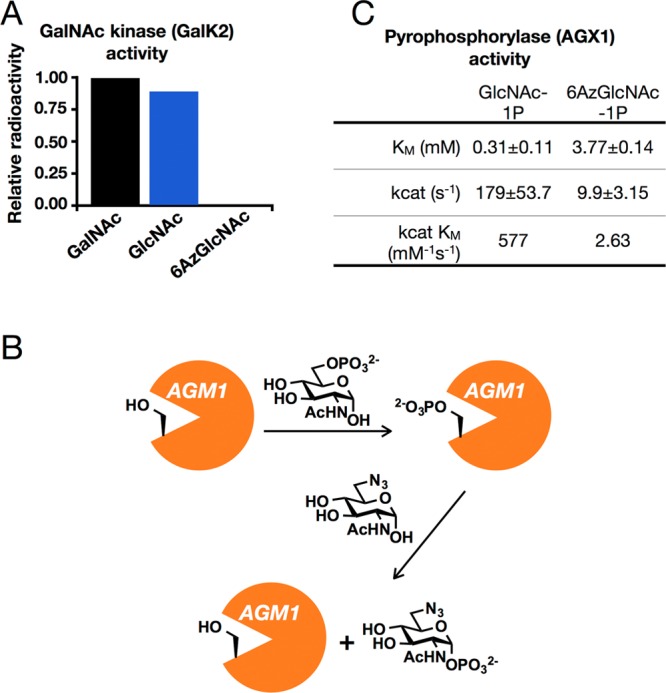
Investigation of 6AzGlcNAc metabolism. (A) The indicated monosaccharides (40 mM concentration) were tested as substrates for purified GalK2 in vitro. (B) Proposed mechanism by which AGM1 directly phosphorylates 6AzGlcNAc in the presence of GlcNAc-6-phosphate. (C) Kinetic constants for the enzymatic production of UDP sugar donors from GlcNAc-1-phosphate and 6AzGlcNAc-1-phosphate by the enzyme UDP-N-acetylhexosamine pyrophosphorylase (AGX1).
6AzGlcNAc Is a General and Dynamic Metabolic Chemical Reporter in Living Cells
Next, to explore the generality of 6AzGlcNAc as a MCR, we labeled a panel of different cell lines. Specifically, Cos-7, H1299, HEK293, HeLa, MCF7, mouse embryonic fibroblasts (MEFS), and NIH3T3 cells were treated with Ac36AzGlcNAc (200 μM) for 16 h. In-gel fluorescence scanning after CuAAC with alk-rho showed labeling in all the cell lines examined and a diversity of the pattern and intensity of modified proteins (Figure 4). To qualitatively compare 6AzGlcNAc to previous MCRs of O-GlcNAcylation, the same panel of cell lines was treated with 200 μM Ac4GlcNAz or Ac4GalNAz for 16 h (Figure S5 (SI)). In-gel fluorescence scanning showed incorporation of previously characterized MCRs in each cell line with varying intensities and patterns, which were more pronouncedly different for GalNAz, when compared to 6AzGlcNAc and GlcNAz.
Figure 4.
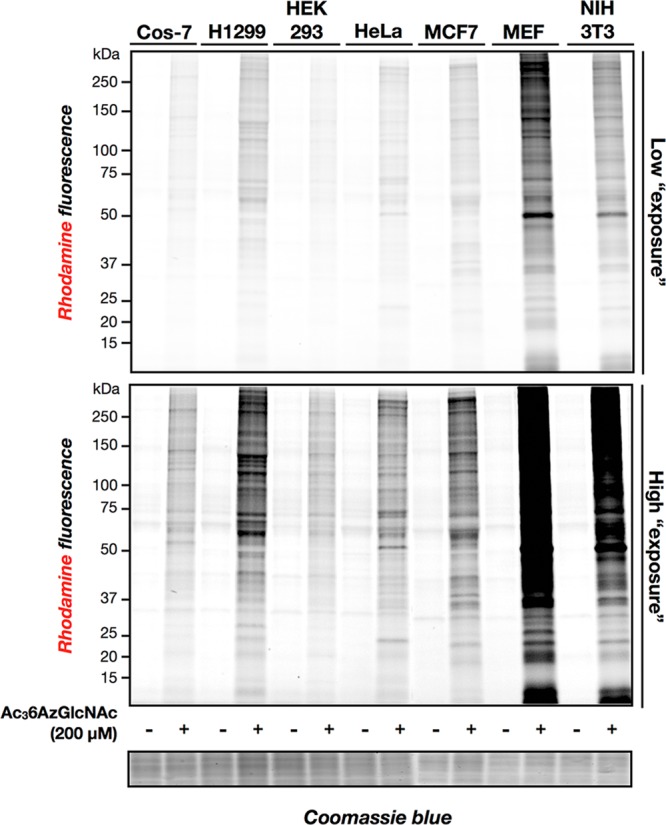
Indicated cell lines were treated with 200 μM Ac36AzGlcNAc for 16 h before modified proteins were subjected to CuAAC with alk-rho and analysis by in-gel fluorescence scanning.
As stated above, MCRs only report on modifications that occur during the labeling time, raising the possibility that they can be used to isolate O-GlcNAcylation events in a short time frame via a pulse-labeling experiment. To determine the kinetics of protein labeling by 6AzGlcNAc, NIH3T3 cells were treated with Ac36AzGlcNAc (200 μM) for different lengths of time. The cells were then lysed, reacted with alk-rho using CuAAC, and analyzed by in-gel fluorescence scanning (Figure 5A). Modified proteins can be clearly visualized over background in 2 to 4 h, slightly slower than the kinetics of protein labeling by Ac4GlcNAz at 200 μM (Figure 5A). MCRs also have the ability to read-out on the turnover of protein modifications using a pulse-chase format. Accordingly, we treated NIH3T3 cells with either Ac36AzGlcNAc or Ac4GlcNAz at concentrations of 200 μM. After 16 h, the cells were washed and fresh media containing Ac4GlcNAc (200 μM) was added. Cells were collected after different lengths of time, lysed, and subjected to CuAAC with alk-rho. In-gel fluorescence scanning showed a steady loss of protein labeling over the course of 48 h (Figure 5B). O-GlcNAcase (OGA) is responsible for the dynamic removal of O-GlcNAc from substrate proteins. To demonstrate that 6AzGlcNAc is incorporated into O-GlcNAcylation and a substrate for OGA, cells were first treated with Ac36AzGlcNAc (200 μM) or DMSO for 5 h. Media was then exchanged for fresh media containing 200 μM Ac4GlcNAc with or without Thiamet-G (10 μM), a potent and highly selective OGA inhibitor.38 After 12 h, cells were harvested and subjected to CuAAC with alk-rho. In-gel fluorescence scanning showed that cells that were treated with Thiamet-G maintained higher levels of 6AzGlcNAc labeling compared to those without (Figure 5C), demonstrating that 6AzGlcNAc is incorporated into O-GlcNAc modifications that can be subsequently removed by OGA.
Figure 5.

Characterization of Ac36AzGlcNAc. (A) NIH3T3 cells were treated with 200 μM Ac36AzGlcNAc or Ac4GlcNAz for the indicated times, followed by CuAAC and analysis by in-gel fluorescence scanning. (B) NIH3T3 cells were treated with 200 μM Ac36AzGlcNAc or Ac4GlcNAz for 16 h, at which time media was exchanged for fresh media containing 200 μM Ac4GlcNAc. Cells were harvested after the indicated lengths of time, subjected to CuAAC, and analyzed by in-gel fluorescence scanning. (C) HeLa cells were treated with 200 μM Ac36AzGlcNAc or Ac4GlcNAz for 5 h, at which time media was exchanged for fresh media containing 200 μM Ac4GlcNAc and 10 μM of the OGA inhibitor Thiamet-G or DMSO. Cells were harvested at the times indicated and subjected to CuAAC before being analyzed by in-gel fluorescence scanning.
6AzGlcNAc Is a Specific Metabolic Chemical Reporter of O-GlcNAc Modification
As noted above, previous MCRs of O-GlcNAcylation are not selective for O-GlcNAc modifications because they are also incorporated into either N-linked or mucin O-linked glycans or both.26,29 To determine if 6AzGlcNAc specifically modifies O-GlcNAcylated proteins, we first took advantage of the chimeric, secreted protein GlyCAM-IgG that contains both an N-linked and multiple mucin O-linked glycosylation sites. NIH3T3 cells that stably express GlyCAM-IgG via retroviral transformation were treated with Ac36AzGlcNAc, Ac4GlcNAz, or Ac4GlcNAc at 200 μM concentrations for 48 h. At this time, GlyCAM-IgG was immunoprecipitated from the media using protein-A-conjugated beads. In-gel fluorescence scanning, following CuAAC with alk-rho, showed that while GlcNAz robustly labels GlyCAM-IgG, as expected based on our previous results,26 6AzGlcNAc does not (Figure 6A and Figure S6A (SI) for the full-gel image). This demonstrates that while GlcNAz does label the major types of cell-surface glycosylation, 6AzGlcNAc does not.
Figure 6.
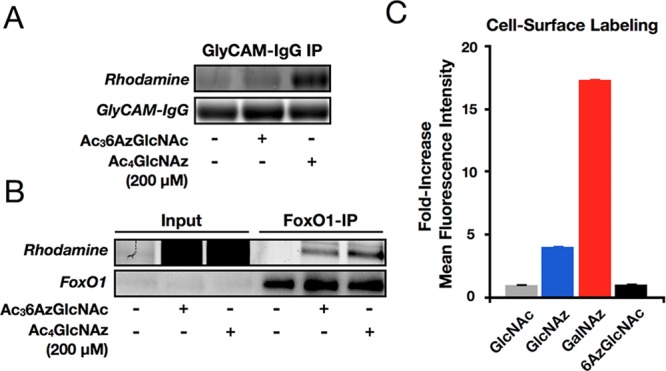
Glycoprotein specificity of 6AzGlcNAc. NIH3T3 cells stably expressing either GlyCAM-IgG (A) or Flag-tagged FoxO1 (B) were treated with the indicated MCRs or Ac4GlcNAc, followed by immunoprecipitation, CuAAC, and analysis by in-gel fluorescence scanning. Data is representative of two independent experiments. (C) NIH3T3 cells were treated with Ac36AzGlcNAc, Ac4GlcNAz, Ac4GalNAz, or Ac4GlcNAc (all at 200 μM) for 16 h, at which time cells were harvested and subjected to copper-free click chemistry with DBCO-biotin. After incubation with FITC-avidin, live-cell surface labeling was analyzed by flow cytometry. Error bars represent ± SEM from three biological replicates.
Next, to confirm that 6AzGlcNAc labels O-GlcNAcylated proteins, we treated NIH3T3 cells that were stably transfected with the FLAG-tagged transcription factor FoxO1 with Ac36AzGlcNAc, Ac4GlcNAz, or Ac4GlcNAc at 200 μM concentrations for 24 h. In contrast to GlyCAM-IgG, in-gel fluorescence showed that both MCRs robustly labeled FoxO1 (Figure 6B and Figure S6B (SI) for the expanded-gel images of replicate experiments), demonstrating that 6AzGlcNAc is a highly selective MCR of O-GlcNAc modifications.
To rule out the possibility that 6AzGlcNAc was excluded from GlyCAM-IgG but labeled other cell-surface glycoproteins, NIH3T3 cells were treated with Ac36AzGlcNAc, Ac4GlcNAz, or Ac4GalNAz at 200 μM for 16 h before being harvested and submitted to copper-free click chemistry using commercially available DBCO-biotin. After subsequent incubation with FITC-conjugated avidin, cell-surface glycoprotein labeling by each chemical reporter was analyzed using flow cytometry. No labeling over background was observed with Ac36AzGlcNAc, while labeling was observed with Ac4GlcNAz and Ac4GalNAz (Figure 6C). Notably, this corroborates live-cell flow cytometry data from the Bertozzi lab where they used the Staudinger ligation to observe some cell-surface labeling with GlcNAz and no labeling with 6AzGlcNAc.39
Direct Comparison of 6AzGlcNAc, GlcNAz, and GalNAz as Metabolic Chemical Reporters of Glycosylation
To identify the proteins labeled by 6AzGlcNAc and compare them to those enriched by the previous MCRs GlcNAz and GalNAz, NIH3T3 cells were treated in triplicate with either Ac36AzGlcNAc, Ac4GlcNAz, Ac4GalNAz, or Ac4GlcNAc as a control (all at 200 μM) for 16 h. At this time cells were lysed using denaturing conditions (4% SDS) and subjected to CuAAC conditions with an alkyne-bearing biotin tag. Equivalent amounts of the differentially labeled proteomes were then reduced, alkylated, and subjected to biotin-enrichment using streptavidin-conjugated beads. After extensive washing to remove unlabeled proteins, on-bead trypsinolysis afforded peptides that were analyzed using LC–MS/MS, identified using Proteome Discoverer and Mascot, and quantified by spectral counting. Labeled proteins were identified as those that met the following threshold criteria: First, proteins must have been identified by at least 1 unique peptide in each of the three data sets and a total of 3 spectral counts in the sum of three replicate data sets. Second, the sum of spectral counts of the MCR-treated samples must be 3-times greater than those in the GlcNAc labeled samples. Finally, the number of spectral counts in the MCR treated sample compared to the control must be statistically significant (p < 0.05, t test). Using these criteria, 366 proteins were identified as being labeled by 6AzGlcNAc (Table S1 (SI)), including many known O-GlcNAcylated proteins, such as the three annotated in black in Figure 6A (MAP4, NEDD4, and HCF1). GlcNAz and GalNAz labeling identified 359 proteins (Table S2 (SI)) and 348 proteins (Table S3 (SI)), respectively. In contrast to 6AzGlcNAc, these lists included both known O-GlcNAcylated proteins and proteins that are exclusively localized to the extracellular space or the lumen of the secretory pathway and lysosome, such as the three annotated in red in Figure 7A (fibronectin, calumenin, and α-glucosidase). Comparison of the three proteomics lists showed that 6AzGlcNAc has greater overlap with GlcNAz than GalNAz (Figure 7B), consistent with with previous studies that show more efficient incorporation of GalNAz versus GlcNAz into cell-surface glycoproteins.39,40 Importantly, many of the proteins that were identified by 6AzGlcNAc have been previously identified in other O-GlcNAc proteomic studies (see Tables S1, S2, and S3 (SI) for references).
Figure 7.

Identification of O-GlcNAcylated proteins using 6AzGlcNAc. (A) NIH3T3 cells were treated with Ac36AzGlcNAc, Ac4GlcNAz, Ac4GalNAz, or Ac4GlcNAc (all at 200 μM) for 16 h. At this time, the corresponding cell-lysates were subjected to CuAAC with alkyne-biotin, enrichment with streptavidin-coated beads, and on-bead trypsinolysis. Proteins identified by LC–MS/MS are graphically presented as total number of positive minus total number of control spectral counts. Three known O-GlcNAcylated proteins are annotated in black, and three known extracellular/lumenal proteins are annotated in red. (B) Overlap between proteins identified using 6AzGlcNAc, GlcNAz and, GalNAz. (C) Graphical representation of enriched proteins based on whether their localization is exclusively intracellular (i.e., cytoplasmic, nuclear, or mitochondrial), exclusively extracellular or lumenal (i.e., ER, Golgi, lysosome), or have domains in both (e.g., transmembrane protein).
We next annotated the proteins in our lists based on their characterized localizations (Figure 7C). Proteins with uncharacterized localizations (Uniprot database) were omitted. Consistent with specific labeling of O-GlcNAcylated proteins, 6AzGlcNAc treatment enriched 350 exclusively intracellular proteins (i.e., nuclear, cytosolic, and mitochondrial) and 9 proteins that can be localized to both the cytosol and extracellular space or lumenal compartments (e.g., transmembrane proteins). In contrast, 9 and 72 exclusively extracellular or lumenal proteins were found using GlcNAz and GalNAz treatment, respectively (Figure 7C), reenforcing the data demonstrating the nonspecific labeling of multiple types of glycosylation by GlcNAz and GalNAz.
Conclusion
The use of MCRs for the visualization and identification of protein glycosylation has expanded the ability to investigate these key posttranslational modifications. However, recent evidence from our lab and others has demonstrated that many MCRs of protein glycosylation lack specificity, as they are incorporated into multiple types of glycans.26,28,29 We previously showed that small changes to the chemical structure of MCRs can have a large impact on their distribution into different glycans.26,30 Following this chemical-optimization theme further, we identified a MCR (6AzGlcNAc) that robustly labeled a variety of proteins in living mammalian cells. Using a fluorescent alkyne tag, we compared 6AzGlcNAc to the previous MCR, GlcNAz, and demonstrated that 6AzGlcNAc is efficiently incorporated onto proteins allowing visualization in as little as 2 to 4 h after treatment (Figure 5A). Furthermore, 6AzGlcNAc removal from proteins is dependent on the activity of OGA, demonstrating that it is dynamically incorporated into O-GlcNAcylated proteins (Figure 5C). Using two reporter proteins, we next showed that while GlcNAz labels both secreted glycoproteins and O-GlcNAcylated proteins, 6AzGlcNAc is specific for O-GlcNAc modifications (Figure 6A and B). This is consistent with our flow cytometry data (Figure 6C) and previous reports that both showed essentially no cell-surface labeling by 6AzGlcNAc and that chemically synthesized UDP-6AzGlcNAc is a substrate for recombinant O-GlcNAc transferase.34,39
Unlike GlcNAz, 6AzGlcNAc cannot be metabolized to the corresponding UDP-sugar donor by the canonical GlcNAc salvage-pathway (Figure S2 (SI)), as the first step involves phosphorylation at the 6-hydroxyl of the monosaccharide. Therefore, an alternative enzyme must directly phosphorylate 6AzGlcNAc at the 1-hydroxyl to bypass this roadblock. Taking a candidate-based approach, we tested GalK2 and AGM1 in vitro to determine if they could generate 6AzGlcNAc-1-phosphate. We did not observe any product formation using GalK2, and knockdown of GalK2 in living cells using shRNA did not result in reduced protein-labeling by 6AzGlcNAc (Figure S3 (SI)). Notably, however, we found that AGM1 is capable of directly generating 6AzGlcNAc-1-phosphate when its normal substrate, GlcNAc-6-phosphate, is added to the reaction mixture (Figures 3B and S4 (SI)).
On the basis of the enzymatic mechanism, we conclude that AGM1 removes the phosphate from GlcNAc-6-phosphate to generate the known phosphoenzyme intermediate,37 followed by binding of 6AzGlcNAc and phosphorylation of the 1-hydroxyl. This is consistent with the reversible nature of AGM1’s activity, where the monosaccharide substrates can bind the active site with either the 1- or 6-hydroxyl groups oriented toward the catalytic serine. However, given the low levels of 6AzGlcNAc turnover by AGM1, it is reasonable to assume that additional enzymes may also phosphorylate 6AzGlcNAc in living cells. Additionally, we also showed that once 6AzGlcNAc-1-phosphate is formed it can be enzymatically transformed to UDP-6AzGlcNAc by AGX1 (Figure 3C). We do not know if UDP-6AzGlcNAc can be epimerized to UDP-6AzGalNAc in cells; however, even if this metabolite is formed, previous studies by Bertozzi and co-workers demonstrated that UDP-6AzGalNAc is not a substrate for the polypeptide-N-acetyl-galactosamine transferases.40 Together, these results suggest an unappreciated metabolic flexibility in mammalian cells. AGM1 and potentially other, yet unidentified, small-molecule phosphotransferases may contribute to the salvaging of natural monosaccharides from the environment. Furthermore, they have potentially important implications for the metabolism of bacterial or abiotic carbohydrates that would otherwise be assumed to not enter mammalian biosynthetic pathways. Finally, our results challenge a dogma in MCR design, which relies on well-established metabolic pathways and directly resulted in the previous dismissal of 6AzGlcNAc as a viable MCR in living cells.34,39
To further confirm the specificity of 6AzGlcNAc and demonstrate any advantages over other MCRs previously used to study O-GlcNAcylated proteins, we performed a proteomics experiment using 6AzGlcNAc, GlcNAz, and GalNAz in combination with alkyne-biotin and on-bead trypsinolysis (Figure 7). We found that enrichment with 6AzGlcNAc resulted in the identification of essentially only intracellular proteins that cannot contain glycans (e.g., N-linked or mucin O-linked) that are added in the secretory pathway. This confirms the high degree of specificity of 6AzGlcNAc for O-GlcNAcylated proteins. Consistent with our fluorescence data, GlcNAz was less selective, resulting in the enrichment of 28 transmembrane proteins and 9 exclusively extracellular or lumenal proteins. Finally, GalNAz was the least selective, since it enriched only 226 exclusively intracellular proteins and 72 proteins that are only extracellular or lumenal. We believe that this lack of selectivity is one reason why a recent study using GalNAz required subcellular fractionation and two-dimensional electrophoresis to identify the potential O-GlcNAcylation of the voltage-dependent anion-selective channel protein 2 (VDAC2), while the same protein was readily identified by 6AzGlcNAc labeling without any biochemical manipulations (Table S1 (SI)). This specificity is an improvement over other MCRs that require biochemical manipulations (e.g., cell fractionation) to exclude cell-surface glycoproteins.29,41
Previous direct comparisons of the selectivity of different glycoprotein MCRs are somewhat limited.26,28−30,39 The Bertozzi lab reported that GalNAz has superior O-GlcNAc labeling efficiency compared to GlcNAz due to more efficient metabolic conversion of GalNAz to UDP-GalNAz and subsequent epimerization to UDP-GlcNAz.29 Our in-gel fluorescence data do not support these data, as GlcNAz and GalNAz resulted in qualitatively similar levels of protein labeling in a variety of cell lines (Figure S5 (SI)). Interestingly, only a minority of cell lines show similar global-patterns of labeling between GlcNAz and GalNAz (e.g., MCF7), while most are significantly different. This also is true of 6AzGlcNAc, which often shows different labeling patterns and intensities from both GlcNAz and GalNAz (Figure 4 and Figure S5 (SI)). This supports our results that each of the MCRs is incorporated into different types of glycoproteins and utilizes independent metabolic enzymes for the generation of the corresponding UDP donor sugars. Notably, while 6AzGlcNAc is the most selective reporter of O-GlcNAcylation, it requires longer labeling-times to achieve the same signal-to-noise as GlcNAz (Figure 5A), highlighting a potential trade-off between labeling efficiency and specificity. However, based on our results, we predict that any bottlenecks in the metabolism of 6AzGlcNAc will not dramatically hamper the visualization and identification of O-GlcNAcylated proteins. Furthermore, the extent of O-GlcNAcylation and identity of modified proteins has been shown to be dependent on the cellular concentration of UDP-GlcNAc.42−44 Therefore, it could be advantageous to have limited metabolic conversion of an MCR to minimize the chances of altering the endogenous repertoire of O-GlcNAcylated proteins, as long as the labeling is above the detection limit. We are currently exploring if different concentrations of MCR treatment change the overall levels of O-GlcNAcylation. Despite the increased labeling efficiency of GlcNAz and GalNAz compared to 6AzGlcNAc, approximately the same total number of spectral counts were found in our comparative proteomics experiment. We believe that this could be due to an excess of input that exceeded the capacity of the streptavidin beads, resulting in equal total levels of protein enrichment prior to trypsinolysis and identification.
Coupled with the ever-growing toolkit of commercially available and custom azide-reactive tags, including terminal alkynes, cyclooctynes, and phosphines, we predict that 6AzGlcNAc will become the most powerful and readily used MCR for the study of O-GlcNAcylation. In particular, metabolic labeling strategies have the unique ability to isolate time-resolved protein modifications that only occur during cell labeling. Furthermore, MCRs can be used in pulse-chase experiments to measure the dynamic removal of O-GlcNAc modifications in living cells. Finally, the successful application of synthetic chemistry to identify a selective MCR of O-GlcNAcylation suggests that the same chemical strategy could be used to create reporters that are specific for other types of protein glycosylation. Coupled with new bioorthogonal reactions (e.g., tetrazene clycoadditions), which enable more diverse functional groups to be incorporated into MCRs,45−47 we predict that a library of MCRs can be created to enable the specific visualization and identification of the several types of glycosylation in mammals and other organisms.
Experimental Procedures
General Information
All reagents used for chemical synthesis were purchased from Sigma-Aldrich, Alfa Aesar or EMD Millipore unless otherwise specified and used without further purification. DBCO-biotin was purchased from Click Chemistry Tools. FITC-avidin was purchased from Sigma. All anhydrous reactions were performed under argon or nitrogen atmosphere. Analytical thin-layer chromatography (TLC) was conducted on EMD Silica Gel 60 F254 plates with detection by ceric ammonium molybdate (CAM), anisaldehyde or UV. For flash chromatography, 60 Å silica gel (EMD) was utilized. 1H spectra were obtained at 400, 500, or 600 MHz on a Varian spectrometers Mercury 400, VNMRS-500, or -600. Chemical shifts are recorded in ppm (δ) relative to solvent. Coupling constants (J) are reported in Hz. 13C spectra were obtained at 100, 125, or 150 MHz on the same instruments.
Cell Culture
COS-7, HEK293, HeLa and MCF7 cells were cultured in DMEM media (Corning) enriched with 10% fetal bovine serum (Atlanta Biologicals). AmphoPack-293 retroviral packaging cells (Clontech) were cultured in DMEM media (Corning) enriched with 10% fetal bovine serum (HyClone, ThermoScientific). NIH3T3 and MEF cells were cultured in high-glucose DMEM media (Corning) enriched with 10% fetal calf serum (HyClone, ThermoScientific). H1299 cells were cultured in RPMI media enriched with 10% fetal bovine serum (HyClone, ThermoScientific). All cell lines were maintained in a humidified incubator at 37 °C and 5.0% CO2.
Metabolic Labeling
To cells at 80–85% confluency, media containing Ac4GlcNAc, Ac4GlcNAz, Ac4GalNAz, Ac36AzGlcNAc (1000× stock in DMSO), or DMSO vehicle was added as indicated. For chase experiments, existing media was replaced with media supplemented with 200 μM Ac4GlcNAc (Sigma) or 200 μM Ac4GlcNAc (Sigma) plus 10 μM Thiamet-G (1000 x stock in DMSO) as indicated.
Preparation of NP-40-Soluble Lysates
The cells were collected by trypsinization and pelleted by centrifugation at for 4 min at 2000g, followed by washing 2× with PBS (1 mL). Cell pellets were then resuspended in 100 μL of 1% NP-40 lysis buffer [1% NP-40, 150 mM NaCl, 50 mM triethanolamine (TEA) pH 7.4] with Complete, Mini, EDTA-free Protease Inhibitor Cocktail Tablets (Roche) for 20 min and then centrifuged for 10 min at 10 000g at 4 °C. The supernatant (soluble cell lysate) was collected and the protein concentration was determined by BCA assay (Pierce, ThermoScientific).
Cu(I)-Catalyzed [3 + 2] Azide–Alkyne Cycloaddition (CuAAC)
Cell lysate (200 μg) was diluted with cold 1% NP-40 lysis buffer to obtain a desired concentration of 1 μg μL–1. Newly made click chemistry cocktail (12 μL) was added to each sample [alkynyl-rhodamine tag (100 μM, 10 mM stock solution in DMSO); tris(2-carboxyethyl)phosphine hydrochloride (TCEP) (1 mM, 50 mM freshly prepared stock solution in water); tris[(1-benzyl-1-H-1,2,3-triazol-4-yl)methyl]amine (TBTA) (100 μM, 10 mM stock solution in DMSO); CuSO4·5H2O (1 mM, 50 mM freshly prepared stock solution in water) for a total reaction volume of 200 μL. The reaction was gently vortexed and allowed to sit at room temperature for 1 h. Upon completion, 1 mL of ice cold methanol was added to the reaction, and it was placed at −20 °C for 2 h to precipitate proteins. The reactions were then centrifuged at 10 000g for 10 min at 4 °C. The supernatant was removed, the pellet was allowed to air-dry for 15 min, and then 50 μL 4% SDS buffer (4% SDS, 150 mM NaCl, 50 mM TEA pH 7.4) was added to each sample. The mixture was sonicated in a bath sonicator to ensure complete dissolution, and 50 μL of 2× SDS-free loading buffer (20% glycerol, 0.2% bromophenol blue, 1.4% β-mercaptoethanol, pH 6.8) was then added. The samples were boiled for 5 min at 97 °C, and 40 μg of protein was then loaded per lane for SDS-PAGE separation (Any Kd, Criterion Gel, Bio-Rad).
In-Gel Fluorescence Scanning
Following SDS-PAGE separation, gels were scanned on a Typhoon 9400 Variable Mode Imager (GE Healthcare) using a 532 nm for excitation and 30 nm bandpass filter centered at 610 nm for detection.
Reverse Transcriptase-PCR
Information about primers used for GALK2 and GAPDH available upon request. RNA from NIH3T3 cells was isolated using the RNAeasy Kit (Qiagen). Concentrations of RNA were obtained by UV–vis. PCR was conducted in an Eppendorf Mastercycler thermocycler. To a 0.2 mL thermo-walled PCR tube was added 2× Reaction Mix (SuperScript One-Step RT-PCR with Platinum Taq, Invitrogen), template RNA from NIH3T3 cells (1000 ng), sense and antisense primers for GALK2 (10 μM), sense and antisense primers for GAPDH (10 μM), water, and Taq enzyme (SuperScript One-Step RT-PCR with Platinum Taq, Invitrogen). The provided PCR cycle was used according to SuperScript One-Step RT-PCR with Platinum Taq (Invitrogen) with an extension time of 32 s (1 min/kbp). Products were diluted with 6× sample loading dye (Bio-Rad) and analyzed by electrophoresis on a 5% agarose gel (500 mg of agarose in 1× TAE buffer, tris/acetic acid/EDTA, Bio-Rad). The gel was subsequently visualized using a ChemiDoc XRS+ molecular imager (Bio-Rad).
GalNAc Kinase 2 (GalK2) Assay
Recombinant human GalK2 was prepared as previously described.48 Recombinant GalK2 (8 μg mL–1) was incubated in triplicate with GalNAc, GlcNAc or 6AzGlcNAc (40 mM) in 25 μL reaction buffer (10 mM MgCl2, 50 mM Tris HCl pH 8.0) containing 1 mg/mL BSA and 5 mM [32P]γATP (1000 cpm/nmol) for 60 min at 37 °C. After this time, reactions were terminated by the addition of water (0.75 mL) and applied to a Dowex 1 × 8 (Cl-) column (0.7 cm × 3.0 cm). Unreacted starting material was eluted by washing with 2 mL of 25 mM NH4HCO3 before eluting the sugar-1-phosphates with 100 mM NH4HCO3. The fractions (2 mL) were counted in a liquid scintillation counter (μBeta, PerkinElmer). Controls without acceptor substrates were treated in the same way. Column profiles were compared to detect the presence of overlapping radioactive peaks corresponding to degradation products. If present, these peaks were subtracted from the assay chromatogram.
Expression of Phosphoacetylglucosamine Mutase (AGM1)
Homo sapiens phosphoacetylglucosamine mutase 3 (AGM1/PGM3) cDNA was obtained from Biovalley (Marne-la-Vallée, France), amplified by PCR, sequenced and cloned in pTrcHis A (Invitrogen). The 6His-tagged PGM3 protein was expressed in Escherichia coli DH5α (Invitrogen) cultured for 24 h at 18 °C in 2TY medium supplemented with 1 mM IPTG and 2 mM MgCl2. Bacteria were lysed in Y-Per (ThermoScientific) and the lysate diluted with 5 volumes of 50 mM phosphate buffer pH 8.0, 300 mM NaCl, 10 mM imidazole, 0.1 mM PMSF and 0.1 mM TCEP. After application of the lysate on a HisTrap FF 5 mL column (GE Healthcare), AGM1 was eluted with 250 mM imidazole in 25 mM phosphate buffer pH 8.0, 150 mM NaCl, 0.1 mM TCEP. AGM1 activity was checked in a coupled assay by 2 h incubation at 37 °C with GlcNAc-6-phosphate (2 mM), in 75 mM Tris HCl pH 8.8, 5 mM MgCl2, containing 0.1 mg BSA and 2 μL of the PGM3 enzyme solution, and coupling with AGX1 (0.6–6.3 μg mL–1, 2.2–22 mU mL–1) and yeast inorganic pyrophosphatase (1.6 μg mL–1, 3 U mL–1) in the presence of [3H]UTP (PerkinElmer, 2 mM, 260 cpm nmol–1). After AGM1/AGX1/yeast inorganic phosphatase heat denaturation, calf intestinal alkaline phosphatase (NEB, 80 U mL–1) was added in order to hydrolyze all the UTP and UDP present, and the products were monitored as described below for AGX1 enzymatic tests (separation on paper chromatography). Finally, the production of UDP-GlcNAc was estimated by scintillation counting. Under these conditions, the recombinant AGM1 activity was estimated to 20 nmol h–1 μg–1 of the AGM1 enzyme solution.
Phosphoacetylglucosamine Mutase (AGM1) Assay
6AzGlcNAc (2.25 mM final concentration) was incubated in 100 μL of 75 mM Tris HCl pH 8.8, 5 mM MgCl2, containing 0.1 mg BSA and 10 μg of the PGM3 enzyme solution. Incubations were run at 37 °C for 1 h 30 min either without cofactor or in the presence of Glc-6P, Glc1,6-diP or GlcNAc-6P (1.00 mM final concentration). Reactions were stopped by freezing at −20 °C. After thawing, the reaction mixtures were incubated for 1 h at 37 °C with bicyclo[6.1.0]nonyne-(POE)3-NH-Dye495 conjugate (Synaffix, Oss, Netherlands). The reaction mixtures which contain the azido sugars coupled through their azido moiety to the BCN fluorescent Dye495, were then laid onto a 46 × 57 cm sheet of Whatman 3MM Paper (GE Healthcare) and run for descending chromatography in ethyl acetate/formic acid/water (70:20:10) for 5 h. After drying, fluorescent spots (Rf ∼ 0.8) were cut out and the products eluted from the paper in 50% methanol. They were further concentrated under a vacuum before mass spectrometry analysis.
UDP-GalNAc Pyrophorylase (AGX1) Assay
Recombinant human AGX1 was prepared as previously described.48 Recombinant AGX1 (0.6–6.3 μg mL–1, 2.2–22 mU mL–1) was incubated with GlcNAc-1P or 6AzGlcNAc-1P in 25 μL reaction buffer (1 mM MgCl2, 75 mM Tris HCl pH 8.8) containing 1 mg mL–1 BSA and 2 mM [3H]UTP (260 cpm nmol–1) for 10 min at 37 °C. Yeast inorganic pyrophosphatase (1.6 μg mL–1, 3 mU mL–1) was also added to inhibit the reverse reaction. Reactions were terminated by heating for 6 min at 80 °C. To hydrolyze excess UTP and UMP, calf intestinal alkaline phosphatase (New England Biolabs, 80 U/mL) was added to the reaction mixture and incubated for 2 h at 37 °C. The reaction was spotted onto Whatman 3MM chromatography paper and submitted to descending chromatography in ethyl acetate/formic acid/water (70:20:10) to remove [3H]Uridine (Rf = 0.25). Spots with [3H]UDP-sugars (Rf = 0.01) were cut out of the chromatography paper and counted in a liquid scintillation counter. Control samples without sugar-1P received the same treatment in order to deduct background radioactivity. All tests were run in triplicates and each experiment was repeated three times. Km and Kcat were calculated using the Enzyme Kinetic Module 1.3 of SigmaPlot 10, from plots obtained with different concentrations of sugar-1P and different amounts of AGX1.
MTS Assay
NIH3T3 cells were pretreated with 200 μM Ac36AzGlcNAc or DMSO for 72 h prior to plating. NIH-3T3 cells (1 × 10⁴ cells) were plated per well in a 96-well, white bottom dish 24 h before treatment with 200 μM Ac4GlcNAc or Ac36AzGlcNAc for 16 h in triplicate. CellTiter 96 AQueous Non-Radioactive Cell Proliferation Assay (Promega, Madison, WI) was used according to the provided protocol. Absorbance at 490 nm was read using a BioTek Synergy H4Multi-Mode Microplate reader.
Flow Cytometry of Cell-Surface Labeling with DBCO-Biotin
NIH3T3 cells grown in 6-well plates at 80–85% confluency were treated with 200 μM Ac4GlcNAc, Ac4GlcNAz, Ac4GalNAz or Ac36AzGlcNAc in triplicate for 16 h at which time media was removed and cells were gently washed with PBS before being detached from the plate with 1 mM EDTA in PBS. Cells were collected by centrifugation (5 min, 300g at 4 °C) and were washed three times with PBS (5 min, 300g at 4 °C). Cells were then resuspended in 200 μL PBS containing DBCO-biotin (Click Chemistry Tools, 60 μM) for 1 h, after which time they were washed three times with PBS (5 min, 300g at 4 °C) before being resuspended in ice-cold PBS containing fluorescein isothiocynate (FITC) conjugated avidin (Sigma, 5 μg/mL, 30 min at 4 °C). Cells were then washed three times in PBS (5 min, 300g at 4 °C) before being resuspended in 400 μL PBS for flow-cytometry analysis. A total of 10 000 cells [dead cells were excluded by treatment with propidium iodide (2.5 μg mL–1 in water, 30 min)] were analyzed on a BD SORP LSRII Flow Cytometer using the 488 nm argon laser.
FoxO1 Labeling
NIH3T3 cells stably expressing FLAG-tagged FoxO1 were treated with 200 μM Ac4GlcNAz, Ac36AzGlcNAc (1000 x stock in DMSO) or DMSO and allowed to incubate overnight. After 16 h, cells were washed with PBS, trypsinized and pelleted. Cell pellets were resuspended in 100 μL of 1% NP-40 lysis buffer [1% NP-40, 150 mM NaCl, 50 mM triethanolamine (TEA) pH 7.4] with Complete Mini, EDTA-free Protease Inhibitor Cocktail Tablets (Thermo Scientific) for 20 min and then centrifuged at 4 °C for 10 min at 10 000g. The supernatant was collected and the protein concentration was determined by BCA assay (Pierce, ThermoScientific). Total cell lysate (1.5 mg) was diluted as necessary to a final volume of 1 mL with 1% NP-40 buffer with Complete Mini, EDTA-free Protease Inhibitor Cocktail Tablets (Thermo Scientific). EZview Red ANTI-FLAG M2 affinity beads (30 μL, Sigma), prewashed with cold NP-40 buffer 2× followed by cold PBS 2×, were added to each sample. The samples were placed on a rotator for 2 h at 4 °C. Beads were collected by centrifugation at 2000g for 2 min at 4 °C, and the supernatant was carefully removed. Beads were then washed with cold PBS by rotating for 5 min before centrifuging 2 min at 2000g. The final PBS wash was carefully removed, and the beads were suspended in 40 μL of 4% SDS buffer and boiled for 5 min at 97 °C. The appropriate amount of click chemistry cocktail was added, and the reaction was allowed to proceed for 1 h after which time 30 μL of 2× loading buffer was added. Samples were boiled for 5 min at 97 °C. Protein samples (40 μg) were then loaded per lane for SDS-PAGE separation (Any Kd Criterion Gel, Bio-Rad) and imaged by in-gel fluorescence scanning.
GlyCAM-IgG labeling
NIH3T3 cells stably expressing GlyCAM-IgG in 6-well dishes at 80–85% confluency were treated in DMEM with 10% FCS and 200 μM Ac4GlcNAz, Ac36AzGlcNAc (1000× stock in DMSO) or DMSO for 24 h. The media from each sample was collected by centrifugation at 3000g for 10 min at 4 °C to remove cell debris. The supernatant (1 mL) was incubated with 50 μL of recombinant protein G sepharose beads (Invitrogen) in 100 mM TEA pH 8 overnight. Beads were collected by centrifugation at 2000g for 2 min at 4 °C. Beads were washed 3× with 1 mL 100 mM TEA pH 8. GlyCAM-Ig was eluted by addition of 50 μL of 4% SDS buffer (4% SDS, 150 mM NaCl, 50 mM TEA pH 7.4) and boiling for 5 min at 97 °C. Protein concentration was determined by BCA assay (ThermoScientific). Final SDS concentration was diluted to 0.5% by addition of 50 mM TEA pH 7.4. The appropriate amount of click chemistry cocktail was added and the reaction was allowed to proceed for 1 h after which time 4× loading buffer (200 mM Tris HCl, 4% SDS, 40% glycerol, 0.4% bromophenol blue, 1.4% β-mercaptoethanol, pH 6.8) was added. Samples were boiled for 5 min at 97 °C, and 50 μg were loaded for SDS-PAGE separation (Any Kd Criterion Gel, Bio-Rad).
Western Blotting
Proteins were separated by SDS-PAGE before being transferred to PVDF membrane (Bio-Rad) using standard Western blotting procedures. All Western blots were blocked in TBST (0.1% Tween-20, 150 mM NaCl, 10 mM Tris pH 8.0) containing 5% nonfat milk for 1 h at rt. The blots were then incubated with the appropriate primary antibody in blocking buffer for 1 h at rt. The anti-FLAG antibody (Thermo) and anti-MAb414 antibody (Covance) were used at a 1:5000 dilution and 1:1000 for detection of FoxO1 and p62, respectively. The anti-NEDD4 antibody (Millipore) was used at a 1:10 000 dilution to detect NEDD4 and the anti-Pyruvate kinase antibody (Abcam) was used at 1:1000. The blots were then washed three times in TBST for 10 min and incubated with the horseradish peroxidase (HRP)-conjugated secondary antibody for 1 h in blocking buffer at rt. HRP-conjugated antimouse, antirabbit, antigoat and antihuman antibodies (Jackson ImmunoResearch) were used at 1:10 000 dilutions. After being washed three more times with TBST for 10 min, the blots were developed using ECL reagents (Bio-Rad) and the ChemiDoc XRS+ molecular imager (Bio-Rad).
Biotin Enrichment and On-Bead Trypsinolysis
NIH3T3 cell-pellets labeled with Ac36AzGlcNAc, Ac3GlcNAz, Ac3GalNAz or Ac4GlcNAc for 16 h were resuspended in 200 μL H2O, 60 μL PMSF in H2O (250 mM), and 500 μL of 0.05% SDS buffer (0.05% SDS, 10 mM TEA pH 7.4, 150 mM NaCl) with Complete Mini protease inhibitor cocktail (Roche Biosciences). To this was added 8 μL Benzonase (Sigma), and the cells were incubated on ice for 30 min. Then, 4% SDS buffer (2000 μL) was added, and the cells were briefly sonicated in a bath sonicator followed by centrifugation (20 000g for 10 min at 15 °C). Soluble protein concentration was normalized by BCA assay (Pierce, ThermoScientific) to 1 mg mL–1, and 10 mg of total protein was subjected to the appropriate amount of click chemistry cocktail containing alkyne-PEG3-biotin (5 mM, Click Chemistry Tools) for 1 h, after which time 10 volumes of ice-cold MeOH were added. Precipitation proceeded 2 h at −20 °C. Precipitated proteins were centrifuged at 5200g for 30 min at 0 °C and washed 3 times with 40 mL of ice-cold MeOH, with resuspension of the pellet each time. The pellet was then air-dried for 1 h. To capture the biotinylated proteins by streptavidin beads, the air-dried protein pellet was resuspended in 2 mL of resuspension buffer (6 M urea, 2 M thiourea, 10 mM HEPES pH 8.0) by bath sonication. To cap cysteine residues, 100 μL of freshly made TCEP (200 mM stock solution, Thermo) was then added and the mixture incubated for 30 min, followed by 40 μL of freshly prepared iodoacetamide (1 M stock solution, Sigma) and incubation for a further 30 min in the dark. Steptavadin beads (250 μL of a 50% slurry per sample, Thermo) were washed 2× with 1 mL PBS and 1× with 1 mL of resuspension buffer and resuspended in resuspension buffer (200 μL). Each sample was combined with streptavadin beads and incubated on a rotator for 2 h. These mixtures were then transferred to Mini Bio-Spin columns (Bio-Rad) and placed on a vacuum manifold. Captured proteins were then washed with agitation 5× with resuspension buffer (10 mL), 5× PBS (10 mL), 5× with 1% SDS in PBS (10 mL), 30× with PBS (1 mL per wash, vacuum applied between each wash), and 5× 2 M urea in PBS (1 mL per wash, vacuum applied between each wash). Beads were then resuspended in 2 M urea in PBS (1 mL), transferred to screw-top tubes, and pelleted by centrifugation (2000g for 2 min). At this time, 800 μL of the supernatant was removed, leaving a volume of 200 μL. To this bead-mixture was added 2 μL of CaCl2 (200 mM stock, 1 mM final concentration) and 2 μL of 1 mg mL–1 sequence grade trypsin (Promega) and incubated at 37 °C for 18 h. The resulting mixtures of tryptic peptides and beads were transferred to Mini Bio-Spin columns (Bio-Rad) and the eluent was collected by centrifugation (1000g for 2 min). Any remaining peptides were eluted by addition of 100 μL of 2 M urea in PBS followed by centrifugation as immediately above. The tryptic peptides were then applied to C18 spin columns (Pierce) according to manufacturer’s instructions, eluted with 70% acetonitrile in H2O, and concentrated to dryness on a speedvac.
LC–MS/MS Proteomic Analysis
Peptides were desalted on a trap column following separation on a 12 cm/75um reversed phase C18 column (Nikkyo Technos Co., Ltd. Japan). A 3 h gradient increasing from 10% B to% 45% B in 3 h (A: 0.1% Formic Acid, B: Acetonitrile/0.1% Formic Acid) was delivered at 150 nL min–1. The liquid chromatography setup (Dionex, Boston, MA, USA) was connected to an Orbitrap XL (Thermo, San Jose, CA, USA) operated in top-5-mode. Acquired tandem MS spectra (CID) were extracted using ProteomeDiscoverer v. 1.3 (Thermo, Bremen, Germany) and queried against the human Uniprot protein database using MASCOT 2.3.02 (Matrixscience, London, UK). Peptides fulfilling a Percolator calculated 1% false discovery rate threshold were reported. All LC–MS/MS analysis were carried out at the Proteomics Resource Center at The Rockefeller University, New York, NY, USA. Excel files containing identified proteins will be made available upon request.
Synthesis of Chemical Reporters and OGA Inhibitor
Known chemical reporter Ac4GlcNAz39 was synthesized according to literature procedures. The fluorescent detection tag alk-rho49 and the OGA inhibitor Thiamet-G38 were also synthesized according to published procedures.
Synthesis of Ac36AzGlcNAc
6-O-p-Methylbenzenesulfonate-N-acetyl-glucosamine (1)
Commercially available N-acetyl-glucosamine (1.00 g, 4.52 mmol) was dissolved in anhydrous pyridine under nitrogen and cooled to −20 °C. p-Toluenesulfonyl chloride (1.04 g, 5.43 mmol) was dissolved in anhydrous pyridine (3 mL), and the solution was added dropwise over 20 min to the above reaction mixture. Upon completion of the addition, the reaction was warmed to rt and stirred for 18 h. The mixture was concentrated by vacuum and used without further purification.
1,3,4-Tri-O-acetyl-6-azido-6-deoxy-N-acetyl-glucosamine (Ac36AzGlcNAc, 2)39
Compound 1 was resuspended in N,N-dimethylformamide (20 mL) under a nitrogen atmosphere. Sodium azide (1.47 g, 22.6 mmol) was added and the reaction was stirred for 3 d at 50 °C. The reaction mixture was then concentrated by vacuum and resuspended in pyridine (30 mL). Acetic anhydride (10.0 mL, 66.0 mmol) was added and the mixture was stirred for 16 h at rt. Upon completion, solvent was removed under reduced pressure and the resulting mixture was redissolved in CH2Cl2 (200 mL) and washed with 1 M HCl (2 × 100 mL), saturated aqueous sodium bicarbonate (2 × 100 mL) and water (2 × 100 mL). Organic layer was dried over sodium sulfate. The resulting crude mixture was purified by column chromatography (65% ethyl acetate in hexanes) to afford 1.01 g of the product in 60% yield over three steps as an alpha-beta mixture: 1H NMR (400 MHz, CD3OD) of pure alpha-anomer δ (ppm) 6.18 (d, J = 3.7 Hz, 1H), 5.61 (d, J = 8.9 Hz, 1H), 5.25–5.10 (m, 2H), 4.46 (ddd, J = 10.9, 9.0, 3.7 Hz, 1H), 3.94–3.92 (m, 1H), 3.38–3.32 (m, 1H), 3.29 (dd, J = 13.5, 5.5 Hz, 1H), 2.19 (s, 3H), 2.04 (d, J = 1.3 Hz, 6H), 1.92 (s, 3H).
Synthesis of Alkyne-azo-biotin
4-(Prop-2-yn-1-yl)phenol (3)50
Hydroquinone (11.0 g, 0.910 mmol) and propargyl chloride (7.50 g, 0.101 mmol) were dissolved in ethanol (20 mL) under an argon atmosphere in a three-neck flask equipped with an addition funnel. The reaction was heated to reflux to dissolve all solids. KOH (0.10 M in water) was added dropwise through the addition funnel. The mixture was then stirred for 20 h upon which time the reaction was cooled and solvent was removed by vacuum. The resulting crude mixture was dissolved in CH2Cl2 and extracted with dilute, aqueous KOH. The aqueous layer was then brought to a neutral pH by the addition of 1 M HCl and subsequently extracted with CH2Cl2. The organic layer was washed with water and dried over sodium sulfate, filtered and concentrated. The crude mixture was purified by column chromatography (10% ethyl acetate:hexanes) to afford the pure product (4.07 g, 28%): 1H NMR (400 MHz, CDCl3) δ (ppm) 6.85 (dd, J = 9.1, 1.1 Hz, 2H), 6.78 (d, J = 9.0 Hz, 2H), 4.61 (dd, J = 2.4, 1.0 Hz, 2H), 2.50 (t, J = 2.4 Hz, 1H).
4-(Methoxycarbonyl)benzenediazonium chloride
To a suspension of methyl-4-amino-benzoate in 6 M HCl was added sodium nitrite at 0 °C. The reaction was let stir for 30 min. The crude reaction mixture was used in the subsequent reaction.
(E)-Methyl 4-((2-hydroxy-5-(prop-2-yn-1-yl)phenyl)diazenyl)benzoate (4)
Compound 3 (1.30 g, 18.9 mmol) was dissolved in water:THF (2:1) and cooled to 0 °C. Potassium carbonate (52.0 g, 376 mmol) was added and reaction let stir for 30 min upon which time 4-(methoxycarbonyl)benzenediazonium chloride was added dropwise. The reaction was allowed to warm to rt and was stirred for 18 h. The reaction was poured over water and extracted with ethyl acetate (3 × 200 mL). The organic layer was dried over sodium sulfate, filtered, and concentrated. The resulting crude mixture was purified by column chromatography by first starting at 10% ethyl acetate:hexanes and increasing to 20% ethyl acetate:hexanes to elute the product. Concentration under decreased pressure affords the product as a yellow oil (2.00 g, 90%): 1H NMR (400 MHz, CDCl3) δ (ppm) 8.20 (d, J = 8.5 Hz, 2H), 7.92 (d, J = 8.6 Hz, 2H), 7.56 (d, J = 3.1 Hz, 1H), 7.10 (dd, J = 9.1, 3.1 Hz, 1H), 7.00 (d, J = 9.1 Hz, 1H), 4.75 (d, J = 2.3 Hz, 2H), 3.97 (s, 3H), 2.56 (t, J = 2.4 Hz, 1H); 13C NMR (125 MHz, CDCl3) δ (ppm) 166.25, 153.08, 150.83, 148.27, 137.01, 131.92, 130.80, 130.17, 128.36, 123.68, 122.02, 119.17, 111.60, 78.41, 75.86, 56.77, 52.38; MALDI-MS calculated for C17H15N2O3 [M + H]+ 295.1083, found 293.9045.
(E)-4-((2-Hydroxy-5-(prop-2-yn-1-yl)phenyl)diazenyl)benzoic acid (5)
Compound 4 (0.124 g, 0.421 mmol) was dissolved in tetrahydrofuran (2 mL). NaOH (0.758 mg, 1.90 mmol) dissolved in water was added and reaction let stir 18 h. Upon completion, a color change from purple to orange is seen. The reaction was neutralized by the dropwise addition of acetic acid and subsequently concentrated under reduced pressure to remove solvent. The resulting crude mixture was dissolved in CH2Cl2 and washed with water (2 × 50 mL). The organic layer was dried over sodium sulfate, filtered, and concentrated. The crude mixture was column purified (8:1.5:0.5 ethyl acetate:methanol:water) to afford the pure product as a bright orange solid (0.825 g, 70%): 1H NMR (600 MHz, CD3OD) δ (ppm) 8.05 (d, J = 8.5 Hz, 2H), 7.85 (d, J = 8.5 Hz, 2H), 7.46 (d, J = 3.0 Hz, 1H), 7.01 (dd, J = 9.2, 3.0 Hz, 1H), 6.88 (d, J = 8.9 Hz, 1H), 4.68 (d, J = 2.3 Hz, 2H), 2.87 (t, J = 2.4 Hz, 1H); 13C NMR (125 MHz, CD3OD) δ (ppm) 216.29, 178.12, 162.96, 160.46, 160.22, 148.17, 146.80, 140.14, 132.53, 132.07, 129.05, 115.05, 89.05, 88.03, 65.94, 40.41; MALDI-MS calculated for C16H12N2O3Na [M + Na]+ 303.0740, found 302.9541.
(E)-2,5-Dioxopyrrolidin-1-yl-4-((2-hydroxy-5-(prop-2-yn-1-yl)phenyl)diazenyl)benzoate (6)
To a solution of 5 (0.180 g, 0.642 mmol) in THF under argon was added N-hydroxysuccinimide (0.177 g, 1.54 mmol) and N,N′-Dicyclohexylcarbodiimide (0.317 g, 1.54 mmol). The reaction was let stir for 18 h at rt at which time the reaction was concentrated by vacuum. The mixture was dissolved in ethyl acetate and filtered to remove solids. The flow-through was concentrated and the crude product was purified by column chromatography (1:10 ethyl acetate:CH2Cl2) to afford the product as a dark red solid that was used in the subsequent reaction without further purification.
(E)-4-((2-Hydroxy-5-(prop-2-yn-1-yl)phenyl)diazenyl)-N-(13-oxo-17-(2-oxohexahydro-1H-thieno[3,4-d]imidazol-4-yl)-3,6,9-trioxa-12-azaheptadecyl)benzamide (Alk-azo-biotin, 7)
Compound 6 (0.040 g, 0.101 mmol) was dissolved in anhydrous N,N′-dimethylformamide (1 mL) under argon. EZ-Link Amine PEG3-Biotin (0.460 mg, 0.111 mmol) (Thermo Scientific) was added and reaction let stir for 18 h upon which time solvent was removed by vacuum. The resulting crude mixture was purified by RP-HPLC over a C18 semipreparative column (The Nest Group) using a 5.5–44% B linear gradient over 10 min before switching to a 44–100% B linear gradient over 40 min, tR = 18 min (buffer A: 0.1% TFA in water, buffer B: 0.1% TFA, 90% ACN in water) and lyophilized to afford the pure product as an orange solid (0.022 g, 31%): MALDI-MS calculated for C34H40N6O8S (oxidized at the biotin cysteine) [M + Na]+ 719.2839, found 719.2656.
Synthesis of 6AzGlcNAc and 6AzGlcNAc-1-phosphate
6-O-p-Methylbenzenesulfonate-N-acetyl-glucosamine (8)
Commercially available 2-deoxy-2-N-acetyl-glucopyranose (2.50 g, 11.3 mmol) was coevaporated from toluene and dissolved in anhydrous pyridine (20 mL). The reaction mixture was cooled to −20 °C. p-Toluenesulfonyl chloride (2.59 g, 13.6 mmol) was then dissolved is anhydrous pyridine (5 mL) and added dropwise to the stirring mixture. Upon completion of addition, the reaction was allowed to warm to room temperature and stirred for 16 h under an argon atmosphere. To purify, the reaction was concentrated under reduced pressure and the crude mixture purified by column chromatography (7:1:0.5 ethyl acetate:methanol:water) to afford the product as a yellow oil (1.78 g): 1H NMR (500 MHz, CD3OD) α-anomer δ 7.74 (d, J = 8.3 Hz, 2H), 7.26 (d, J = 8.2 Hz, 2H), 5.13 (d, J = 3.6 Hz, 1H), 3.99 (m, 1H), 3.90 (dd, J = 2.2, 10.6 Hz, 1H), 3.73 (m, 1H), 3.55 (dd, J = 3.2, 13.3 Hz, 1H), 3.44 (dd, J = 5.4, 12.6 Hz, 1H), 3.38 (m, 1H), 2.39 (s, 3H), 2.01 (s, 3H). The product was used in the subsequent reaction with no further characterization.
6-Azido-6-deoxy-N-acetyl-glucosamine (6AzGlcNAc, 9)39
Compound 8 (1.78 g, 4.73 mmol) was coevaporated from toluene and dissolved in anhydrous N,N′-dimethylformamide (20 mL). Sodium azide (1.54 g, 23.7 mmol) was then added and the reaction warmed to 50 °C. The reaction was stirred for 3 d after which time the reaction was cooled and concentrated under reduced pressure. The crude mixture was purified by silica gel chromatography (9:1:0.5 ethyl acetate:methanol:water) to afford the product as a white solid (402 mg, 14% yield over 2 steps). The sugar was further purified by RP-HPLC over a C18 semipreparative column (The Nest Group) using a 5–15% B linear gradient over 10 min, tR = 2.5 min (buffer A: 0.1% TFA in water, buffer B: 0.1% TFA, 90% ACN in water): 1H NMR (500 MHz, (CD3)2SO) α-anomer δ 7.69 (d, J = 8.3 Hz, 1H), 4.94 (app s, 1H), 3.78 (m, 1H), 3.62 (m, 1H), 3.50 (m, 2H), 3.37 (m, 1H), 3.10 (app t, J = 9.2 Hz, 1H), 1.83 (s, 3H); 13C NMR (125 MHz,(CD3)2SO) β-anomer δ 169.39, 90.77, 71.85, 70.52, 70.17, 54.21, 51.60, 22.67.
α-1-O-Benzyl-N-acetyl-glucosamine (10)34
The procedure was adapted from literature.51 Commercially available 2-deoxy-2-N-acetyl-glucopyranose (5.00 g, 22.6 mmol) was suspended in benzyl alcohol (50 mL) and concentrated HCl was added (1 mL). The solution was warmed to 75 °C and stirred for 4 h after which time the reaction was cooled and poured into diethyl ether (400 mL) with vigorous stirring. A white precipitate was observed and the mixture left at 4 °C for 16 h. The precipitate was then filtered and washed with diethyl ether (50 mL) to remove remaining benzyl alcohol. The filtrated was dried and recrystallized in a minimal amount of isopropanol to afford the product as white solid (2.48 g, 7.98 mmol, 35% yield): 1H NMR (500 MHz, (CD3)2SO) δ 7.82 (d, J = 8.2 Hz, 1H), 7.38–7.28 (m, 5H), 4.71 (d, J = 3.5 Hz, 1H), 4.68 (d, J = 12.5 Hz, 1H), 4.31 (d, J = 12.5 Hz, 1H), 3.80 (q, J = 6.1 Hz, 1H), 3.70–3.64 (m, 2H), 3.55–3.47 (m, 2H), 3.18 (t, J = 9.02 Hz, 1H), 1.83 (s, 3H).
α-1-O-Benzyl-6-O-p-methylbenzenesulfonate-N-acetyl-glucosamine (11)34
Compound 10 (2.36 g, 7.58 mmol) was coevaporated from toluene and dissolved in anhydrous pyridine (20 mL) under an argon atmosphere. The mixture was then cooled to −20 °C. p-Toluenesulfonyl chloride (1.74 g, 9.10 mmol), freshly rescrystallized from CH2Cl2, was dissolved in pyridine (7 mL) and added dropwise over 20 min. The reaction was stirred at −20 °C for 1 h and the dry ice bath replaced with an ice bath. The reaction was allowed to warm to room temperature over 16 h. Upon completion, the mixture was concentrated to remove pyridine and purified over silica gel (9:1:0.5 EtOAc:methanol:water) to afford product (1.85 g, 3.97 mmol, 52% yield): 1H NMR (500 MHz, CD3OD) δ 7.85 (d, J = 10.4 Hz, 2H), 7.46 (d, J = 1.1 Hz, 2H), 7.36 (m, 5H), 4.76 (d, J = 4.5 Hz, 1H), 4.65 (d, J = 15 Hz, 1H), 4.45 (d, J = 14.8 Hz, 1H), 4.36 (dd, J = 2.6, 13.6 Hz, 1H), 4.27 (dd, J = 7.3, 13.6 Hz, 1H), 3.88 (dd, J = 4.6, 13.5 Hz, 1H), 3.81–3.78 (m, 1H), 3.71–3.66 (m, 1H), 3.35–3.31 (m, 1H), 2.46 (s, 3H), 1.97 (s, 3H).
3,4-Di-O-acetyl-α-1-O-benzyl-6-O-p-methylbenzenesulfonate-N-acetyl-glucosamine (12)34
Compound 11 (1.85 g, 3.97 mmol) was resuspended in pyridine (20 mL) and acetic anhydride (1.12 mL, 11.01 mmol). The reaction was stirred for 3 h at room temperature after which time the reaction mixture was concentrated and purified over silica gel (75% EtOAc in hexanes) to afford product in quantitative yield (2.18 g, 3.97 mmol): 1H NMR (500 MHz, CDCl3) δ 7.79 (d, J = 10.3 Hz, 2H), 7.37–7.29 (m, 7H), 5.63 (d, J = 11.9 Hz, 1H), 5.20 (dd J = 11.7, 13.5 Hz, 1H), 4.96 (t, J = 12.1 Hz, 1H), 4.82 (d, J = 4.6 Hz, 1H), 4.67 (d, J = 14.7 Hz, 1H), 4.44 (d, J = 14.8 Hz, 1H), 4.26 (td, J = 4.6, 12.6 Hz, 1H), 4.07 (d, J = 5.0 Hz, 2H), 4.04–4.00 (m, 1H), 2.44 (s, 3H), 1.98 (d, J = 2.6 Hz, 6H), 1.86 (s, 3H).
3,4-Di-O-acetyl-6-O-p-methylbenzenesulfonate-N-acetyl-glucosamine (13)
Procedure adapted from published literature.34 Compound 12 (969 mg, 1.76 mmol) was resuspended in methanol. Pd(OH)2/C (10% Pd) was added and a balloon of H2 was attached. The reaction was monitored by TLC (75% EtOAc in hexanes) and stirred for 48 h to completion. The mixture was then filtered over a pad of Celite and the flow-through evaporated to yield the product (710 mg, 1.55 mmol) that was used in subsequent reactions with no further characterization.
Diallyl(3,4-di-O-acetyl-6-O-p-methylbenzenesulfonate-N-acetyl-glucosamine)-α-1-phosphate (14)
Compound 13 (629 mg, 1.37 mmol) was coevaporated with toluene and resuspended in CH2Cl2 (10 mL) under an argon atmosphere. 5-(Ethylthio)-1H-tetrazole (1.07 g, 8.22 mmol) was added and the reaction stirred for 15 min. Diallyl-N,N′-diisopropylphosphoramidite (1.00 g, 4.11 mmol) was added dropwise, and the reaction stirred for 2 h until completed as determined by TLC (5% methanol in CH2Cl2). At this time, the reaction was cooled to −78 °C and freshly recrystallized m-chloroperoxybenzoic acid was added (1.18 g, 6.85 mmol). The reaction was allowed to proceed for 10 min after which time the dry ice bath was replaced with an ice bath, and the reaction was slowly warmed to room temperature over 1 h. Upon completion, the reaction was diluted with CH2Cl2 (50 mL) and washed 2× each with saturated sodium thiosulfate, saturated sodium bicarbonate, water and brine. The organic layer was then concentrated and purified over silica gel (35%–45% acetone in hexanes) to afford the product (717 mg,74% yield over 2 steps): 1H NMR (500 MHz, CDCl3) δ 7.70 (d, J = 8.4 Hz, 2H), 7.29 (d, J = 7.8 Hz, 2H), 6.06 (d, J = 9.4 Hz, 1H), 5.93–5.82 (m, 2H), 5.54 (dd, J = 3.3, 6.3 Hz, 1H), 5.32 (ddd, J = 17.1, 12.3, 1.4 Hz, 2H), 5.23 (ddd, J = 10.6, 9.6, 1.2 Hz, 1H), 5.12 (dd, J = 10.9, 9.4 Hz, 1H), 4.96 (dd, J = 10.3, 9.5 Hz, 1H), 4.54–4.49 (m, 3H), 4.25–4.21 (m, 1H), 4.19–4.15 (m, 1H), 4.04 (dd, J = 11.1, 2.6 Hz, 1H), 3.98 (dd, J = 11.1, 5.1 Hz, 1H), 2.39 (s, 3H), 1.94 (s, 3H), 1.93 (s, 3H), 1.86 (s, 3H); 13C NMR (125 MHz, CDCl3) δ 171.08, 170.31, 169.06, 145.21, 132.23, 132.12, 132.07, 131.91, 131.86, 129.86, 128.05, 119.06, 118.93, 95.65, 95.60, 69.73, 69.37, 68.79, 67.67, 66.99, 51.69, 51.63, 22.87, 21.63, 20.58, 20.45; 31P NMR (500 MHz, CDCl3) δ −2.77; APCI-HRMS calculated for C25H34NO13PSNa [M + Na]+ 642.1488, found 642.1398
Diallyl(6-O-p-methylbenzenesulfonate-N-acetyl-glucosamine)-α-1-phosphate (15)
Compound 14 (669 mg, 1.08 mmol) was resuspended is methanol (10 mL). Freshly made NaOMe was added dropwise until pH 9–10 was reached. The reaction was monitored by TLC (10% methanol in CH2Cl2) and was determined complete after 1.5 h. Upon completion, the reaction was quenched with acetic acid and concentrated to afford the crude. Silica gel chromatography (7% methanol in CH2Cl2) yielded the product (282 mg, 57% yield): 1H NMR (500 MHz, CD3OD) 7.79 (d, 2H, J = 8.3 Hz), 7.44 (d, J = 8.5 Hz, 2H), 6.02–5.92 (m, 2H), 5.59 (dd, J = 8.5, 8.5 Hz, 1H), 5.42–5.37 (m, 2H), 5.29–5.26 (m, 2H), 4.60–4.55 (m, 4H), 4.32 (dd, J = 11.0, 1.9 Hz, 1H), 4.21 (dd, J = 11.0, 5.7 Hz, 1H), 3.93–3.89 (m, 1H), 3.86–3.82 (m, 1H), 3.64 (dd, J = 10.8, 8.8 Hz, 1H), 3.36 (t, J = 8.7 Hz, 1H), 2.46 (s, 3H), 1.98 (s, 3H); 13C NMR (125 MHz, CDCl3) δ 173.75, 146.59, 134.05, 133.63, 133.58, 133.57, 133.53, 131.02, 129.09, 118.89, 118.87, 97.39, 97.34, 73.35, 71.15, 71.12, 70.22, 69.89, 69.84, 69.79, 69.75, 55.08, 55.01, 22.51, 21.62; 31P NMR (500 MHz, CDCl3) δ −2.51; APCI-HRMS calculated for C21H30NO11PSNa [M + Na]+ 558.1169, found 558.1154
Diallyl(6-azido-6-deoxy-N-acetyl-glucosamine)-α-1-phosphate (16)
Compound 15 (282 mg, 0.527 mmol) was coevaporated from toluene and resuspended in N,N′-dimethylformamide (20 mL) under an argon atmosphere. Sodium azide (172 mg, 2.63 mmol) was added, and the reaction reaction warmed to 60 °C. The reaction proceeded for 48 h after which time the reaction was concentrated and purified over silica gel (7:2:1 EtOAc:methanol:water) to afford the product (151 mg, 71% yield): 1H NMR (500 MHz, CD3OD) 6.07–5.73 (m, 2H), 5.40 (dd, J = 7.4, 3.3 Hz, 1H), 5.27–5.20 (m, 2H), 5.06–5.01 (m, 2H), 4.34–4.31 (m, 2H), 4.27–4.24 (m, 2H), 3.89–3.81 (m, 2H), 3.59 (dd, J = 10.6, 8.9 Hz, 1H), 3.49 (dd, J = 13.2, 2.5 Hz, 1H), 3.36–3.31 (m, 2H), 3.22–3.21 (m, 1H), 1.91 (s, 3H); 13C NMR (125 MHz, CDCl3) δ 173.81, 135.99, 135.92, 116.18, 116.15, 95.59, 95.54, 73.63, 72.48, 72.37, 67.33, 67.29, 67.17, 67.13, 55.33, 55.27, 52.63, 22.85; 31P NMR (500 MHz, CDCl3) δ 0.66, −1.37.
6-Azido-6-deoxy-N-acetyl-glucosamine-1-phosphate (17)52
Compound 16 (50 mg, 0.123 mmol) was resuspended in 4 mL of methanol:THF (1:1) under an argon atmosphere. p-Toluenesulfinic acid sodium salt (44 mg, 0.246 mmol) and Tetrakis(triphenylphosphine)-Palladium(0) (11 mg, 0.095 mmol) were added. The the reaction was monitored by TLC (3:2:1 N-propanol:acetic acid:water) and determined complete. The reaction was then evaporated under reduced pressure and purified by silica gel chromatography (3:2:1 N-propanol:acetic acid:water). The sugar was further purified by RP-HPLC over a C18 semipreparative column (The Nest Group) using a 0% B isocratic flush over 10 min followed by a 0–50% B linear gradient from 10 to 20 min and a second linear gradient 50–0% B 20–30 min, tR = 2.5–4 min (buffer A: 0.1% TFA in water, buffer B: 0.1% TFA, 90% ACN in water): 1H NMR (500 MHz, D2O) δ 5.33 (dd, J = 7.3, 3.4 Hz, 1H), 3.94–3.83 (m, 2H), 3.68 (dd, J = 10.5, 9.1 Hz, 1H), 3.64–3.56 (m, 2H), 3.53–3.43 (m, 2H), 1.95 (s, 3H); 13C NMR (125 MHz, D2O) δ 174.63, 163.38, 163.10, 162.82, 162.53, 119.78, 117.46, 115.14, 112.82, 93.43, 93.38, 71.34, 70.42, 70.35, 58.59, 53.73, 53.66, 50.67, 33.71, 21.92; 31P NMR (500 MHz, D2O) δ −1.65; ESI-MS calculated for C8H14N4O8P [M – H]− 323.04, found 325.00.
Acknowledgments
K.N.C and B.W.Z are fellows of the National Science Foundation Graduate Research Fellowship Program (DGE-0937362). This research was supported by the Damon Runyon Cancer Research Foundation (M.R.P), the Concern Foundation (M.R.P), the Ligue Nationale contre le Cancer, committees 44 and 45 (F.P. and V.P.), and in part by the US National Cancer Institute of the US National Institutes of Health (CCSG P30CA014089). LC–MS analysis was performed at the mass spectrometry facility of the Centre de Biophysique Moléculaire (CBM). LC–MS/MS proteomic analysis was performed at the Rockefeller University Proteomics Resource Center. Flow cytometry was performed in the USC Flow Cytometry Core Facility. Measurement of the MTS assay was performed at the USC Nano Biophysics Core Facility. The authors thank J. M. Conn, J. Fernandez and H. Molina for assistance with proteomics data analysis and C. Colas and G. Gabant (CBM) for assistance with LC–MS analysis.
Supporting Information Available
Supporting figures, NMR characterization, and proteomic data tables. This material is available free of charge via the Internet at http://pubs.acs.org.
Author Contributions
# K. N. Chuh and B. W. Zaro contributed equally to this manuscript.
The authors declare no competing financial interest.
Funding Statement
National Institutes of Health, United States
Supplementary Material
References
- Torres C. R.; Hart G. W. J. Biol. Chem. 1984, 259, 3308. [PubMed] [Google Scholar]
- Holt G. D.; Hart G. W. J. Biol. Chem. 1986, 261, 8049. [PubMed] [Google Scholar]
- Zachara N. E.; Hart G. W. Chem. Rev. 2002, 102, 431. [DOI] [PubMed] [Google Scholar]
- Love D. C.; Hanover J. A. Sci. STKE 2005, 2005, re13. [DOI] [PubMed] [Google Scholar]
- Vocadlo D. J. Curr. Opin Chem. Biol. 2012, 16, 488. [DOI] [PubMed] [Google Scholar]
- Shafi R.; Iyer S. P.; Ellies L. G.; O’Donnell N.; Marek K. W.; Chui D.; Hart G. W.; Marth J. D. Proc. Natl. Acad. Sci. U. S. A. 2000, 97, 5735. [DOI] [PMC free article] [PubMed] [Google Scholar]
- Sinclair D. A. R.; Syrzycka M.; Macauley M. S.; Rastgardani T.; Komljenovic I.; Vocadlo D. J.; Brock H. W.; Honda B. M. Proc. Natl. Acad. Sci. U. S. A. 2009, 106, 13427. [DOI] [PMC free article] [PubMed] [Google Scholar]
- Yang Y. R.; Song M.; Lee H.; Jeon Y.; Choi E.-J.; Jang H.-J.; Moon H. Y.; Byun H.-Y.; Kim E.-K.; Kim D. H.; Lee M. N.; Koh A.; Ghim J.; Choi J. H.; Lee-Kwon W.; Kim K. T.; Ryu S. H.; Suh P.-G. Aging Cell 2012, 11, 439. [DOI] [PubMed] [Google Scholar]
- Hart G. W.; Slawson C.; Ramirez-Correa G.; Lagerlof O. Annu. Rev. Biochem. 2011, 80, 825. [DOI] [PMC free article] [PubMed] [Google Scholar]
- Yuzwa S. A.; Shan X.; Macauley M. S.; Clark T.; Skorobogatko Y.; Vosseller K.; Vocadlo D. J. Nat. Chem. Biol. 2012, 8, 393. [DOI] [PubMed] [Google Scholar]
- Marotta N. P.; Cherwien C. A.; Abeywardana T.; Pratt M. R. ChemBioChem 2012, 13, 2665. [DOI] [PubMed] [Google Scholar]
- Caldwell S. A.; Jackson S. R.; Shahriari K. S.; Lynch T. P.; Sethi G.; Walker S.; Vosseller K.; Reginato M. J. Oncogene 2010, 29, 2831. [DOI] [PubMed] [Google Scholar]
- Krzeslak A.; Pomorski L.; Lipinska A. Int. J. Mol. Med. 2010, 25, 643. [DOI] [PubMed] [Google Scholar]
- Kang J.; Park S.; Ji S.; Jang I.; Park S.; Kim H.; Kim S.; Yook J.; Park Y.; Roth J.; Cho J. J. Biol. Chem. 2009, 284, 34777. [DOI] [PMC free article] [PubMed] [Google Scholar]
- Shi Y.; Tomic J.; Wen F.; Shaha S.; Bahlo A.; Harrison R.; Dennis J. W.; Williams R.; Gross B. J.; Walker S.; Zuccolo J.; Deans J. P.; Hart G. W.; Spaner D. E. Leukemia 2010, 24, 1588. [DOI] [PMC free article] [PubMed] [Google Scholar]
- Banerjee P. S.; Hart G. W.; Cho J. W. Chem. Soc. Rev. 2013, 42, 4345. [DOI] [PMC free article] [PubMed] [Google Scholar]
- Rexach J. E.; Clark P. M.; Hsieh-Wilson L. C. Nat. Chem. Biol. 2008, 4, 97. [DOI] [PMC free article] [PubMed] [Google Scholar]
- Tornøe C. W.; Christensen C.; Meldal M. J. Org. Chem. 2002, 67, 3057. [DOI] [PubMed] [Google Scholar]
- Rostovtsev V. V.; Green L. G.; Fokin V. V.; Sharpless K. B. Angew. Chem., Int. Ed. Engl. 2002, 41, 2596. [DOI] [PubMed] [Google Scholar]
- Sletten E. M.; Bertozzi C. R. Acc. Chem. Res. 2011, 44, 666. [DOI] [PMC free article] [PubMed] [Google Scholar]
- Best M. D. Biochemistry 2009, 48, 6571. [DOI] [PubMed] [Google Scholar]
- Dube D.; Bertozzi C. Curr. Op. Chem. Biol. 2003, 7, 616. [DOI] [PubMed] [Google Scholar]
- Grammel M.; Hang H. C. Nat. Chem. Biol. 2013, 9, 475. [DOI] [PMC free article] [PubMed] [Google Scholar]
- Vocadlo D.; Hang H.; Kim E.; Hanover J.; Bertozzi C. Proc. Natl. Acad. Sci. U. S. A. 2003, 100, 9116. [DOI] [PMC free article] [PubMed] [Google Scholar]
- Nandi A.; Sprung R.; Barma D. K.; Zhao Y.; Kim S. C.; Falck J. R.; Zhao Y. Anal. Chem. 2006, 78, 452. [DOI] [PubMed] [Google Scholar]
- Zaro B. W.; Yang Y.-Y.; Hang H. C.; Pratt M. R. Proc. Natl. Acad. Sci. U. S. A. 2011, 108, 8146. [DOI] [PMC free article] [PubMed] [Google Scholar]
- Yarema K. J.; Bertozzi C. R. Genome Biol. 2001, 10.1186/gb-2001-2-5-reviews0004. [DOI] [PMC free article] [PubMed] [Google Scholar]
- Banerjee P. S.; Ostapchuk P.; Hearing P.; Carrico I. J. Am. Chem. Soc. 2010, 132, 13615. [DOI] [PMC free article] [PubMed] [Google Scholar]
- Boyce M.; Carrico I. S.; Ganguli A. S.; Yu S.-H.; Hangauer M. J.; Hubbard S. C.; Kohler J. J.; Bertozzi C. R. Proc. Natl. Acad. Sci. U. S. A. 2011, 108, 3141. [DOI] [PMC free article] [PubMed] [Google Scholar]
- Bateman L. A.; Zaro B. W.; Chuh K. N.; Pratt M. R. Chem. Commun. 2013, 49, 4328. [DOI] [PMC free article] [PubMed] [Google Scholar]
- Zaro B. W.; Bateman L. A.; Pratt M. R. Bioorg. Med. Chem. Lett. 2011, 21, 5062. [DOI] [PubMed] [Google Scholar]
- Alfaro J. F.; Gong C.-X.; Monroe M. E.; Aldrich J. T.; Clauss T. R. W.; Purvine S. O.; Wang Z.; Camp D. G.; Shabanowitz J.; Stanley P.; Hart G. W.; Hunt D. F.; Yang F.; Smith R. D. Proc. Natl. Acad. Sci. U. S. A. 2012, 109, 7280. [DOI] [PMC free article] [PubMed] [Google Scholar]
- Lubas W. A.; Smith M.; Starr C. M.; Hanover J. A. Biochemistry 1995, 34, 1686. [DOI] [PubMed] [Google Scholar]
- Mayer A.; Gloster T. M.; Chou W. K.; Vocadlo D. J.; Tanner M. E. Bioorg. Med. Chem. Lett. 2011, 21, 1199. [DOI] [PubMed] [Google Scholar]
- Pastuszak I.; Drake R.; Elbein A. D. J. Biol. Chem. 1996, 271, 20776. [DOI] [PubMed] [Google Scholar]
- Pouilly S.; Bourgeaux V.; Piller F.; Piller V. ACS Chem. Biol. 2012, 7, 753. [DOI] [PubMed] [Google Scholar]
- Nishitani Y.; Maruyama D.; Nonaka T.; Kita A.; Fukami T. A.; Mio T.; Yamada-Okabe H.; Yamada-Okabe T.; Miki K. J. Biol. Chem. 2006, 281, 19740. [DOI] [PubMed] [Google Scholar]
- Yuzwa S. A.; Macauley M. S.; Heinonen J. E.; Shan X.; Dennis R. J.; He Y.; Whitworth G. E.; Stubbs K. A.; McEachern E. J.; Davies G. J.; Vocadlo D. J. Nat. Chem. Biol. 2008, 4, 483. [DOI] [PubMed] [Google Scholar]
- Saxon E.; Luchansky S. J.; Hang H. C.; Yu C.; Lee S. C.; Bertozzi C. R. J. Am. Chem. Soc. 2002, 124, 14893. [DOI] [PubMed] [Google Scholar]
- Hang H. C.; Yu C.; Kato D. L.; Bertozzi C. R. Proc. Natl. Acad. Sci. U. S. A. 2003, 100, 14846. [DOI] [PMC free article] [PubMed] [Google Scholar]
- Palaniappan K. K.; Hangauer M. J.; Smith T. J.; Smart B. P.; Pitcher A. A.; Cheng E. H.; Bertozzi C. R.; Boyce M. CellReports 2013, 5, 546. [DOI] [PMC free article] [PubMed] [Google Scholar]
- Kreppel L. K.; Blomberg M. A.; Hart G. W. J. Biol. Chem. 1997, 272, 9308. [DOI] [PubMed] [Google Scholar]
- Comer F. I.; Hart G. W. Biochemistry 2001, 40, 7845. [DOI] [PubMed] [Google Scholar]
- Lazarus M. B.; Nam Y.; Jiang J.; Sliz P.; Walker S. Nature 2011, 469, 564. [DOI] [PMC free article] [PubMed] [Google Scholar]
- Patterson D. M.; Nazarova L. A.; Xie B.; Kamber D. N.; Prescher J. A. J. Am. Chem. Soc. 2012, 134, 18638. [DOI] [PubMed] [Google Scholar]
- Cole C. M.; Yang J.; Šečkutė J.; Devaraj N. K. ChemBioChem 2013, 14, 205. [DOI] [PMC free article] [PubMed] [Google Scholar]
- Niederwieser A.; Späte A.-K.; Nguyen L. D.; Jüngst C.; Reutter W.; Wittmann V. Angew. Chem., Int. Ed. 2013, 52, 4265. [DOI] [PubMed] [Google Scholar]
- Bourgeaux V.; Piller F.; Piller V. Bioorg. Med. Chem. Lett. 2005, 15, 5459. [DOI] [PubMed] [Google Scholar]
- Charron G.; Zhang M. M.; Yount J. S.; Wilson J.; Raghavan A. S.; Shamir E.; Hang H. C. J. Am. Chem. Soc. 2009, 131, 4967. [DOI] [PubMed] [Google Scholar]
- Kimura K.; Nishichi A.; Yamashita Y. Polym. Adv. Technol. 2004, 15, 313. [Google Scholar]
- Sharma M.; Petrie C. R.; Korytnyk W. Carbohydr. Res. 1988, 175, 25. [DOI] [PubMed] [Google Scholar]
- Cai L.; Guan W.; Kitaoka M.; Shen J.; Xia C.; Chen W.; Wang P. G. Chem. Commun. 2009, 2944. [DOI] [PubMed] [Google Scholar]
Associated Data
This section collects any data citations, data availability statements, or supplementary materials included in this article.