Abstract
Purpose
To assess the feasibility of spatial-temporal constrained reconstruction for accelerated regional lung perfusion using highly undersampled dynamic contrast-enhanced (DCE) 3D radial MRI with ultra-short echo time (UTE).
Methods
A combined strategy was used to accelerate DCE MRI for 3D pulmonary perfusion with whole lung coverage. A highly undersampled 3D radial UTE MRI acquisition was combined with an iterative constrained reconstruction exploiting principal component analysis and wavelet soft-thresholding for dimensionality reduction in space and time. The performance of the method was evaluated using a 3D fractal-based DCE digital lung phantom. Simulated perfusion maps and contrast enhancement curves were compared to ground truth using the structural similarity index (SSIM) to determine robust threshold and regularization levels. Feasibility studies were then performed in a canine and a human subject with 3D radial UTE (TE = 0.08 ms) acquisition to assess feasibility of mapping regional 3D perfusion.
Results
The method was able to accurately recover perfusion maps in the phantom with a nominal isotropic spatial resolution of 1.5 mm (SSIM of 0.949). The canine and human subject studies demonstrated feasibility for providing artifact-free perfusion maps in a simple 3D breath-held acquisition.
Conclusion
The proposed method is promising for fast and flexible 3D pulmonary perfusion imaging.
Keywords: MRI, lung perfusion, principal component analysis, wavelets, image reconstruction, compressed sensing, radial, UTE
INTRODUCTION
Robust methods for the assessment of regional pulmonary structure and function are highly valuable for the early detection and accurate diagnosis of a vast array of pulmonary diseases. Unfortunately, accurate assessment requires separate modalities for structure and function. Currently nuclear imaging techniques including scintigraphy, single photon emission tomography (SPECT) [1,2] and positron emission tomography (PET) [3] are the most popular imaging techniques to measure pulmonary ventilation and perfusion. These imaging modalities require radioactive labeled tracers and have intrinsically low spatial resolution that limits their utility for diagnosis of regionally heterogeneous lung diseases. In recent years, dual-energy iodine-enhanced computed tomography (CT) has been actively investigated for perfusion measurements [4]. Iodine-enhanced CT provides high spatial resolution, fast acquisition with whole lung coverage, and short-examination times. Unfortunately, the high resolution obtained by CT is associated with substantial radiation exposure, especially for longitudinal follow-up examinations in children, young adults or pregnant women [5,6].
Magnetic resonance imaging (MRI), in contrast to nuclear medicine and CT, does not rely on ionizing radiation. Due to well-known physical and technical challenges for visualization of low proton density tissue, especially in the presence of respiratory and cardiac motion, pulmonary MRI development has been slow. However, recent advances in MR technology have significantly improved pulmonary MRI. Specifically, rapid short echo time pulse sequences with optimized data acquisition trajectories for static or time-resolved functional imaging combined with multi-channel phased array coils for parallel imaging have shown great promise in overcoming the conventional limitations of pulmonary MRI. Emerging pulmonary MRI methods now offer a broad spectrum of methods for imaging of lung morphology and physiology by employing standard proton, hyperpolarized gas or oxygen-enhanced techniques [7-11].
One of the most clinically established methods for the study of lung function is perfusion MRI using dynamic contrast-enhanced (DCE) imaging [12,13]. DCE MRI utilizes a time-resolved acquisition to image and characterize the dynamics of an intravenously delivered, T1 shortening contrast agent. Current imaging protocols apply Cartesian three-dimensional (3D) time-resolved T1-weighted sequences with some form of view sharing [14-16]. Simple visual assessment is commonly used clinically; however, descriptive kinetic parameters using tracer models are in development [17].
Quantitative kinetic modeling of DCE MRI would likely yield more powerful diagnostic information, especially for longitudinal surveillance. Unfortunately, accurate quantification requires high temporal resolution imaging that is robust to confounding factors. With the application of parallel imaging and k-space view sharing, several techniques have demonstrated spatial and temporal resolutions on the order of 1.5 × 1.5 mm2 with 4-5 mm slice thickness at a rate of 1-2 volumes per second [7]. Unfortunately, such acquisition techniques depend on substantial view sharing, which blurs hemodynamics temporally and thus limits accurate quantification of flow dependent perfusion parameters [18].
An attractive solution for time-resolved DCE MRI with 3D lung coverage is 3D radial acquisition with ultra-short echo time (UTE) [19,20]. The sequence allows for sampling the extremely short echoes, which improves signal-to-noise ratio in the pulmonary parenchyma. Another important advantage of the UTE sequence is its inherent robustness against motion and pulsation artifacts. However, significant radial undersampling is required to achieve sufficient temporal resolution for time-resolved pulmonary perfusion imaging. When paired with conventional reconstruction, undersampling of 3D radial k-space trajectory results in aliasing artifact [21]. However, the spatial incoherence of these artifacts makes undersampled 3D radial imaging an ideal candidate for application of an advanced reconstruction approach, such as compressed sensing (CS) [22]. A principal requirement of CS is availability of sparse representation of an image or image series in some transform basis. While typical lung images possess only limited spatial sparsity, DCE MRI acquisitions are characterized by high level of spatial-temporal correlations -- in other words, these acquisitions are sparse in the combined spatial-temporal domain.
Several approaches have been proposed for sparse representation of time-resolved data [23-24]. One of the most efficient and simple temporal basis sets can be obtained using principal component analysis (PCA). In fact, this approach has been applied successfully in myocardial perfusion and phase contrast measurements [25-27]. PCA can represent dynamic data with only a few temporal basis functions calculated from synchronously acquired low-resolution training data. If the PCA compression allows significant reduction of the problem’s dimensionality compared to the number of images in the series, the spatial-temporal data sampling requirements may be significantly relaxed.
In this work we propose a novel DCE MRI technique that combines a time-resolved 3D UTE acquisition with constrained reconstruction for quantitative assessment of regional lung perfusion. High isotropic spatial resolution is achieved by acquiring incomplete data for each time frame and reconstructing it using dimensionality reduction in temporal domain via principal component analysis and soft-thresholding of wavelet coefficients in spatial domain. Experiments were performed in a fractal-based digital lung phantom and in vivo to demonstrate the practical feasibility of the method.
METHODS
Fractal-based digital lung phantom
In order to assess the performance of the proposed reconstruction technique we created a fractal-based 3D digital lung phantom. A branching tree algorithm [28, 29] based on morphometric parameters of the human lung was applied to model the fractal geometry of the pulmonary vessel network. Lung is a highly perfused organ with a vascular network based on fractal morphology. This system permits the vasculature to transport a large volume of blood at low energy cost, while being distensible and sustaining high-pressure changes. The branching tree algorithm was used to generate arterial and venous networks in a segmented lung volume that was obtained from a real 3D morphological MRI acquisition. Images of the lung vasculature were generated on 5123 matrix. Vessels generated below the matrix resolution were blurred using a Gaussian filter to reflect the partial volume mixing of the pulmonary capillary bed at the nominal 1.5 mm resolution expected for the subsequent in vivo experiments. A time of arrival of the contrast agent was assigned to every branch generation. This numerical phantom served as a reference standard for objective evaluation and optimization of the image reconstruction method, including the calculation of quantitative parameters describing the pulmonary perfusion obtained from highly undersampled data.
The signal enhancement due to the passage of contrast agent through the arterial network, capillary bed and venous network was simulated using the gamma variate function (Eq. 1), which is often used to describe the dispersion of a bolus due to blood flow:
| [Eq. 1] |
where: t – time, α, β – define shape of the curve.
The pulmonary recirculation of the contrast agent was added to the model in Eq. 1 to better reflect in vivo conditions. The signal enhancement time-course was described by using a superposition of three gamma variate functions with different shapes and delay times such that the peak contrast enhancement of the pulmonary recirculation occurred at twice the time to first pass peak enhancement. To mimic regional disease, a wedge-shaped perfusion defect was introduced in the left upper lung. The maximum amplitude of the gamma variate functions characterizing the contrast-enhancement in the perfusion defect was decreased by a factor of 2 and the time to maximal contrast-enhancement was further delayed by 2 seconds.
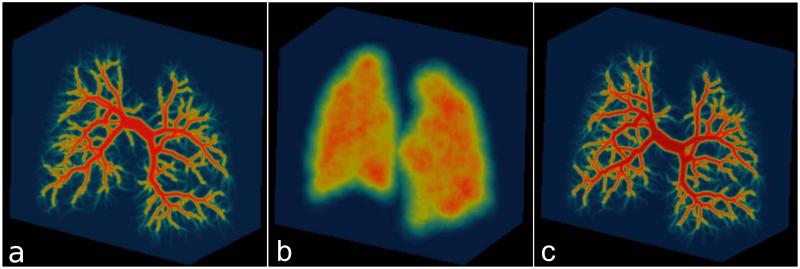
Subsequently, an inverse gridding procedure was performed on the generated time-resolved lung phantom data. The k-space data were sampled using a time-resolved 3D radial trajectory with an interleaved bit-reversed projection reordering (7986 unique center-out projections over 33 seconds). Noise was added to the data at the level of 3% of mean absolute k-space values. The sampling rate is not changed dynamically throughout the readout, despite changes in the strength of readout. Therefore, the electronic noise distribution should be identical for all samples and was approximated by complex Gaussian noise. Sensitivity profiles of a virtual 16-channel chest array coil were simulated using the Biot-Savart’s law. Figure 1 shows a projection image of the arterial tree, parenchymal component, and venous tree. The base code for the generation of fractal phantoms in available here: https://bitbucket.org/kmjohnson3/mri-fractal-phantom/overview
Figure 1.
Visualization of the arterial (a), parenchymal (b) and venous (c) compartments of the fractal based digital lung phantom.
MRI data acquisitions
The first in vivo DCE dataset was acquired in a canine subject (weight 11.7 kg, age 10 months). The examination was a part of a larger animal study, which was approved by the local Institutional Animal Care and Use Committee. Anesthesia was induced by propofol (2-6 mg/kg i.v.), midazolam (0.2 mg/kg bolus, 0.2 mg/kg/hr i.v. infusion) and fentanyl (5 μg/kg bolus, 10 μg/kg/hr i.v. infusion) and maintained by isoflurane in 100% oxygen after endotracheal intubation. During the examination the animal underwent intermittent positive pressure ventilation. A venous sheath was positioned in the cubical vein for contrast agent administration. The imaging of the canine subject was performed on a whole-body 3T scanner (MR750, GE Healthcare, Waukesha, WI, USA) with a gradient peak amplitude of 50 mT/m and a maximum slew rate of 200 T/m/s. Twenty elements of a 32-channel chest phased array coil (Torso Array, NeoCoil, Pewaukee, WI, USA) were used, providing for complete coverage of the thorax. The animal was placed in the supine position in the scanner. Time-resolved 3D radial UTE data with an interleaved bit-reversed projection reordering were acquired simultaneously with the injection of 0.1 mmol/kg of gadobenate dimeglumine (MultiHance, Bracco Diagnostics, Princeton, NJ) at the flow rate of 2 mL/s followed by a 17 mL saline flush. The imaging parameters were as follows: TR/TE = 3.8/0.08 ms, 1 ms readout time, flip angle = 15°, field-of-view (FOV) = 2503 mm3, matrix = 2243, nominal resolution = 1.12 mm3, bandwidth = 250 kHz, 7986 unique center-out projections. The 3D radial UTE sequence used slab-selective radiofrequency excitation with limited FOV, variable density read-out gradients, and radial oversampling along projections (FOV doubling). Details regarding the implementation of the pulse sequence can be found in Johnson et al. [19]. The acquisition time for one 3D volume was 1 s. 33 consecutive undersampled volumes were acquired during the end expiratory breath-hold.
The second in vivo DCE dataset was acquired using the same technique in a 23 year old female human subject with Factor V Leiden. The patient had no history of lung disease. The examination was performed on a whole-body 1.5T scanner (MR 450w, GE Healthcare, Waukesha, WI, USA) with a gradient peak amplitude of 33 mT/m and a maximum slew rate of 120 T/m/s, using 18 elements of a 32-channel chest phased array coils (GE GEMS, Waukesha, WI, USA). The measurement started after IV administration of 0.05 mmol/kg of gadobenate dimeglumine (MultiHance, Bracco Diagnostics, Princeton, NJ) followed by a 35 mL saline flush at the flow rate of 4.0 mL/s. The imaging parameters of the 3D UTE sequence were: TR/TE = 3.3/0.08 ms, 1 ms readout time, flip angle = 15°, field-of-view (FOV) = 4003 mm3, matrix = 2563, nominal resolution = 1.56 mm3, bandwidth = 250 kHz, 7986 unique center-out projections. The acquisition time for one 3D volume was 1 s. 29 consecutive undersampled volumes were acquired during the end expiratory breath-hold.
Iterative reconstruction of time-resolved data
The time-resolved 3D UTE data were reconstructed using an iterative algorithm that combined reconstruction in temporal principal component basis (PCB) and spatial domain wavelet soft-thresholding (ST). The PCB assumes that the dynamic image series can be represented as a linear combination of a small number of the chosen temporal principal components. This is a reasonable assumption due to high level of spatial-temporal correlations present in a typical DCE image series [25-27]. Since most of the medical images are characterized by a high degree of compressibility in the spatial domain, a wavelet transform can be used to represent them as a vector of sparse coefficients. Both PCB and wavelet transforms were integrated into a cost function that was solved iteratively to enforce consistency with the PC and measured data, s, while minimizing the L1-norm of the wavelet coefficients:
| [Eq. 2] |
where f is the vectorized image series, W is the wavelet transform, E is the encoding matrix (consisting of Fourier and coil sensitivity terms), and D is the basis of chosen temporal principal components. This problem may be solved by generating a sequence of iterations, n, using a projection gradient technique [30] with an additional model-consistency projection [31,32] as follows:
| [Eq. 3] |
where α is a step size [27], PD = DDH, Sτ = W−1Tτ (Wf), and Tτ is the soft-thresholding operator [33].
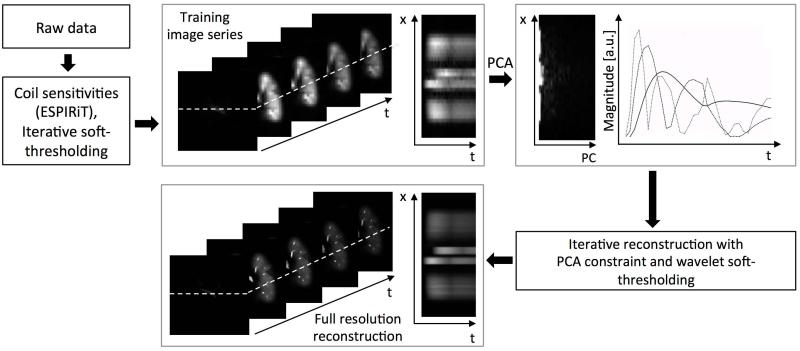
The algorithm is summarized in Figure 2. First, low resolution training images were reconstructed from the raw data using wavelet regularization to minimize noise and aliasing artifacts. Subsequently, the principal component analysis (PCA) was performed on the reconstructed training data and principal components corresponding to the largest singular values (comprising 95% of total energy) were chosen as a temporal basis. The dimensionality reduction through PCA was performed in x-t space as proposed in [34]. Then, the high-resolution time-resolved data set was reconstructed as a sequence of iterations, n, according to Eq. 3:
for k = 1: n
end
Figure 2.
Workflow of the principal component basis with wavelet soft-thresholding (PCB+ST) reconstruction algorithm. Raw data is used to calculate the time-resolved training data at low spatial resolution using wavelet regularization. The principal component analysis (PCA) was performed on the reconstructed training data set. Several principal components corresponding to largest singular values were chosen as a new temporal basis. Subsequently, the high-resolution time-resolved data set was iteratively reconstructed using the PCA constraint and/or wavelet soft-thresholding depending on the reconstruction tested.
The L1 norm minimization is performed through adaptive data-driven Bayesian shrinkage via wavelet soft-thresholding [33]. The goal of the algorithm is to find the soft-threshold τ, which minimizes Bayesian risk in each subband of wavelet decomposition. It assumes that the signal and noise being generalized are both Gaussian distributed. A nearly optimal threshold is found to be σ2/σx, where σ2 is the noise variance and the signal variance.
Prior to the image reconstruction, coil compression was performed on raw k-space data by application of the singular value decomposition method [35]. Subsequently, coil sensitivities were calculated using the ESPIRiT algorithm [36]. Each training data set was reconstructed on a 323 isotropic matrix reconstructed using 50 iterations of wavelet soft-thresholding. The discrete wavelet transform was performed using Daubechies wavelets with support length 7.
Images were also reconstructed using several reference methods for comparison with the proposed combined method (PCB-ST). These reference methods included: principal components basis without wavelet soft-thresholding (PCB), partially parallel imaging with localized sensitivities (PILS) [37], fast iterative shrinkage thresholding algorithm (FISTA) [38], and PILS combined with the k-space adaptive filter temporal view sharing technique [21] referred as to PILS-VS. The k-space adaptive filter had a width of 3 seconds at the center of k-space and quadratically increased to include 10 seconds at the edge of k-space. The reconstructions of numerical lung phantom and animal subject were performed on a 2243 matrix with an undersampling factor of 651; human data were reconstructed on a 2563 matrix with an undersampling factor of 747. The image quality was assessed by calculation of structural similarity index (SSIM) between the lung phantom ground truth reference and reconstructed datasets. The reconstruction algorithms were implemented in C++ as stand-alone software (GNU Compiler Collection 64-bit, Linux operating system). PCA was implemented using singular value decomposition (Armadillo C++ library, NICTA, Brisbane, Australia). Parallelization of the computational algorithms was performed using multiple CPU cores to accelerate the reconstruction. Each iteration of the PCB+ST algorithm took approximately 20 minutes.
Evaluation of pulmonary perfusion
For the quantitative evaluation of pulmonary perfusion we used the standard singular value decomposition (SVD) technique [39], the indicator dilution theory [40] and the central volume principle [41]. SVD is the most widely adopted deconvolution method, and has been successfully applied in lung perfusion measurements [12]. The arterial input function was estimated from a manually drawn region of interest in the pulmonary artery. Because this was a proof-of-principle experiment, we did not perform corrections for 1) the non-linear relationship between signal and contrast concentration, 2) hematocrit level, and 3) lung density. Parameter maps of estimated pulmonary blood flow (PBF), pulmonary blood volume (PBV), and mean transit time (MTT) were generated by pixel-by-pixel analysis of the time-resolved datasets. Mean values and standard deviations of PBF, PBV and MTT were calculated from regions of interest in the reconstructed data sets located in the lung parenchyma with exclusion of large vessels. All routines for perfusion evaluation were implemented in C++ as a part of the stand-alone reconstruction software.
RESULTS
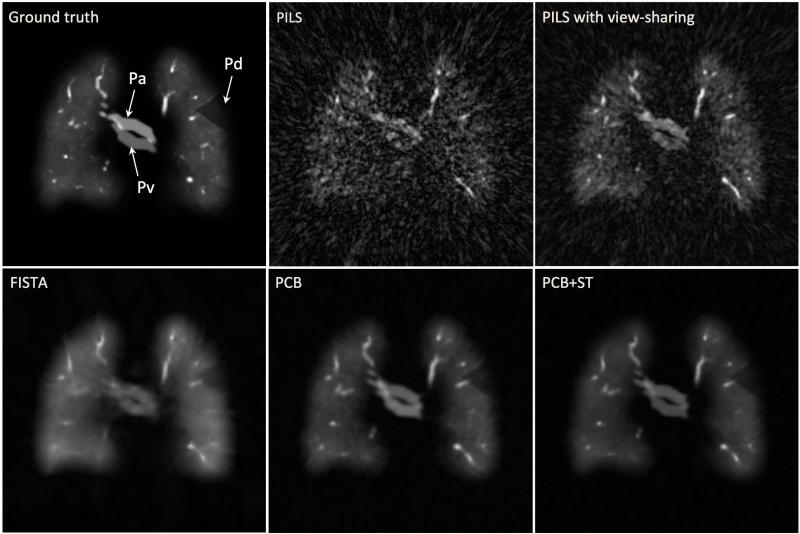
The quality of digital lung phantom images reconstructed using different techniques is compared to the ground truth in Figure 3. A coronal slice from a single time frame of the 3D time-resolved dataset is presented. Simulated pulmonary artery and vein, as well as a wedge-shaped perfusion defect in the upper left lung are indicated (arrows). The results qualitatively support the benefits of combined principal component and wavelet thresholding in conjunction with training data as a means to reduce streak artifact, especially compared to direct reconstructions with PILS and view sharing. The constrained iterative reconstruction incorporating both the PC basis and wavelet soft-thresholding is seen to further improve spatial resolution compared to either the PC basis or wavelet soft-thresholding alone.
Figure 3.
Comparison between the fractal-based 3D digital lung phantom ground truth and the different reconstruction techniques. All images show identical slice orientation and time frame (t=23 s). The arrows indicate pulmonary artery (Pa), pulmonary vein (Pv) and a wedge-shaped region with decreased signal intensity located in peripheral part of the upper left lung (Pd).
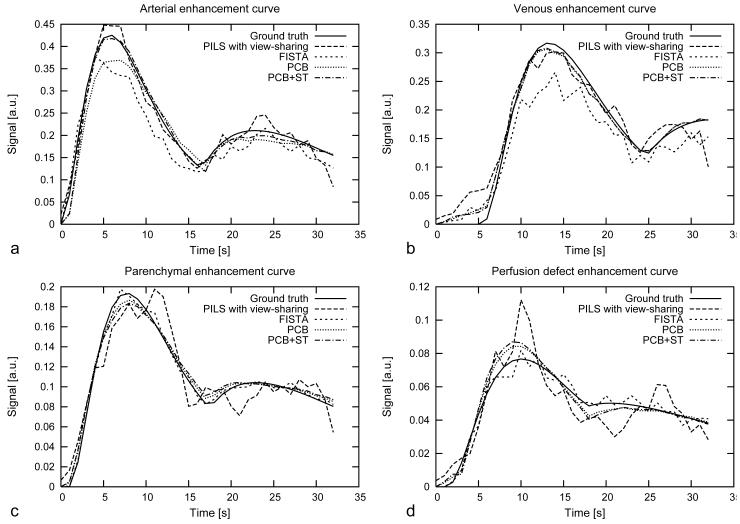
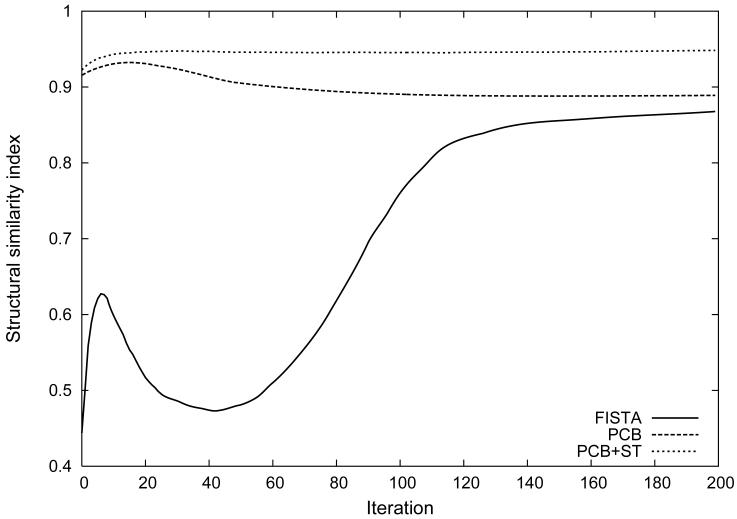
Contrast-enhancement curves calculated in the lung phantom from regions of interest located in the simulated pulmonary artery, vein, lung parenchyma and the wedge-shaped perfusion defect are presented in Figure 4. The curves compare the temporal fidelity and amplitude between the ground truth lung phantom and all reconstruction techniques in different tissue components. Figure 5 shows the SSIM between the ground truth lung phantom and the result of iterative reconstruction algorithms including FISTA, PCB and PCB+ST. SSIM at the 200th iteration was 0.867 for FISTA, 0.889 for PCB and 0.949 for PCB+ST. For non-iterative methods SSIM was 0.752 PILS-VS and 0.459 for PILS alone.
Figure 4.
Contrast-enhancement curves measured in regions of interest located in pulmonary artery (a), pulmonary vein (b), lung parenchyma (c), wedge-shaped perfusion defect (d) for ground truth lung phantom and the time-resolved series reconstructed using different techniques. Mean squared error (MSE) calculated between the reference curves and curves obtained from image reconstructions. The largest MSE was for PILS-VS: 0.1823 (arterial curve), 0.0218 (venous curve), 0.0288 (parenchymal curve), 0.0118 (perfusion defect) and the smallest MSE was for PCB+ST: 0.0055 (arterial curve), 0.0131 (venous curve), 0.0105 (parenchymal curve), 0.0053 (perfusion defect).
Figure 5.
Structural similarity index (SSIM) between the fractal-based ground truth lung phantom and time-resolved data sets reconstructed using FISTA, PCB and PCB+ST. PILS-VS and PILS results are not shown for clarity. For comparison, SSIM was 0.752 for PILS-VS and for 0.459 PILS.
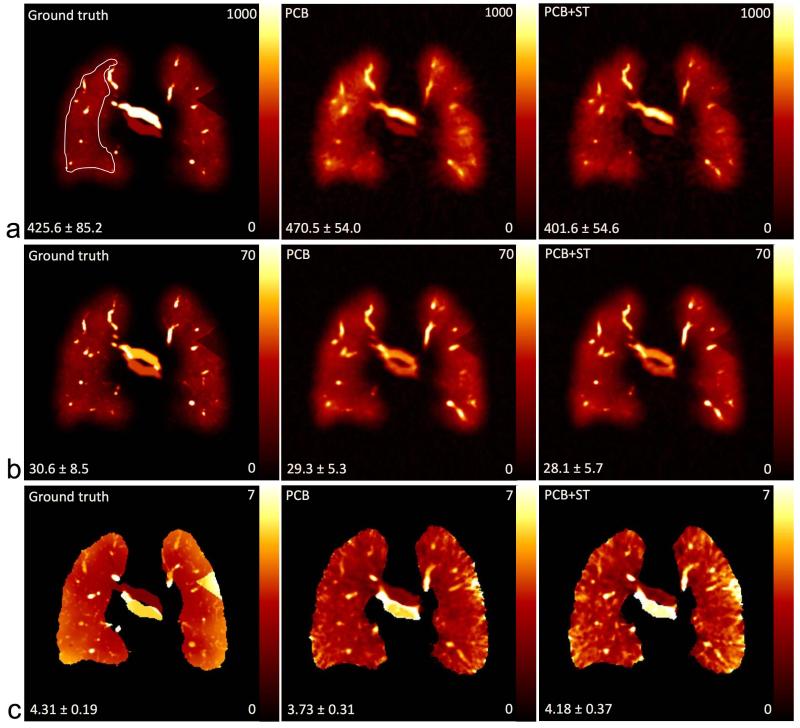
Figure 6 shows the parameter maps of PBF, PBV and MTT from a coronal slice in the digital lung phantom, where the ground truth is compared to the PCB and PCB+ST phantom reconstructions. The mean values and standard deviations of the PBV estimated in a region of interest located in the right lung are presented in Table 1.
Figure 6.
Numerical evaluation of simulated PBF (ml blood / 100ml lung / min) (a), PBV (ml blood / 100ml lung) (b) and MTT (s) (c) in a coronal slice in Figure 3. The values in the lower left side in each image indicate the mean and standard deviation calculated from the region of interest in the whole right lung excluding vessels. The ROI used for the quantitative results in Table 1 is indicated in the upper left panel.
Table 1.
Mean values and standard deviations of estimated pulmonary blood flow (PBF), pulmonary blood volume (PBV) and mean transit time (MTT).
| Digital lung phantom | |||
|---|---|---|---|
| PBF ml blood / 100 ml lung / min |
PBV ml blood / 100ml lung |
MTT s |
|
| Ground truth | 425.6 ± 85.2 | 30.6 ± 8.5 | 4.31 ± 0.19 |
| PCB | 470.5 ± 54.0 | 29.3 ± 5.3 | 3.73 ± 0.31 |
| PCB+ST | 401.6 ± 54.6 | 28.1 ± 5.7 | 4.18 ± 0.37 |
| Canine subject | |||
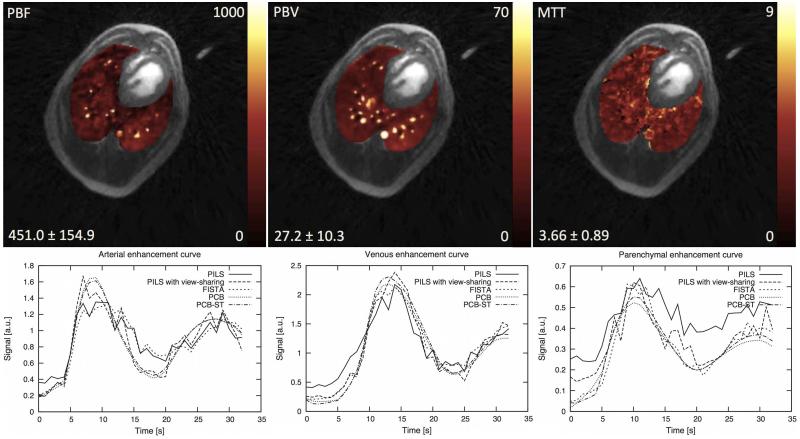
| PCB+ST | 451.0 ± 154.9 | 27.2 ± 10.3 | 3.66 ± 0.89 |
| Human subject | |||
| PCB+ST | 271.5 ± 104.3 | 32.7 ± 12.5 | 7.10 ± 1.43 |
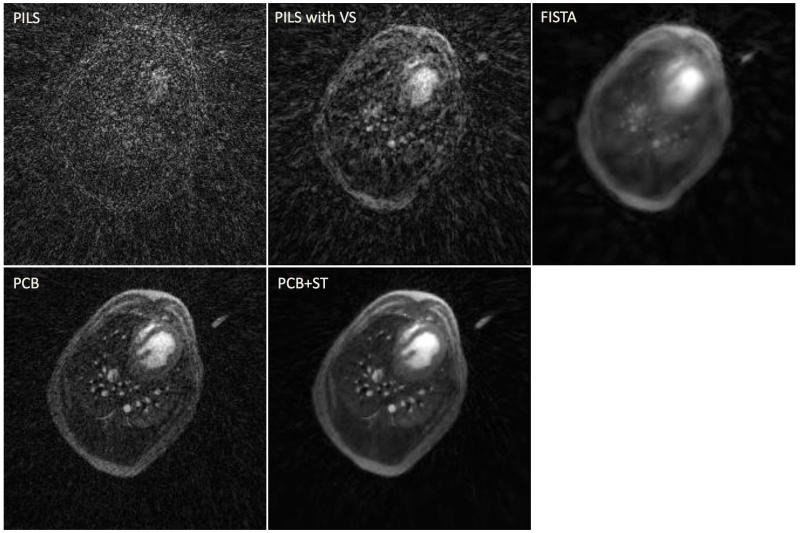
Both in vivo acquisitions were successfully performed. Figure 7 presents a transverse slice of a single time frame obtained from the DCE UTE acquisition in dog and reconstructed using all aforementioned techniques. The estimated perfusion parameter results in dog and human subjects using the datasets reconstructed with PCB+ST are displayed on Figure 8, and Figure 9, respectively. Additionally, contrast-enhancement curves measured in the dog from regions of interest located in the simulated pulmonary artery, vein, lung parenchyma are shown in the figure 8. The mean values and standard deviations of the perfusion parameters are shown in Table 1. Movies showing the dynamics of the contrast agent enhancement in the canine subject for different reconstruction techniques are provided in the supplementary material.
Figure 7.
A transverse slice representing a single time frame obtained from the DCE UTE acquisition in canine subject reconstructed using PILS, PILS with view sharing (VS), FISTA, PCB and PCB+ST.
Figure 8.
Quantitative evaluation of PBF (ml blood / 100ml lung / min), PBV (ml blood / 100ml lung) and MTT (s) showing a transverse slice obtained from the DCE UTE scan in the dog study with parametric color maps overlain on the morphological images. Below contrast-enhancement curves measured in regions of interest located in pulmonary artery, pulmonary vein and lung parenchyma in canine subject for the time-resolved series reconstructed using different techniques.
Figure 9.
Quantitative evaluation of PBF (ml blood / 100ml lung / min), PBV (ml blood / 100ml lung) and MTT (s) in a 23 years old female patient with cardiomyopathy using the proposed PCB+ST method.
DISCUSSION
This study demonstrates the feasibility of applying spatial-temporally constrained reconstruction to time-resolved 3D radial UTE data for improved assessment of regional lung perfusion with whole chest coverage. Substantial under sampling was tolerated while maintaining high spatial resolution (1.56 mm3 in human subject, 1.11 mm3 in dog, matrices 2243-2563) and 1 second temporal resolution. The use of UTE provided better depiction of structural features of the lungs comparing to conventional echo times [19]. Moreover, the isotropic spatial resolution afforded by 3D radial sampling allows for better visual assessment of regional perfusion using multi-planar reformatting and reduces partial volume effects. While some Cartesian (parallel imaging) undersampling methods produce isotropic spatial resolution and full chest coverage [16], most Cartesian approaches such as TRICKS or TWIST [14,15] require tradeoffs in either temporal or spatial resolution, at equivalent breath-hold time.
Another favorable property of 3D radial sampling is its high tolerance for motion artifacts. This is especially important in suppressing pulsation and motion artifacts in the lung near the heart. In the case of Cartesian sampling the propagation of coherent artifacts along the phase encoding direction caused by cardiac pulsation can be problematic.
It should also be noted that the digital simulation provided an effective test-bed for developing and comparing different constrained iterative reconstruction approaches. In particular the simulation allowed direct comparison to ground truth in a system that mimicked the fractal vascular network and contrast-enhancement expected in the lungs in vivo. The inverse gridding process was simulated to resemble a realistic multi-coil (16 channel) 3D UTE acquisition to replicate undersampling expected in an actual acquisition. The combination of PCB+ST algorithms provided the best visual image quality (see Figure 3) and highest SSIM in simulations and was the closest to the ground truth in terms of the arterial enhancement. The combined PCB+ST was therefore the method of choice used in the dog and human subject studies. Specifically, the reconstruction using only the principal component basis (PCB) – similar to techniques proposed in (Liang [34]) – showed a decrease in SSIM at about the 15th iteration. In wavelet soft-thresholding (FISTA), over-smoothing (blurring) was a limitation, likely because the energy in the wavelet coefficients does not distinguish between stochastic noise and structured artifacts. The choice of the wavelet shrinkage method is based on an empirical observation that the wavelet coefficients in the subbands of a natural image can be summarized by a generalized Gaussian distribution, whereas contributions from undersampling artifact is known to be inherently non-random. A key advantage of the combined approach stems from the removal of streak artifact when including the PCB as an additional constraint. This allows for the retention of energy in wavelet coefficients with greater spatial resolution.
Because the training dataset is undersampled, the correct reconstruction of the data is important. We’ve chosen to use an iterative reconstruction of the training dataset before PCA is applied. This necessitates a user-supervised choice of waveforms that are consistent with the general form of contrast agent dynamics. However, it raises an important limitation of the current method. Bulk motion by an uncooperative patient could manifest as a temporal component with high energy in the PCA. Moreover, small local temporal behavior may not be fully described by a linear combination of only a few lower order PC components. While qualitatively represented, the perfusion defect was not reconstructed with as high fidelity as those waveforms representing the main arterial, venous and average parenchymal compartments. To address this limitation, an approach that allows for regularization of the PCA components [31] could potentially retain smaller coefficients to reflect real dynamics in the image data. Alternatively, other approaches based on general assumptions about temporal signal properties such continuity and smoothness may be explored to avoid the use of low-resolution training data [42-44], though detailed comparison with such approaches is beyond the scope of the present work.
There are several other limitations of the current feasibility study. Clearly additional studies are necessary to confirm these early results. However, the possibility for quantitative perfusion is promising. Despite the lack of correction for the nonlinear relationship of signal to contrast concentration in the arterial input function and the lack of correction for either blood hematocrit or lung tissue density, the values calculated in the estimated parametric perfusion maps showed values within physiologic ranges. The expected anterior to posterior gravitational dependent gradient in PBF and PBV was apparent in both in vivo experiments. Perfusion maps obtained from the digital lung phantom are close to the ground truth. Nonetheless, the quantitative PBF, PBV and MTT maps obtained are not yet validated in an absolute sense. Many factors can lead to errors, including the choice of the SVD threshold (0.1 in this work), recirculation, and linearity of the enhancement with contrast concentration all remain to be confirmed for the UTE sequence.
It should be noted that the convergence of the simple gradient descent search used in this work is known to be computationally slow, and reconstruction times are long despite multithreading. In this work we choose to implement the projection gradient technique [30] because the available computer memory on our network was limited. The very large time-resolved multi-coil 3D data sets are amenable to parallel processing using threaded algorithms, but sufficient memory is a prerequisite. To further reduce the recon times we also used an SVD coil compression method prior to the reconstruction. Future studies in a canine model will compare quantitative perfusion results to Cartesian DCE and will use conjugate gradient to accelerate convergence. This will allow implementation of a regularized PCA approach that is expected to further improve the accuracy of the methods presented.
CONCLUSION
In this work we have demonstrated the feasibility of constrained reconstruction of highly under sampled time-resolved 3D radial UTE data for regional lung perfusion imaging. It feasible to use the reconstructed fractal-based lung phantom and in vivo datasets for to generate estimated perfusion parameter maps in 3D with isotropic high spatial resolution. However, further experimental and clinical studies are needed for validation of the quantitative hemodynamic parameters obtained using this technique against both well-established Cartesian DCE MRI approaches as well as clinical reference standards of pulmonary perfusion which are not based upon MRI.
Supplementary Material
ACKNOWLEDMENTS
The work was funded from an award to SBF by The Hartwell Foundation, NIH 5T32 CA009206-31, NIH 1UL1RR025011, NIH UL1TR000427, NIH 9U54TR000021, NIH R01NS066982, and NIH R01NS065034.
Footnotes
Movies 1-6 (Supplemental). Reconstructions of in vivo data obtained in canine subject using PILS, PILS with view sharing (VS), FISTA, PCB and PCB+ST.
References
- 1.Patz EF, Coleman RE. Nuclear medicine techniques. In: Mason RJ, Murray J, Broaddus VC, Nadel J, editors. Textbook of Respiratory Medicine. Saunders Elsevier; Philadelphia, PA, USA: 2005. pp. 594–599. [Google Scholar]
- 2.Roach PJ, Bailey DL, Harris BE. Enhancing lung scintigraphy with single-photon emission computed tomography. Semin Nucl Med. 2008;38(6):441–99. doi: 10.1053/j.semnuclmed.2008.06.002. [DOI] [PubMed] [Google Scholar]
- 3.Vidal Melo MF, Layfield D, Harris RS, O’Neill K, Musch G, Richter T, Winkler T, Fischman AJ, Venegas JG. Quantification of regional ventilation-perfusion ratios with PET. J Nucl Med. 2003;44:1982–91. [PubMed] [Google Scholar]
- 4.Chae EJ, Seo JB, Goo HW, Kim N, Song KS, Lee SD, Hong SJ, Krauss B. Xenon ventilation CT with a dual-energy technique of dual-source CT: initial experience. Radiology. 2008;248(2):615–24. doi: 10.1148/radiol.2482071482. [DOI] [PubMed] [Google Scholar]
- 5.Donadieu J, Roudier C, Saguintaah M, Maccia C, Chiron R. Estimation of the radiation dose from thoracic CT scans in a cystic fibrosis population. Chest. 2007;132(4):1233–8. doi: 10.1378/chest.07-0221. [DOI] [PubMed] [Google Scholar]
- 6.Revel MP, Cohen S, Sanchez O, Collignon MA, Thiam R, Redheuil A, Meyer G, Frija G. Pulmonary embolism during pregnancy: diagnosis with lung scintigraphy or CT angiography? Radiology. 2011;258(2):590–98. doi: 10.1148/radiol.10100986. [DOI] [PubMed] [Google Scholar]
- 7.Puderbach M, Hintze C, Ley S, Eichinger M, Kauczor HU, Biederer J. MR imaging of the chest: a practical approach at 1.5T. Eur J Radiol. 2007 Dec;64(3):345–55. doi: 10.1016/j.ejrad.2007.08.009. [DOI] [PubMed] [Google Scholar]
- 8.Biederer J, Mirsadraee S, Beer M, Molinari F, Hintze C, Bauman G, Both M, Van Beek EJ, Wild J, Puderbach M. MRI of the lung (3/3)-current applications and future perspectives. Insights Imaging. 2012 Aug;3(4):373–86. doi: 10.1007/s13244-011-0142-z. [DOI] [PMC free article] [PubMed] [Google Scholar]
- 9.Fain S, Schiebler ML, McCormack DG, Parraga G. Imaging of lung function using hyperpolarized helium-3 magnetic resonance imaging: Review of current and emerging translational methods and applications. J Magn Reson Imaging. 2010 Dec;32(6):1398–408. doi: 10.1002/jmri.22375. doi: 10.1002/jmri.22375. [DOI] [PMC free article] [PubMed] [Google Scholar]
- 10.Mugler JP, 3rd, Altes TA. Hyperpolarized 129Xe MRI of the human lung. J Magn Reson Imaging. 2013 Feb;37(2):313–31. doi: 10.1002/jmri.23844. doi: 10.1002/jmri.23844. [DOI] [PMC free article] [PubMed] [Google Scholar]
- 11.Edelman RR, Hatabu H, Tadamura E, Li W, Prasad PV. Noninvasive assessment of regional ventilation in the human lung using oxygen-enhanced magnetic resonance imaging. Nat Med. 1996;2:1236–9. doi: 10.1038/nm1196-1236. [DOI] [PubMed] [Google Scholar]
- 12.Hatabu H, Tadamura E, Levin DL, Chen Q, Li W, Kim D, Prasad PV, Edelman RR. Quantitative assessment of pulmonary perfusion with dynamic contrast-enhanced MRI. Magn Reson Med. 1999 Dec;42(6):1033–1038. doi: 10.1002/(sici)1522-2594(199912)42:6<1033::aid-mrm7>3.0.co;2-7. [DOI] [PubMed] [Google Scholar]
- 13.Ohno Y, Hatabu H, Murase K, Higashino T, Kawamitsu H, Watanabe H, Takenaka D, Fujii M, Sugimura K. Quantitative assessment of regional pulmonary perfusion in the entire lung using three-dimensional ultrafast dynamic contrast-enhanced magnetic resonance imaging: Preliminary experience in 40 subjects. J Magn Reson Imaging. 2004 Sep;20(3):353–65. doi: 10.1002/jmri.20137. [DOI] [PubMed] [Google Scholar]
- 14.Korosec FR, Frayne R, Grist TM, Mistretta CA. Time-resolved contrast-enhanced 3D MR angiography. Magn Reson Med. 1996 Sep;36(3):345–51. doi: 10.1002/mrm.1910360304. [DOI] [PubMed] [Google Scholar]
- 15.Lim RP, Shapiro M, Wang EY, Law M, Babb JS, Rueff LE, Jacob JS, Kim S, Carson RH, Mulholland TP, Laub G, Hecht EM. 3D time-resolved MR angiography (MRA) of the carotid arteries with time-resolved imaging with stochastic trajectories: comparison with 3D contrast-enhanced Bolus-Chase MRA and 3D time-of-flight MRA. AJNR Am J Neuroradiol. 2008 Nov;29(10):1847–54. doi: 10.3174/ajnr.A1252. [DOI] [PMC free article] [PubMed] [Google Scholar]
- 16.Wang K, Schiebler ML, Francois CJ, Del Rio AM, Cornejo MD, Bell LC, Korosec FR, Brittain JH, Holmes JH, Nagle SK. Pulmonary perfusion MRI using interleaved variable density sampling and HighlY constrained cartesian reconstruction (HYCR) J Magn Reson Imaging. 2013 Sep;38(3):751–6. doi: 10.1002/jmri.24018. doi: 10.1002/jmri.24018. Epub 2013 Jan 24. [DOI] [PMC free article] [PubMed] [Google Scholar]
- 17.Ostergaard L, Weisskoff RM, Chesler DA, Gyldensted C, Rosen BR. High resolution measurement of cerebral blood flow using intravascular tracer bolus passages. Part I: Mathematical approach and statistical analysis. Magn Reson Med. 1996 Nov;36(5):715–25. doi: 10.1002/mrm.1910360510. [DOI] [PubMed] [Google Scholar]
- 18.Tsao J, Kozerke S. MRI temporal acceleration techniques. J Magn Reson Imaging. 2012 Sep;36(3):543–60. doi: 10.1002/jmri.23640. doi: 10.1002/jmri.23640. [DOI] [PubMed] [Google Scholar]
- 19.Johnson KM, Fain SB, Schiebler ML, Nagle S. Optimized 3D ultrashort echo time pulmonary MRI. Magn Reson Med. 2012 Dec 4; doi: 10.1002/mrm.24570. doi: 10.1002/mrm.24570. [DOI] [PMC free article] [PubMed] [Google Scholar]
- 20.Togao O, Tsuji R, Ohno Y, Dimitrov I, Takahashi M. Ultrashort echo time (UTE) MRI of the lung: assessment of tissue density in the lung parenchyma. Magn Reson Med. 2010 Nov;64(5):1491–8. doi: 10.1002/mrm.22521. doi: 10.1002/mrm.22521. [DOI] [PubMed] [Google Scholar]
- 21.Barger AV, Block WF, Toropov Y, Grist TM, Mistretta CA. Time-resolved contrast-enhanced imaging with isotropic resolution and broad coverage using an undersampled 3D projection trajectory. Magn Reson Med. 2002 Aug;48(2):297–305. doi: 10.1002/mrm.10212. [DOI] [PubMed] [Google Scholar]
- 22.Candès EJ. Intl Congress of Mathematicians. Madrid, Spain: 2006. Compressive Sampling. [Google Scholar]
- 23.Lustig M, Santos J, Donoho D, Pauly J. k-t SPARSE: high frame rate dynamic MRI exploiting spatial-temporal sparsity; Proc 14th Annual Meeting ISMRM; Seattle. 2006.p. 2420. [Google Scholar]
- 24.Jung H, Ye JC, Kim EY. Improved k-t BLAST and k-t SENSE using FOCUSS. Phys Med Biol. 2007 Jun;52(11):3201–26. doi: 10.1088/0031-9155/52/11/018. [DOI] [PubMed] [Google Scholar]
- 25.Pedersen H, Kozerke S, Ringgaard S, Nehrke K, Kim WY. k-t PCA: temporally constrained k-t BLAST reconstruction using principal component analysis. Magn Reson Med. 2009 Sep;62(3):706–16. doi: 10.1002/mrm.22052. [DOI] [PubMed] [Google Scholar]
- 26.Velikina JV, Samsonov AA. An Application of Regularization by Model Consistency Condition to Accelerated Contrast-Enhanced Angiography; Proc. of ISMRM 2012; Melbourne, Australia. p. 13. [Google Scholar]
- 27.Zhao B, Haldar JP, Christodoulou AG, Liang ZP. Image Reconstruction From Highly Undersampled (k-t)-Space Data With Joint Partial Separability and Sparsity Constraints. IEEE Transactions on Medical Imaging. 2012 Sep;31(9):1809–20. doi: 10.1109/TMI.2012.2203921. [DOI] [PMC free article] [PubMed] [Google Scholar]
- 28.Johnson KM, Huimin Wu, Yijing Wu, Loecher M, Turski PA. Evaluation of 3D Non-Cartesian Angiography Imaging Strategies using Realistic Fractal Phantoms; ISMRM Workshop on Data Sampling; Sedona, AZ, USA. [Google Scholar]
- 29.Karch R, Neumann F, Podesser BK, Neumann M, Szawlowski P, Schreiner W. Fractal properties of perfusion heterogeneity in optimized arterial trees: a model study. J Gen Physiol. 2003 Sep;122(3):307–21. doi: 10.1085/jgp.200208747. [DOI] [PMC free article] [PubMed] [Google Scholar]
- 30.Daubechies I, Fornasier M, Loris I. Accelerated Projected Gradient Method for Linear Inverse Problems with Sparsity Constraints. Journal of Fourier Analysis and Applications. 2008;14(5-7):764–792. [Google Scholar]
- 31.Samsonov A. A novel reconstruction approach using model consistency condition for accelerated quantitative MRI (MOCCA); In: Proc 20th Annual Meeting ISMRM; Melbourne. 2012.p. 358. [Google Scholar]
- 32.Samsonov A, Velikina JV. A Novel Iterative Thresholding Algorithm for Compressed Sensing Reconstruction of Quantitative MRI Parameters from Insufficient Data; Fields Institute Conference on Mathematics of Medical Imaging; Toronto, ON, Canada. June 20-24, 2011. [Google Scholar]
- 33.Chang S, Yu B, Vetterli M. Adaptive wavelet thresholding for image denoising and compression. IEEE Transactions and Image Processing. 2000;9(9):1532–1546. doi: 10.1109/83.862633. [DOI] [PubMed] [Google Scholar]
- 34.Liang ZP. Spatiotemporal imaging with partially separable functions; Proc. IEEE Int. Symp. Biomed. Imag.; 2007.pp. 988–991. [Google Scholar]
- 35.Buehrer M, Pruessmann KP, Boesiger P, Kozerke S. Array compression for MRI with large coil arrays. Magn Reson Med. 2007 Jun;57(6):1131–9. doi: 10.1002/mrm.21237. [DOI] [PubMed] [Google Scholar]
- 36.Uecker M, Lai P, Murphy MJ, Virtue P, Elad M, Pauly JM, Vasanawala SS, Lustig M. ESPIRiT-an eigenvalue approach to autocalibrating parallel MRI: Where SENSE meets GRAPPA. Magn Reson Med. 2013 May 6; doi: 10.1002/mrm.24751. doi: 10.1002/mrm.24751. [DOI] [PMC free article] [PubMed] [Google Scholar]
- 37.Griswold MA, Jakob PM, Nittka M, Goldfarb JW, Haase A. Partially parallel imaging with localized sensitivities (PILS) Magn Reson Med. 2000 Oct;44(4):602–9. doi: 10.1002/1522-2594(200010)44:4<602::aid-mrm14>3.0.co;2-5. [DOI] [PubMed] [Google Scholar]
- 38.Beck A, Teboulle M. A Fast Iterative Shrinkage-Thresholding Algorithm for Linear Inverse Problems. SIAM J Imaging Sciences. 2009;2(1):183–202. [Google Scholar]
- 39.Liu HL, Pu Y, Liu Y, Nickerson L, Andrews T, Fox PT, Gao JH. Cerebral blood flow measurement by dynamic contrast MRI using singular value decomposition with an adaptive threshold. Magn Reson Med. 1999 Jul;42(1):167–72. doi: 10.1002/(sici)1522-2594(199907)42:1<167::aid-mrm22>3.0.co;2-q. [DOI] [PubMed] [Google Scholar]
- 40.Meier P, Zierler KL. On the theory of the indicator-dilution method for measurement of blood flow and volume. J Appl Physiol. 1954;6:731–744. doi: 10.1152/jappl.1954.6.12.731. [DOI] [PubMed] [Google Scholar]
- 41.Ryan US, Makrides SC. Nonrespiratory functions of the lungs. In: Fishman AP, Elias JA, Fishman JA, Groppi MA, Kaiser L, Senior RM, editors. Fishman’s pulmonary diseases and disorders. McGraw-Hill; New York: 1998. pp. 139–148. [Google Scholar]
- 42.Samsonov AA. Spatial-temporal regularization framework for dynamic MRI series reconstruction; Proc. of ISMRM; Miami. 2005.p. 2309. [Google Scholar]
- 43.Ganesh A, Whitaker RT, DiBella EVR. Spatio-Temporal Constrained Reconstruction of Sparse Dynamic Contrast Enhanced Radial MRI Data; Proc. of ISBI; 2007.pp. 109–112. [Google Scholar]
- 44.Velikina JV, Alexander AL, Samsonov AA. Accelerating MRI parameter mapping using sparsity-promoting regularization in parametric dimension. Magnetic Resonance in Medicine. 2013;70:1263–1273. doi: 10.1002/mrm.24577. [DOI] [PMC free article] [PubMed] [Google Scholar]
Associated Data
This section collects any data citations, data availability statements, or supplementary materials included in this article.


