Abstract
The bacterial communities of 1- to 6-year ginseng rhizosphere soils were characterized by culture-independent approaches, random amplified polymorphic DNA (RAPD), and amplified ribosomal DNA restriction analysis (ARDRA). Culture-dependent method (Biolog) was used to investigate the metabolic function variance of microbe living in rhizosphere soil. Results showed that significant genetic and metabolic function variance were detected among soils, and, with the increasing of cultivating years, genetic diversity of bacterial communities in ginseng rhizosphere soil tended to be decreased. Also we found that Verrucomicrobia, Acidobacteria, and Proteobacteria were the dominants in rhizosphere soils, but, with the increasing of cultivating years, plant disease prevention or plant growth promoting bacteria, such as Pseudomonas, Burkholderia, and Bacillus, tended to be rare.
1. Introduction
Ginseng (Panax ginseng C.A. Meyer) is mainly cultivated in China, Korea, and Japan. It has been regarded as one of the most important remedies in oriental medicine for more than 1,000 years [1]. Nowadays, it is usually used as adaptogenic, antiaging health tonic, and so forth. As herbaceous perennial plant, ginseng requires at least 6 years of growth from sow to harvest. In China, after growing 2 or 3 years, ginseng usually is transplanted to another site until harvest. During the long growing process, soilborne diseases made a severe threat on the health of P. ginseng root.
Rhizosphere soil is defined as soil tightly adhering with plant root [2]. Plant releases a series of compounds through root into rhizosphere soil which provide plentiful nutrition to rhizosphere microbe [3]. On the other hand, rhizosphere bacteria play an important role in nutrient cycling, organic matter decomposition, and soil fertility maintaining [4]. Recently, though a few novel bacterial strains have been isolated from field plant ginseng ever [5–7] or from the interior of ginseng root [8, 9], most of the bacterial community in ginseng rhizosphere soil is still unknown yet.
In the present study, culture-independent methods, random amplified polymorphic DNA (RAPD), and amplified ribosomal DNA restriction analysis (ARDRA) were used to examine the bacterial community and dynamics of dominant bacterial species in ginseng rhizosphere soil during the growth of P. ginseng. Furthermore, Biolog EcoPlate was used to study the metabolic function variance of rhizosphere microbe. The aim of the present study was to reveal the dynamics of rhizosphere bacterial communities during the growth of P. ginseng by culture-dependent and culture-independent methods.
2. Experimental Section
2.1. Soil Collection and DNA Extraction
Rhizosphere soils of one- to six-year ginseng were sampled from Dafang (H: 570.8 m N: 42°26′03.2′′ E: 127°20′00.1′′) in Fusong county, Jilin Province, China, in January 2009. The soil is uniform with histosols soil according to the UN-FAO soil classification system. For each sample, soil tightly adhering on the surface of five healthy ginseng roots at the same field was collected. The genomic DNA of soil microbes was extracted immediately.
Genomic DNA was extracted from 0.5 g fresh soil using E.Z.N.A. Soil DNA Kit (OMEGA, USA) according to the manufacturer's instructions. The successful extraction of genomic DNA was checked by 0.8% agarose gel electrophoresis with 1 × TAE buffer (2 mol/L Tris-base, 50 mmol/L EDTA, and 1 mol/L acetic acid, pH 8.0).
2.2. RAPD Fingerprinting
Genetic diversity of microbes in ginseng rhizosphere soils was examined by RAPD method. Amplification was performed in a 25 μL volume containing 20 ng template DNA, 0.2 μmol/L primer, 100 μmol/L dNTP, 1 × PCR buffer (10 mmol/L Tris-HCl, pH 8.0, 50 mmol/L KCl, 1.5 mmol/L MgCl2), and 1 U Taq DNA polymerase. In total, 15 repetitive and polymorphic primers (OPH11, OPI4, OPJ1, OPJ4, OPJ7, OPR7, OPR8, OPR10, OPR11, OPR14, OPR17, OPS4, OPS10, OPT16, and OPT17) were used for RAPD analysis. Amplification was performed in a T Gradient 96 Thermal Cycler (Biometra) with cycling program that consisted of initial denaturation of 1 min at 94°C, followed by 40 cycles of 1 min denaturation at 94°C, 1 min annealing at 37°C, 1.5 min extension at 72°C, and a final extension at 72°C for 7 min.
Products amplified were separated on 1.2% agarose gels containing ethidium bromide, and reproducible, clear bands from 100 bp to 1500 bp were recorded. Fingerprinting profile was then converted to a two-dimensional binary matrix (“1” indicates presence of band; “0” indicates absence of band) and calculated using NTSYSpc version 2.10e software for clustering analysis [10]. The dendrogram was constructed using the unweighted pair group method (UPGMA). Nei's genetic diversity and Shannon's information index were calculated by population genetic analysis software Popgene version 1.32 (32-bit).
2.3. Amplified Ribosomal DNA Restriction Analysis (ARDRA)
The bacterial community was analyzed by a cultivation-independent method. 16S ribosomal DNA of bacteria was amplified by a pair of universal primers 27f (5′-AGA GTT TGA TCM TGG CTC AG-3′) and 1492r (5′-TAC GGY TAC CTT GTT ACG ACT T-3′) [11, 12] in a T Gradient 96 Thermal Cycler. The successful amplification was checked by 1% agarose gel electrophoresis.
Target fragments were purified by Wizard PCR Preps DNA Purification System (Promega, USA), ligated with PMD-18T vector (TaKaRa), and then transferred into E. coli TOP10 competent cell according to the manufacturer's instructions. Aliquot (100 μL) of each transformation was spread on LB/ampicillin/IPTG/X-gal plates and incubated at 37°C for 16 h. For each sample, 192 white colonies were picked out, which were amplified by 27f and 1492r primer that the positive clones were confirmed through. Then, 10 μL target insert fragments (about 1,500 bp) were digested by 3 U restriction endonuclease Hinf I (TaKaRa) [13, 14] and Pst I (TaKaRa) [15] at 37°C for 2 h. Clones having the same restriction patterns were defined as an operational taxonomic unit (OTU).
Representative clones of unique ARDRA patterns were sequenced by automated DNA capillary sequencer 3730 (Applied Biosystems, USA). The partial sequences of 16S rRNA gene were blasted with known 16S rDNA sequences in GenBank databases using nucleotide BLAST program (http://blast.ncbi.nlm.nih.gov/blast.cgi) [16]. The saturation of clones in the library was evaluated by rarefaction curves [17] calculated using the Analytic RarefactWin Version 1.3 (http://www.uga.edu/~strata/software/index.html) program [18].
2.4. Metabolic Characteristics of Soil Microbe
Soil metabolisms of soil microbial communities were characterized by community level physiological profiles (CLPP) using Biolog EcoPlate [19]. Ten grams of fresh soil was suspended in 90 mL of sterile 0.85% saline solution and shaken at 120 rpm for 30 min, and then suspensions were diluted 1,000-fold. Each well of a Biolog EcoPlate was inoculated with 150 μL diluents and incubated at 25°C in dark without agitation. The plates were scanned at wavelength of 590 nm by a Biolog reader on OmniLog Plus (BIOLOG Inc., Hayward, CA, USA) at a 24-hour interval for 168 h. Each soil sample using one plate with 31 carbon substrates is arranged in triplicate.
The average well color development (AWCD) was used to evaluate the general carbon substrates utilization ability [9, 20], where “A i” is the absorption of ith well and “A A1” is the absorption of the “A 1” well following the incubation measured in terms of the optical density at wavelength of 590 nm (OD590). AWCD of each well was calculated using the following formula:
| (1) |
The metabolic profile of microbial community includes the Shannon index (H′) and the evenness index (E) [21, 22]. The diversity of microbial community was evaluated by the Shannon index (H′) [23], calculated using the formula
| (2) |
where “p i” is the principal color development of the “ith” well relative to the total color development, that is, p i = (C − R)/∑(C − R), and “s” is the summation of absorption values of all wells in a Biolog EcoPlate. The evenness index was calculated using the formula E = H′/ln S, where diversity “S” is the total number of carbon substrates utilized by microbial community in a given soil sample, and only the positive data, the optical density (OD) ≥0.2, was used to calculate “S.” The AWCD value at 120 h was used to calculate the Shannon index (H′); SPSS 17.0 and SIMCA-P 11.5 Demo software were used for PCA analysis [24].
3. Results
3.1. RAPD Analysis
Bacterial diversity indices H′ and I decreased in soil B compared to soil A but increased sharply in soil C. H′ and I of soils D, E, and F were significantly lower than of soils A, B, and C. Soil D has the lowest indices, while soil C has the highest indices (Table 1).
Table 1.
Bacterial diversity and metabolic function indices of ginseng rhizosphere soils.
| Soil samples | Cultivating year | H′ | I | Shannon diversity | Evenness |
|---|---|---|---|---|---|
| A | 1 | 0.4782 | 0.6712 | 2.791 | 0.829 |
| B | 2 | 0.4357 | 0.6273 | 2.786 | 0.827 |
| C | 3 | 0.4880 | 0.6811 | 2.768 | 0.838 |
| D | 4 | 0.3519 | 0.5367 | 2.716 | 0.832 |
| E | 5 | 0.3866 | 0.5750 | 2.778 | 0.822 |
| F | 6 | 0.4142 | 0.6047 | 2.664 | 0.818 |
H′ indicates Nei's gene diversity; I indicates Shannon's information index.
Clustering results showed that, under the 0.58 coefficient threshold, 6 soil samples were divided into two groups. Group I included soils A, B, and C, while group II included soils D, E, and F. The highest similarity coefficient was detected between soils D and F (Figure 1).
Figure 1.
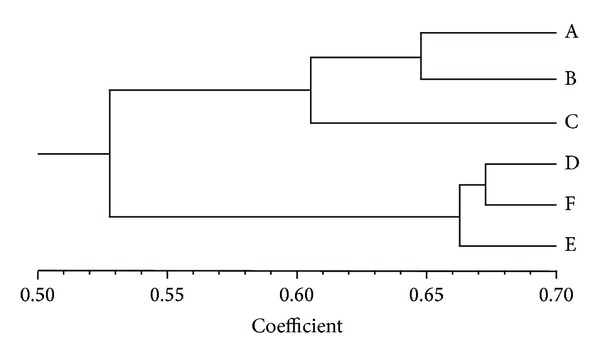
UPGMA dendrogram of six ginseng rhizosphere soils.
3.2. ARDRA and Phylogenetic Analysis
In total, 167 OTUs were generated from 961 clones, in which 27, 27, 44, 16, 28, and 25 OTUs were identified in soils A, B, C, D, E, and F, respectively.
The saturation of OTUs analyzed was evaluated by rarefaction curves, which indicated that six clone libraries were near the saturated status (Figure 2). ARDRA analyzing results indicated that soil D has the lowest diversity (16 OTUs), whereas diversities of soil C (44 OTUs) were the highest.
Figure 2.
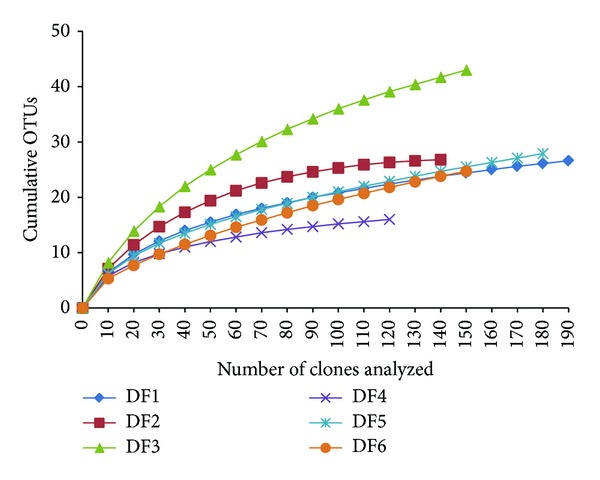
Rarefaction curves for bacterial OTUs, clustering at 97% rRNA gene similarity.
Sequencing results indicated that Verrucomicrobia, Acidobacteria, and Proteobacteria were the dominants in six soils. Also, Gemmatimonadetes, Planctomycetes, Firmicutes, Bacteroidetes, Actinobacteria, Gemmatimonadales, and unclassified bacteria were identified in soils. Proteobacteria showed the most significant differences among 6 soils. Firmicutes are only present in soils A, B, and C. Gemmatimonadales are only present in soils C and E. Bacteroidetes are only present in soils A and C. α- and γ-Proteobacteria are present in 6 soils simultaneously. γ-Proteobacteria constitute a substantial proportion of clones (about 60%) in soil F. Except for soil F, β-Proteobacteria are present in another 5 soils. δ-Proteobacteria are present in soils except soils A and E. Verrucomicrobia are another major group present in 6 soils. Actinobacteria are present in soil F. Except for soils B and F, Planctomycetes are present in another 4 soils with a small proportion. Unclassified bacteria (about 8.5% of total) are detected in 6 soils. Of the 167 OTUs sequenced, 63.2% (607 clones) had higher similarity to the 16S rDNA sequences of uncultured bacteria, and only 36.8% (354 clones) were most closely related to cultured isolates (Figure 3).
Figure 3.
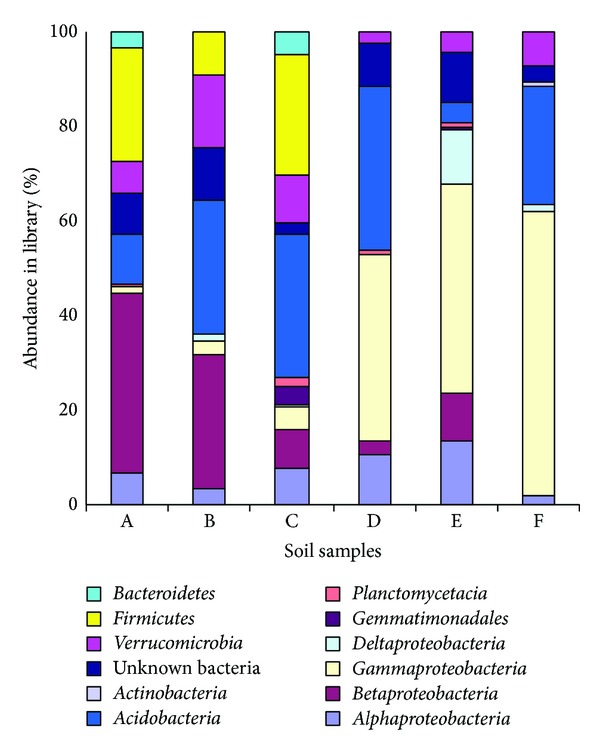
Bacterial communities in ginseng rhizosphere soil.
3.3. BIOLOG Analysis
As a universal indicator of metabolic activity, AWCD changes were shown in Figure 4. Obviously, the metabolic activity tended to be increasing along with incubation time. However, metabolic activity among soils showed significant differences. For example, soils D and F usually had the lowest AWCD, which indicated that their metabolic activity was the lowest.
Figure 4.
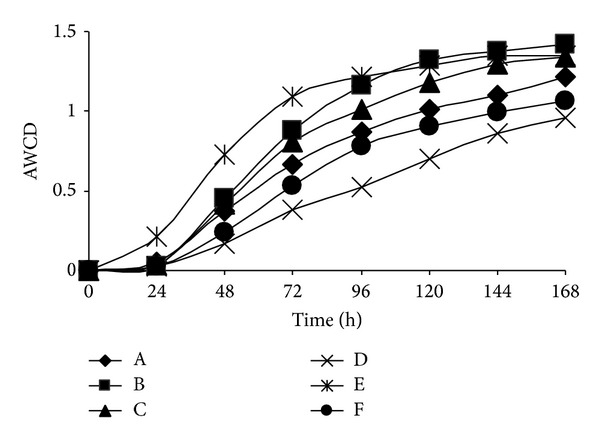
Average well color development (AWCD) with incubation.
According to the curve of AWCD versus the culturing time, the AWCD values in 120 h were used to describe the difference of soil microbial metabolic activity. In the present research, the order of metabolic activity based on AWCD was described as follows: soil D < soil F < soil A < soil C < soil E < soil B. The Shannon diversity ranged from 2.664 to 2.791; soil F has the lowest Shannon diversity and evenness indices (Table 1).
To show which types of the substrates were utilized and the intrinsic differences between microbial communities, principal component analysis was then performed to display the variance of microbial communities (Figure 5), which could clearly separate the soil samples according to the different age of ginseng. The first principal component (PC1) and the second principal component (PC2) contributed 58% and 18% to the total variation, respectively. By substrate utilization patterns, soil samples were clearly divided into two groups: one with soil samples D, F, and A and the other with soils C, B, and E. The difference of C utilization patterns supported the fact that ginseng of different ages had significant influence on rhizosphere soil microbial community (Table 2).
Figure 5.
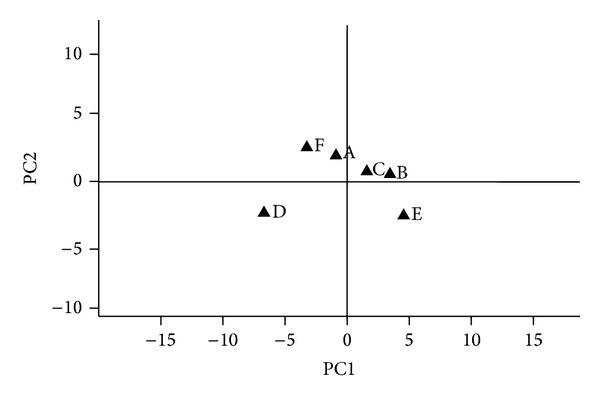
Principal component analysis (PCA) of Biolog EcoPlates data. Each solid triangle represents a soil sample.
Table 2.
Substrates highly correlated with PC1 and PC2.
| PC1 | r |
|---|---|
| Carbohydrates | |
| I-Erythritol | 0.895 |
| Glycogen | 0.835 |
| D-Glucosaminic acid | 0.859 |
| D-Cellobiose | 0.891 |
| Amino acids | |
| L-Arginine | 0.848 |
| L-Phenylalanine | 0.918 |
| L-Threonine | 0.838 |
| Carboxylic acids | |
| Pyruvic acid methyl ester | 0.873 |
| y-Hydroxybutyric | 0.930 |
| Itaconic acid | 0.959 |
| a-Ketobutyric acid | 0.907 |
| Amines | |
| Putrescine | 0.968 |
| Phenolic | |
| 2-Hydroxybenzoic acid | 0.802 |
| 4-Hydroxybenzoic acid | 0.905 |
| Polymer | |
| a-Cyclodextrin | 0.886 |
|
| |
| PC2 | r |
|
| |
| Amino acids | |
| L-Asparagine | 0.805 |
| Carbohydrates | |
| N-Acetyl-D-glucosamine | 0.804 |
The substrates with high correlation coefficients to PC1 and PC2 were shown in Table 2. It is illustrated that carboxylic acids and carbohydrates influence PC1 greatly, which were carbohydrates and amino acids for PC2.
4. Discussion
Culture-independent method was used to investigate the bacterial community; the dominant bacteria in ginseng rhizosphere soils were not the same as those found from a wide range of soils, such as pristine forest, grassland, and agricultural soils [25]. Such differences could likely be explained by different soil characteristics [26]. Root exudates released by plant provide plenteous nutrition for rhizospheric microorganisms and had a great influence on the microbial community. So we deduced that ginseng is a herbaceous perennial plant growing at a special environment, and its exudates are different from others, which finally resulted in special bacterial community.
According to RAPD and ARDRA analysis, soil C has the highest diversity index. It was also found that bacterial diversity in rhizosphere soil of cotton increased from squaring period to flowering period [27]. The reason for this could be that young roots are known to excrete more organic material than older roots, which can result in different specific bacterial populations [28]. Among soils tested, soils D and F have the lowest diversity index. Further analysis indicated that carbon sources metabolic activity of two soils were also the lowest. Although the relationship between biological diversity and ecological function of soil bacterial community has not been fully understood, the decrease of microbial diversity will obviously result in the loss of some ecological function and finally make the ecological system unhealthy [29–31]. Actually, soils ever cultivated ginseng, which are traditionally called “old ginseng soil,” such as soils D and F, which are not suitable for the growth of the next generation of ginseng. So we deduced that the decreased genetic diversity and reduced ecological function disorder made the soil unsuitable for ginseng growth further.
Rhizosphere is a unique environment, where pathogens and beneficial microbe have important influence on the growth and health of plants [32]. Pseudomonas and Burkholderia belong to Proteobacteria, and Bacillus belongs to Firmicutes which were reported to have antagonistic activity against soilborne pathogenic fungi, such as Rhizoctonia, Sclerotinia, Verticillium, and Gaeumannomyces [33–35]. In the present study, genera of Pseudomonas, Burkholderia, and Bacillus were found in soils A, B, C, and E. Actually, during the cultivation, 6-year-old ginseng is more easily infected by soilborne pathogenic fungi. So we deduced that the decrease of the Pseudomonas, Burkholderia, and Bacillus in rhizosphere soil may be a key cause that resulted in 6-year ginsengs being more easily infected by soilborne pathogens.
It is known that soil bacterial populations are influenced by a wide range of factors. Soil type, plant species, and cropping patterns are the factors that most affect the bacterial community structure in soil [8, 36]. In order to reduce interference from other factors and truly reflect the relationship between soil bacterial succession and continuous cropping with ginseng plants, several measures were used, including the uniformity of management of ginseng cultivation. Cluster analyses demonstrated that the soil bacterial assemblages obtained from the same cropping cycle were similar; genetic polymorphic analyses and carbon metabolic analyses also showed dynamic changes in bacterial populations with continuous ginseng cropping. It has been reported that soil microbial biomass and their structure were also significantly influenced by continuous cropping with the other grain crops or economic crops [37, 38]. These findings indicated that successional change in soil microbial communities with continuous cropping may be a common feature.
Acknowledgments
This work was supported by the National Natural Science Foundation of China (81072992), Doctoral Fund of Ministry of Education of China (200800231060), PUMC Youth Fund (3332013113), and the Fundamental Research Funds for the Central Universities (2012D13).
Conflict of Interests
The authors declare that there is no conflict of interests.
References
- 1.Yu W, Lee B, Nam S, Yang D, Yun Y. Modulating effects of Korean ginseng saponins on ovarian function immature rats. Biological and Pharmaceutical Bulletin. 2003;26(11):1574–1580. doi: 10.1248/bpb.26.1574. [DOI] [PubMed] [Google Scholar]
- 2.Kent AD, Triplett EW. Microbial communities and their interactions in soil and rhizosphere ecosystems. Annual Review of Microbiology. 2002;56:211–236. doi: 10.1146/annurev.micro.56.012302.161120. [DOI] [PubMed] [Google Scholar]
- 3.Whipps JM. Microbial interactions and biocontrol in the rhizosphere. Journal of Experimental Botany. 2001;52:487–511. doi: 10.1093/jexbot/52.suppl_1.487. [DOI] [PubMed] [Google Scholar]
- 4.Atkinson D, Watson CA. The beneficial rhizosphere: a dynamic entity. Applied Soil Ecology. 2000;15(2):99–104. [Google Scholar]
- 5.Im W, Kim S, Liu Q, Yang J, Lee S, Yi T. Nocardioides ginsengisegetis sp. nov., isolated from soil of a ginseng field. Journal of Microbiology. 2010;48(5):623–628. doi: 10.1007/s12275-010-0001-5. [DOI] [PubMed] [Google Scholar]
- 6.Lee M, Ten LN, Baek S, Im W, Aslam Z, Lee S. Paenibacillus ginsengisoli sp. nov., a novel bacterium isolated from soil of a ginseng field in Pocheon province, South Korea. Antonie van Leeuwenhoek, International Journal of General and Molecular Microbiology. 2007;91(2):127–135. doi: 10.1007/s10482-006-9102-x. [DOI] [PubMed] [Google Scholar]
- 7.Yi H, Srinivasan S, Kim MK. Stenotrophomonas panacihumi sp. nov., isolated from soil of a ginseng field. Journal of Microbiology. 2010;48(1):30–35. doi: 10.1007/s12275-010-0006-0. [DOI] [PubMed] [Google Scholar]
- 8.Garbeva P, Van Veen JA, Van Elsas JD. Microbial diversity in soil: selection of microbial populations by plant and soil type and implications for disease suppressiveness. Annual Review of Phytopathology. 2004;42:243–270. doi: 10.1146/annurev.phyto.42.012604.135455. [DOI] [PubMed] [Google Scholar]
- 9.Garland JL, Cook KL, Johnson M, Sumner R, Fields N. Density and composition of microorganisms during long-term (418 day) growth of potato using biologically reclaimed nutrients from inedible plant biomass. Advances in Space Research. 1997;20(10):1931–1937. doi: 10.1016/s0273-1177(97)00628-5. [DOI] [PubMed] [Google Scholar]
- 10.Ramesh Kumar N, Thirumalai Arasu V, Gunasekaran P. Genotyping of antifungal compounds producing plant growth-promoting rhizobacteria, Pseudomonas fluorescens . Current Science. 2002;82(12):1463–1466. [Google Scholar]
- 11.Muyzer G, De Waal EC, Uitterlinden AG. Profiling of complex microbial populations by denaturing gradient gel electrophoresis analysis of polymerase chain reaction-amplified genes coding for 16S rRNA. Applied and Environmental Microbiology. 1993;59(3):695–700. doi: 10.1128/aem.59.3.695-700.1993. [DOI] [PMC free article] [PubMed] [Google Scholar]
- 12.Weisburg WG, Barns SM, Pelletier DA, Lane DJ. 16S ribosomal DNA amplification for phylogenetic study. Journal of Bacteriology. 1991;173(2):697–703. doi: 10.1128/jb.173.2.697-703.1991. [DOI] [PMC free article] [PubMed] [Google Scholar]
- 13.Hunt J, Boddy L, Randerson PF, Rogers HJ. An evaluation of 18S rDNA approaches for the study of fungal diversity in grassland soils. Microbial Ecology. 2004;47(4):385–395. doi: 10.1007/s00248-003-2018-3. [DOI] [PubMed] [Google Scholar]
- 14.Ntougias S, Kavroulakis N, Papadopoulou KK, Ehaliotis C, Zervakis GI. Characterization of cultivated fungi isolated from grape marc wastes through the use of amplified rDNA restriction analysis and sequencing. Journal of Microbiology. 2010;48(3):297–306. doi: 10.1007/s12275-010-9193-y. [DOI] [PubMed] [Google Scholar]
- 15.Scortichini M, Marchesi U, Di Prospero P. Genetic relatedness among Pseudomonas avellanae, P. syringae pv. theae and P.s. pv. actinidiae, and their identification. European Journal of Plant Pathology. 2002;108(3):269–278. [Google Scholar]
- 16.Altschul SF, Madden TL, Schäffer AA, et al. Gapped BLAST and PSI-BLAST: a new generation of protein database search programs. Nucleic Acids Research. 1997;25(17):3389–3402. doi: 10.1093/nar/25.17.3389. [DOI] [PMC free article] [PubMed] [Google Scholar]
- 17.Ravenschlag K, Sahm K, Pernthaler J, Amann R. High bacterial diversity in permanently cold marine sediments. Applied and Environmental Microbiology. 1999;65(9):3982–3989. doi: 10.1128/aem.65.9.3982-3989.1999. [DOI] [PMC free article] [PubMed] [Google Scholar]
- 18.Heck KL, Van Belle G, Simberloff D. Explicit calculation of the rarefaction diversity measurement and the determination of sufficient sample size. Ecology. 1975;56:1459–1461. [Google Scholar]
- 19.Schutter M, Dick R. Shifts in substrate utilization potential and structure of soil microbial communities in response to carbon substrates. Soil Biology and Biochemistry. 2001;33(11):1481–1491. [Google Scholar]
- 20.Garland JL, Mills AL. Classification and characterization of heterotrophic microbial communities on the basis of patterns of community-level sole-carbon-source utilization. Applied and Environmental Microbiology. 1991;57(8):2351–2359. doi: 10.1128/aem.57.8.2351-2359.1991. [DOI] [PMC free article] [PubMed] [Google Scholar]
- 21.Li Z, Wu X, Chen B. Changes in transformation of soil organic c and functional diversity of soil microbial community under different land uses. Agricultural Sciences in China. 2007;6(10):1235–1245. [Google Scholar]
- 22.Zak JC, Willig MR, Moorhead DL, Wildman HG. Functional diversity of microbial communities: a quantitative approach. Soil Biology and Biochemistry. 1994;26(9):1101–1108. [Google Scholar]
- 23.Shannon CE, Weaver W. The Mathematical Theory of Communication. Urbana, Ill, USA: The University of Illinois Press; 1949. [Google Scholar]
- 24.Vendan RT, Yu YJ, Lee SH, Rhee YH. Diversity of endophytic bacteria in ginseng and their potential for plant growth promotion. Journal of Microbiology. 2010;48(5):559–565. doi: 10.1007/s12275-010-0082-1. [DOI] [PubMed] [Google Scholar]
- 25.Janssen PH. Identifying the dominant soil bacterial taxa in libraries of 16S rRNA and 16S rRNA genes. Applied and Environmental Microbiology. 2006;72(3):1719–1728. doi: 10.1128/AEM.72.3.1719-1728.2006. [DOI] [PMC free article] [PubMed] [Google Scholar]
- 26.Zhang L, Xu Z. Assessing bacterial diversity in soil. Journal of Soils and Sediments. 2008;8(6):379–388. [Google Scholar]
- 27.Zhang Y, Du BH, Jin ZG, Li ZH, Song HN, Ding YQ. Analysis of bacterial communities in rhizosphere soil of healthy and diseased cotton (Gossypium sp.) at different plant growth stages. Plant and Soil. 2011;339(1):447–455. [Google Scholar]
- 28.Curl EA, Truelove B. The Rhizosphere. Springer; 1986. (Advanced Series in Agriculture Sciences). [Google Scholar]
- 29.Anderson T. Microbial eco-physiological indicators to asses soil quality. Agriculture, Ecosystems and Environment. 2003;98(1–3):285–293. [Google Scholar]
- 30.Brussaard L, de Ruiter PC, Brown GG. Soil biodiversity for agricultural sustainability. Agriculture, Ecosystems and Environment. 2007;121(3):233–244. [Google Scholar]
- 31.Griffiths BS, Kuan HL, Ritz K, Glover LA, McCaig AE, Fenwick C. The relationship between microbial community structure and functional stability, tested experimentally in an upland pasture soil. Microbial Ecology. 2004;47(1):104–113. doi: 10.1007/s00248-002-2043-7. [DOI] [PubMed] [Google Scholar]
- 32.Lynch J. The Rhizosphere. London, UK: Wiley; 1990. [Google Scholar]
- 33.Harman GE, Petzoldt R, Comis A, Chen J. Interactions between Trichoderma harzianum strain T22 and maize inbred line Mo17 and effects of these interactions on diseases caused by Pythiuin ultimum and Colletotrichum graminicola . Phytopathology. 2004;94(2):147–153. doi: 10.1094/PHYTO.2004.94.2.147. [DOI] [PubMed] [Google Scholar]
- 34.Raaijmakers JM, Paulitz TC, Steinberg C, Alabouvette C, Moënne-Loccoz Y. The rhizosphere: a playground and battlefield for soilborne pathogens and beneficial microorganisms. Plant and Soil. 2009;321(1-2):341–361. [Google Scholar]
- 35.Shi J, Yuan X, Lin H, Yang Y, Li Z. Differences in soil properties and bacterial communities between the rhizosphere and bulk soil and among different production areas of the medicinal plant Fritillaria thunbergii . International Journal of Molecular Sciences. 2011;12(6):3770–3785. doi: 10.3390/ijms12063770. [DOI] [PMC free article] [PubMed] [Google Scholar]
- 36.Wieland G, Neumann R, Backhaus H. Variation of microbial communities in soil, rhizosphere , and rhizoplane in response to crop species, soil type, and crop development. Applied and Environmental Microbiology. 2001;67(12):5849–5854. doi: 10.1128/AEM.67.12.5849-5854.2001. [DOI] [PMC free article] [PubMed] [Google Scholar]
- 37.Yao H, Jiao X, Wu F. Effects of continuous cucumber cropping and alternative rotations under protected cultivation on soil microbial community diversity. Plant and Soil. 2006;284(1-2):195–203. [Google Scholar]
- 38.Chen MN, Li X, Yang QL, et al. Dynamic succession of soil bacterial community during continuous cropping of peanut (Arachis hypogaea L.) PLoS ONE, 2014;9 doi: 10.1371/journal.pone.0101355.e101355 [DOI] [PMC free article] [PubMed] [Google Scholar]


