

Abstract
We demonstrate rapid vibrational imaging based on sum frequency generation (SFG) microscopy with a collinear excitation geometry. Using the tunable picosecond pulses from a high-repetition-rate optical parametric oscillator, vibrationally selective imaging of collagen fibers is achieved with submicrometer lateral resolution. We furthermore show simultaneous SFG and second harmonic generation imaging to emphasize the compatibility of the microscope with other nonlinear optical modalities.
Sum frequency generation is a second-order nonlinear optical response that is exclusively sensitive to noncentrosymmetric media, which are usually provided by systems with nonsymmetric local structure or at symmetry breaking interfaces between different materials [1]. Vibrationally resonant sum frequency generation (VR-SFG) is a special case of the SFG process that offers sensitivity to both the vibrational and the nonvanishing second-order response of the material [2]. The vibrationally resonant mid-IR frequency ω1 and a second visible/near-IR frequency ω2 induce the nonlinear signal at ω3 = ω1 + ω2. The frequency-dependent second-order susceptibility χ(2) consists of two parts, a nonresonant contribution and a vibrationally resonant contribution. Whenever ω1 is near resonance with a vibrational mode frequency, the SFG response is enhanced, giving the technique its vibrational sensitivity.
Although VR-SFG has been extensively used to study the orientation and dynamics of chemical compounds at planar interfaces [3–6], its unique vibrational contrast has not found widespread use in microscopic imaging. This is surprising, since VR-SFG imaging would provide a vibrational contrast mechanism useful for the study of essential biopolymers, such as collagen, as well as a tool to examine molecular details at interfaces with submicrometer spatial resolution. The limited application of this contrast mechanism in microscopy is due to the difficulty of experimentally adapting the VR-SFG technique into an imaging modality compatible with the high-resolution and high-speed imaging capabilities of existing nonlinear optical imaging techniques.
Unlike related vibrationally sensitive nonlinear imaging techniques, such as coherent anti-Stokes Raman scattering and stimulated Raman scattering, the VR-SFG approach requires mid-IR laser radiation to vibrationally address the material. Mid-IR radiation from low repetition rate (Hz–kHz), high pulse energy (μJ–mJ) laser systems used in VR-SFG microscopes [7] provide an unfavorable balance between sample damage and signal integration time. In analogy with spectroscopic VR-SFG measurements, several wide-field, noncollinear illumination schemes have been utilized for microscopic applications. In such wide-field configurations, the SFG radiation from a large area is commonly captured by an objective lens and projected onto a CCD camera [8–11]. The highest lateral resolution attained with a wide-field geometry has been estimated as ~1.1 μm [12]. Alternatively, an objective lens has been used to focus the visible/near-IR beam, while the mid-IR radiation is applied in a wide-field illumination geometry [13]. Although this scheme permits improved axial resolution, the long image acquisition time of an hour or more are incompatible with most biological imaging applications. In general, the VR-SFG microscopy schemes implemented thus far suffer from either low signal levels and long acquisition times or low spatial resolution.
In this work, we demonstrate a VR-SFG microscope that overcomes many of the existing shortcomings of this imaging technique. We have improved the VR-SFG microscope in two ways. First, we have used a high-repetition picosecond optical parametric oscillator (OPO) as the light source. Unlike low-repetition-rate laser systems, this source provides pulse energies that are sufficiently low for focusing the beams to diffraction-limited spots without damaging the sample, while at the same time maximizing signal yield due to the high pulse repetition rate. In addition, the spectral pulse width ensures a maximized signal to nonresonant background ratio. Furthermore, the light source delivers both the mid-IR and the near-IR pulses for the VR-SFG interaction, which form an intrinsically synchronized pulse pair. Second, we have adopted a collinear excitation geometry. Other than previous collinear implementations [12], both beams are focused to tight focal spots by the same objective, ensuring high spatial resolution and efficient signal collection efficiency in the epi direction. We show that this implementation allows for rapid VR-SFG multimodal nonlinear imaging of biologically relevant samples.
Figure 1 depicts the basic layout of the VR-SFG microscope. The tunable mid-IR (2.8–3.5 μm) and near-IR (765–850nm) beams are derived from a 6 ps pulse width, 76 MHz repetition rate OPO (Levante, APE Berlin). The mid-IR and near-IR beams are the idler and doubled-signal outputs of the OPO. The beams are collinearly combined on a dichroic combiner and sent to a microscope frame (IX-71, Olympus). The laser beams are focused onto the sample with a reflective objective (Edmund optics, 0.65NA, 74×). The gold mirror based objective provides achromatic focusing capabilities across a broad wavelength range. The sample is scanned using a piezo scanning stage, which currently limits the pixel dwell time to ~1 ms. The generated nonlinear signal is detected in both the forward and epi directions by photomultiplier tubes (PMT). 632 ± 22 nm bandpass filters were used for the epi PMT for capturing the SFG signal, while the second-harmonic generation (SHG) signal was simultaneously collected in the forward PMT with 400 ± 40 nm bandpass filters. The tunability of the mid-IR input enables accessibility to 2857 cm−1 −3570 cm−1 region, which covers most of the CH and OH vibrational modes. The SFG signals are in the 625–650 nm range where the spectral response of the PMT is optimal.
Fig. 1.
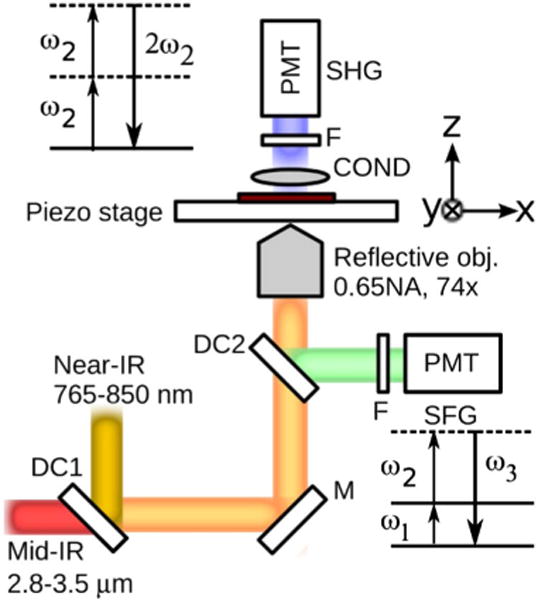
(Color online) Experimental setup of VR-SFG microscope. The mid-IR and near-IR beams are combined and sent to an inverted microscope. The SFG and SHG signals are detected in the forward and epi directions, respectively. DC1, DC2, dichroic mirrors; M, metallic mirror; F, bandpass filters; COND, condenser; PMT, photomultiplier tube. The energy level diagrams for VR-SFG and SHG processes are shown in the figure.
We first characterized the VR-SFG microscope by studying the power dependence and the size of the focal volume. For the power dependence studies, the strong χ(2) bulk response of a gallium phosphide (GaP) window was used. Figure 2(a) shows the variation of the SFG signal as a function of the incident power. The signal shows a clear linear dependence on the intensity of each of the input beams, as expected for the SFG response. The lateral focal field profile is examined by scanning 0.3 μm diameter barium titanate nanoparticles through focus. The nonresonant SFG image is shown in Fig. 2(b). The figure shows a line scan of a single nanoparticle indicating a full width at half-maximum (FWHM) of the focal distribution of ~0.6 μm, which is significantly smaller than what was obtained with previous VR-SFG microscopes. The inset shows the SFG image of a single nanoparticle. Note that the focal distributions of the near-IR and mid-IR beams differ in size because of the wavelength difference. The effective nonlinear excitation field largely resembles the near-IR profile.
Fig. 2.
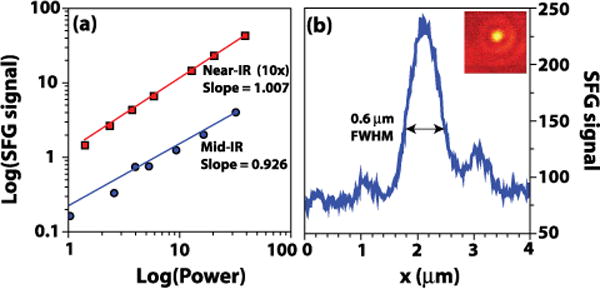
(Color online) (a) Power dependence of the SFG signal generated from a bulk GaP sample as a function of the mid-IR and near-IR power levels. The x and y axes are shown in log scale. (b) The SFG line scan of a.0.3 μm diameter barium titanate nanoparticle at focus. The inset shows the SFG image of a single nanoparticle.
We have used the VR-SFG microscope to image collagen fibers with vibrational sensitivity. The inherent noncentrosymmetry in the molecular ordering of the triple helical structure of the protein has been utilized extensively to image the nonresonant electronic SHG response of collagen [14]. In addition to the bulk electronic χ(2) response, collagen also exhibits strong vibrationally resonant SFG signatures, which have been studied with polarization-sensitive SFG spectroscopy [6]. Here we show that similar studies can be carried out with the submicrometer resolution of the VR-SFG microscope, which allows for a direct correlation between orientation, morphology, and spectroscopic properties of collagen fibers.
Figure 3 shows the SFG and SHG images of collagen. Collagen samples were extracted from rat tail tendons and thinly sliced rat kidney tissues (~10 μm thick) for imaging. The images (256 × 256 pixels) were acquired with a total acquisition time of 1 min. The mid-IR beam was tuned to 3.39 μm, which is resonant with the 2945 cm−1 methylene mode of collagen. The associated near-IR beam was at 775 nm, and provided the radiation for inducing both the VR-SFG signal and the SHG response from collagen. The power levels of the near-IR and mid-IR beams were 38 mW and 9 mW, respectively. In these imaging experiments the mid-IR and near-IR beams were cross-polarized. This configuration mainly probes term of the nonlinear susceptibility [(x,x,y) denotes the polarization of (ω3, ω2, ω1)with fibers oriented along the y direction] [6]. In Figs. 3(c) and 3(d) the VR-SFG and SHG images of collagen in mouse kidney tissue sections are shown, illustrating that fibrillar details can be resolved with VR-SFG microscopy. Similar to epi-detected SHG radiation [14], the SFG signal in the epi channel results predominantly from phase-matched radiation that is subsequently backscattered in the tissue. Although the SHG resolves the fibrillar structure with somewhat greater detail due to the better lateral resolution, the SFG signal contains molecular bond-specific information from the same structure that cannot be resolved with electronic SHG. Bond-specific information allows a more detailed analysis of the molecular structure and orientation of collagen fibrils in tissues. This emphasizes the utility of combining SFG with existing multiphoton microscopy techniques.
Fig. 3.
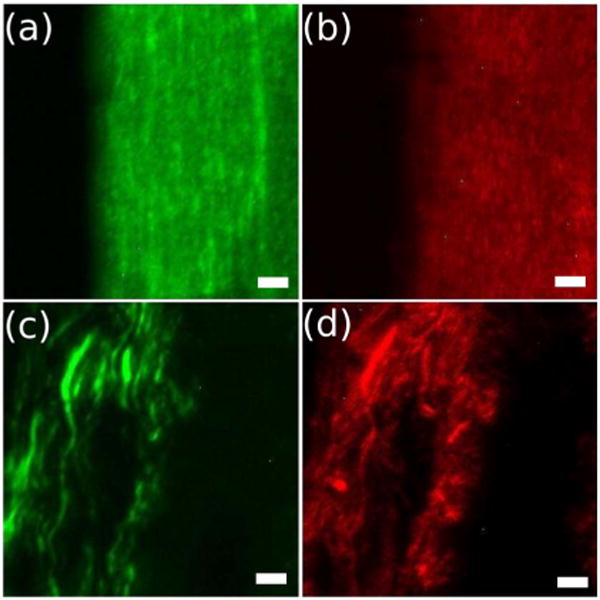
(Color online) Multimodal images of collagen from (a), (b) rat tail tendon and (c),(d) mouse kidney tissue section samples. (a),(c) VR-SFG image probing the 2945 cm−1 methylene mode and, (b),(d) SHG image of collagen. The scale bar is 20 μm.
To demonstrate the vibrational sensitivity of the VR-SFG microscope, we examined the spectral dependence of the collagen signal from rat tail tendon by spectrally tuning the mid-IR beam. Figure 4 shows images of collagen at (a) 2959 cm−1 and (b) 2867 cm−1, which are on- and off-resonance with the methylene stretching vibration of collagen, respectively [6]. The SFG images, which are corrected for intensity differences at the two wavelengths, confirm the vibrational origin of the signal. In comparison with the vibrationally resonant signal, the nonresonant bulk SFG signal from collagen was found to be very weak in the epi direction, which further improves the vibrational selectivity of the VR-SFG microscope. We note that the SFG signals measured here are stronger than the corresponding SHG signals, which suggests that SFG images can, in principle, be acquired at acquisition speeds similar to those in laser scanning SHG microscopes.
Fig. 4.
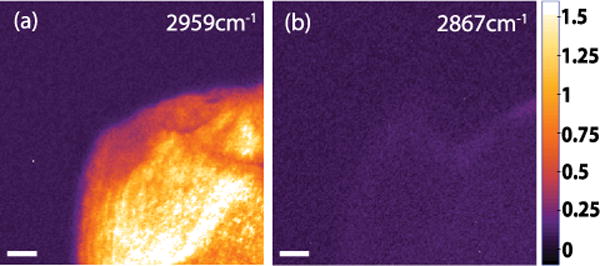
(Color online) Spectral scan images of collagen with the VR-SFG microscope. SFG images at (a) on-resonance, 2959 cm−1, and (b) off-resonance, 2867 cm−1. The scale bar is 20 μm.
In conclusion, we have demonstrated a new scheme for VR-SFG microscopy using a high-repetition-rate picosecond light source and a collinear excitation geometry. This approach permits tight focusing of the incident beams, which ensures a high spatial resolution and a high degree of compatibility with existing nonlinear optical microscopy modalities. The favorable excitation conditions allow much faster imaging than what was achieved with previous implementations. The current acquisition times are limited only by the scanning stage and not by the signal strength. The use of scanning mirrors and dedicated mid-IR imaging optics would enable fast imaging speeds comparable to what can be achieved in laser scanning multiphoton microscopes. We expect that with further improvements of the optical elements, including the focusing objective, the sensitivity of the VR-SFG microscope may be sufficient for detecting molecular-specific signals from planar interfaces. Hence, in addition to biological imaging applications, the VR-SFG microscope may grow into a sensitive instrument for studying surface-bound molecules with submicrometer spatial resolution.
Acknowledgments
This work was supported by the National Science Foundation (NSF), grants CHE-0533162, 0847097 to E. O. P. and 0802913, 1013071 to N.-H. G. We thank Monica Straatmann for preparing the rat tail tendons.
References
- 1.Boyd RW. Nonlinear Optics. Academic Press; 2003. [Google Scholar]
- 2.Shen YR. Nature. 1989;337:519. [Google Scholar]
- 3.Chen Z, Shen YR, Somorjai GA. Annu Rev Phys Chem. 2002;53:437. doi: 10.1146/annurev.physchem.53.091801.115126. [DOI] [PubMed] [Google Scholar]
- 4.Stiopkin IV, Jayathilake HD, Bordenyuk AN, Benderskii AV. J Am Chem Soc. 2008;130:2271. doi: 10.1021/ja076708w. [DOI] [PubMed] [Google Scholar]
- 5.Fu L, Liu J, Yan ECS. J Am Chem Soc. 2011;133:8094. doi: 10.1021/ja201575e. [DOI] [PubMed] [Google Scholar]
- 6.Mendoza IR, Yankelevich DR, Wang M, Reiser KM, Frank CW, Knoesen A. Biophys J. 2007;93:4433. doi: 10.1529/biophysj.107.111047. [DOI] [PMC free article] [PubMed] [Google Scholar]
- 7.Flörsheimer M, Brillert C, Fuchs H. Langmuir. 1999;15:5437. [Google Scholar]
- 8.Hoffmann DMP, Kuhnke K, Kern K. Rev Sci Instrum. 2002;73:3221. [Google Scholar]
- 9.Hernandez M, Chinwangso P, Cimatu K, Srisombat L, Lee TR, Baldelli S. J Phys Chem C. 2011;115:4688. [Google Scholar]
- 10.Nakai IF, Tachioka M, Ugawa A, Ueda T, Watanabe K, Matsumoto Y. Appl Phys Lett. 2009;95:243304. [Google Scholar]
- 11.Miyauchi Y, Sano H, Okada J, Yamashita H, Mizutani G. Surf Sci. 2009;603:2972. [Google Scholar]
- 12.Inoue K, Fujii M, Sakai M. Appl Spectrosc. 2010;64:275. doi: 10.1366/000370210790918481. [DOI] [PubMed] [Google Scholar]
- 13.Locharoenrat K, Sano H, Mizutani G. Phys Status Solidi C. 2009;6:304. [Google Scholar]
- 14.Campagnola PJ, Millard AC, Terasaki M, Hoppe PE, Malone CJ, Mohler WA. Biophys J. 2002;82:493. doi: 10.1016/S0006-3495(02)75414-3. [DOI] [PMC free article] [PubMed] [Google Scholar]