

Abstract
The lateral preoptic-rostral lateral hypothalamic continuum (LPH) receives projections from the nucleus accumbens and is believed to be one route by which nucleus accumbens signaling affects motivated behaviors. While accumbens firing patterns are known to be modulated by fluctuating levels of cocaine, studies of the LPH's drug related firing are absent from the literature. The present study sought to electrophysiologically test whether drug-related tonic and slow-phasic patterns exist in the firing of LPH neurons during a free-access cocaine self-administration task. Results demonstrated that a majority of neurons in the LPH exhibited changes in both tonic and slow phasic firing rate during fluctuating drug levels. During the maintenance phase of self-administration, 69.6% of neurons exhibited at least a two-fold change in tonic firing rate when compared to their pre-drug firing rates. Moreover, 54.4% of LPH neurons demonstrated slow-phasic patterns, specifically ‘progressive reversal’ patterns, which have been shown to be related to pharmacological changes across the inter-infusion interval. Firing rate was correlated with calculated drug level in 58.7% of recorded cells. Typically, a negative correlation between drug level and firing rate was observed, with a majority of neurons showing decreases in firing during cocaine self-administration. A small percentage of LPH neurons also exhibited correlations between locomotor behavior and firing rate, however, correlations with drug level in these same neurons were always stronger. Thus, the relationship between LPH firing and locomotion is weak, at best. Overall, these findings suggest that a proportion of LPH neurons are sensitive to fluctuations in cocaine concentration and may contribute to neural activity that controls drug taking.
1.0 Introduction
Psychostimulants are a highly addictive group of drugs that produce diverse physiological and psychological effects such as arousal, locomotion, stereotypy, and changes in affective state (Lyon & Robbins, 1975; Delfs et al., 1990; Burgdorf et al., 2001;Barker et al, 2013). Each of these changes is dependent on the body concentration of the drug. For instance, while low doses of cocaine produce heightened locomotion, higher doses decrease locomotion and give rise to stereotypical behaviors (Lyons and Robbins, 1975). Moreover, during the rapid “load” phase at the start of self-administration, positive affect peaks. Subsequently negative affect predominates during the maintenance phase of self-administration, presenting as animals' drug levels fall below satiety and animals reinitiate responding for self-infusions (Barker et al. 2013).
Psychostimulant effects are dependent on the nucleus accumbens (NAcc) and its dopaminergic and glutamatergic afferents. For instance, 6-OHDA lesions within NAcc attenuate cocaine self-administration (Pettit et al., 1984, Roberts et al., 1977). NAcc involvement in motivated behaviors has long been hypothesized to involve the ventral pallidum (VP)--the NAcc's primary target (Mogenson et al. 1980). However, recently it has been shown that manipulations of the lateral preoptic-lateral hypothalamic continuum (LPH) readily produce enhanced locomotion while the same manipulation in the VP does not (Zahm et al. 2013). Therefore, the NAcc may carry out diverse drug-related effects through projections to discrete structures.
It has been shown that dopaminergic, glutamatergic and opioidergic agonism or GABAergic antagonism of the NAcc produce robust increases in locomotion (Mogenson & Nielsen 1983; Shreve & Uretsky 1988; Swerdlow et al. 1986). Given that this accumbens-stimulated locomotion is eliminated by injections of GABA agonists centered in LPH (Shreve & Uretsky, 1988, 1991), and given the robust projection from portions of the NAcc to the LPH (Usuda et al. 1998), the LPH has recently emerged as a relevant participant in facilitating certain behaviors elicited by NAcc signaling. In order to investigate the contribution of LPH to the effects of psychostimulants, we examined the firing patterns of LPH neurons during cocaine self-administration.
Ventral striatopallidal neurons exhibit fluctuations in firing rate during the minutes between self-infusions of cocaine (termed “slow-phasic firing patterns”; Peoples and West 1996; Nicola and Deadwyler, 2000; Root et al. 2012). Over a longer timescale, across the entire session (termed “tonic firing patterns”), both accumbal and VP neuron firing rates correlate with self-administered cocaine levels. Psychostimulant self-administration is driven by cocaine levels (Norman & Tsibulsky, 2006; Root et al., 2011; Zimmer et al., 2013), suggesting that these firing patterns participate in controlling cocaine intake. If LPH is an important contributor to the effects of psychostimulants, it might be expected that LPH neurons are also sensitive to fluctuations in self-administered cocaine levels. Therefore, the present study determined the slow phasic and tonic firing patterns of LPH neurons during a free-access cocaine self-administration (SA) task.
2.0 Materials and Methods
2.1 Subjects and Surgery
Male Long Evans rats (n = 18, Charles River, Raleigh, NC) were individually housed. All animals were provided ad libitum access to water and sufficient food to bring them to a pre-operative weight of ∼330g. Subjects were anesthetized with sodium pentobarbital (50 mg/kg i.p..; Abbott Laboratories, North Chicago, IL) and administered atropine methyl nitrate (10 mg/kg, I.P.; Sigma, St. Louis, MO) and penicillin G (75,000 U/0.25 ml, i.m.). Anesthesia was maintained with sodium pentobarbital (5–10 mg/kg, i.p.) and ketamine hydrochloride (60 mg/kg, i.p.; Fort Dodge Laboratories, Fort Dodge, IA). A catheter was implanted into the right jugular vein and exited through a J-shaped stainless steel cannula. An array of either 16 microwires (California Fine Wire, Grove City, CA) arranged in two parallel rows of eight wires (spaced 2.2 mm on the anteroposterior axis and 0.6 mm mediolaterally) with the medial eight wires targeting the LPH or two bilateral arrays each with two parallel rows of four wires (1mm antero-posterior spacing and 0.3mm mediolateral spacing) all targeting the LPH were implanted. Both the j-shaped cannula and array headstage were secured to the skull using 5 jewelers’ screws and dental cement.
Animals were housed in the SA chamber for the remainder of the experiment and allowed to recover for at least 7 days prior to training. Chambers were located inside a soundproof, ventilated box which was supplied with white noise (75 dB). Except during SA, a 200 μL infusion of heparinized-saline was delivered every twenty-five minutes around the clock by a mechanically-controlled syringe pump to preserve catheter patency. Occasionally, a brief period of anesthesia was induced by an infusion of methohexital sodium (10 mg/kg, i.v.) in order to check the animal's patency or to attach the animal into the electrophysiological recording apparatus. All protocols were performed in compliance with the Guide for the Care and Use of Laboratory Animals (NIH, Publication 865–23) and have been approved by the Institutional Animal Care and Use Committee, Rutgers University.
2.2 Self-Administration
Daily cocaine SA sessions began with insertion of a non-retractable glass lever on the side wall of the Plexiglas chamber and illumination of the house light within the sound attenuating chamber. To initiate the first trial, a stimulus light over the lever was illuminated. One lever press in the presence of the stimulus light immediately extinguished the stimulus light, and initiated an intravenous infusion of cocaine (0.24mg/0.2ml infusion over 7.5 s) and a 7.5 s tone (3.5 kHz, 70dB) which co-terminated with the infusion pump. The stimulus light remained off for 40 sec during which lever presses had no programmed consequences. Sessions lasted until 80 infusions had been earned or 6 hours had elapsed, whichever occurred first. Drug-levels during self-administration sessions were calculated as described previously (Root et al., 2011).
2.3 Electrophysiological recordings
Hardware used for single-unit recordings has been described elsewhere (Root et al. 2010). The neural signals were led from the animal's head, through a harness, and then to a fluid and electronic swivel (Airflyte Electronics, Bayonne, NJ or Plastics One Inc., VA). Electrical signals were sampled (50 kHz sampling frequency for each recording wire), digitized, time stamped (0.1 ms resolution), and stored using a computer running Datawave software (Longmont, CO).
Self-administration during recordings lasted until animals had earned 50 infusions, at which point contingencies ended and the lever was removed. Neural recording sessions began half an hour prior to the start of SA (i.e. 30 minutes prior to house light illumination and insertion of the lever) and continued for one additional hour after the termination of SA contingencies (by removal of the glass lever). Each animal received one to three neural recording sessions in order to record each of the 15 non-differential probes one time (five or fifteen probes recorded/session, depending on hardware).
2.4 Histology
Animals were euthanized with sodium pentobarbital (300 mg/kg, i.p.), and anodal current (50 μA for 4 sec) was passed through each electrode. Animals were then perfused with formalin-saline (n=12) or paraformaldehyde (n=6). Brains were post-fixed overnight and then transferred to a 30% sucrose solution. Sections were taken coronally (50 μm) through the LPH. Tissue was stained in a 5% potassium ferrocyanide & 10% HCl and counterstained with either a 0.1% neutral red solution (n=12) or processed for anti- Calbindin D28k immunohistochemistry (ImmunoStar, Inc., Hudson WI; n=6) as described previously (Root et al, 2013).
Wire tracks for every wire in each array were traced from the point at which they penetrated cortex and down to the lesion produced at the microwire tip. In instances where the three-dimensional location of each and every microwire in the array was not able to be accurately tracked, the entire animal was removed from the dataset (n=1). Experimenters blind to results established the location of tracked microwire tips using camera lucida and coronal plates from Paxinos & Watson (1997). The locations of microwires were identified by three separate experimenters and were included for analysis only when all experimenters were in agreement. Wires were included for analysis if they were localized along the lateral preoptic-rostral lateral hypothalamic continuum. Any microwires localized within 100 μm of any non-LPH brain region border were excluded from analysis.
2.5 Isolation/discrimination of individual waveforms
Analysis of neural data was conducted using SciWorks software (Datawave Technologies) as described in detail elsewhere (Root et al., 2012). Briefly, the software was used to isolate neural waveforms from ambient noise and to discriminate different neurons recorded by the same microelectrode. Several measures were taken to identify individual neurons on probes containing more than one waveform. Isolation of neurons was based on multiple measures including spike height, valley and peak amplitudes, valley and peak times, and voltage ranges at selected time points on the ascending and descending limbs of the waveforms. Waveforms were included for analysis if 1) waveforms presented with canonical patterns of neural activity including a clearly defined action potential and afterhyperpolarization, 2) the amplitude of putative neurons exhibited at least a 2:1 signal: noise ratio, 3) waveform parameters remained stable throughout the entire session, and 4) an interspike interval (ISI) histogram showed that no discharges occurred during the neuron's natural refractory period (i.e., ∼1.4 to 2 ms).
2.6 Analysis of tonic firing patterns
Changes in tonic firing rate that occurred over the hours of SA were computed relative to the 20 min period just prior to the start of SA (Pre-SA). SA related changes in firing rate were measured by a change ratio ‘Δ=[Bn/(A+Bn)]-0.5′ where (‘A’) equaled the baseline firing rate, defined as mean firing rate during the 20 minutes of the Pre-SA period. This baseline firing rate was compared to two separate phases of the SA period: the load up phase (‘B1’), defined as the period between the first infusion and the tenth infusion, and the maintenance phase (‘B2’), the period between the 10th infusion and the end of the SA period. This division was made in order to distinguish between periods of rapidly rising (load-up) versus steadily fluctuating (maintenance) drug levels. Change scores (Δ) below zero represent decreases in firing rate when compared to baseline, while those above zero represent increases compared to baseline (zero representing no change and change scores of -0.33 or 0.33 representing two fold decreases or increases, respectively). Post SA changes in firing rate were also measured. In this case, (‘A’) equaled the mean firing rate during baseline and (‘B3’) equaled the mean firing rate from the Post-Drug period.
A one sample t-test was used to examine changes in the firing of LPH neurons when comparing the pre-drug period to either the loading or maintenance periods. The absolute value of change scores (Δ) were compared to an expected value of Δ= 0 (No change from baseline). Absolute values for all change scores were taken in order to examine the magnitude of the change observed during cocaine self-administration while accounting for heterogeneity in the direction of cocaine induced changes.
2.7 Slow Phasic Analysis
2.7.1 Categorization using Principle Components Analysis
The initial 10 infusions during the drug-loading period were excluded in order to focus the slow-phasic analysis on the maintenance period during which drug levels fluctuate within a narrow range. A peri-event time histogram (PETH) was then created for each neuron. Each PETH displayed neuronal discharges (spikes/sec) that occurred from -4 minutes to +4 minutes relative to the termination of each infusion (i.e. offset of infusion pump) in 12 s bins. In this task, rats’ average inter-infusion interval lasts ∼8 min (Peoples and West, 1996; Fabbricatore et al. 2010; Root et al. 2012). Therefore the ± 4 minute epoch represents the entire cycle of fluctuating drug levels experienced by animals, and assures that preceding or subsequent infusions are excluded from individual trials summed by the PETH. Given that the effects of cocaine are not immediate, PETHs were centered on the infusion offset in order to allow time for each infusion to take effect. Neurons were categorized using a principal components analysis (PCA) as described in detail previously (Root et al., 2012). In this case, the PCA is used as a “pattern detector” as it is designed to compare different subjects (neurons) amongst each other when individual subjects have been repeatedly measured over the inter-infusion interval. Thus, this type of PCA enables the creation of a taxonomy (or typology) of different firing patterns over the inter-infusion interval. As part of this process, each individual neuron's firing pattern was z-scored based on the mean firing rate and standard deviation over the inter-infusion interval (± 4 minutes from the termination of each infusion). This serves to normalize all neurons such that the firing patterns of neurons with high-and low-firing rates can be compared on the same scale.
The PCA involved a two stage analysis using PSW 17.0 (SPSS, Chicago, IL). The first stage consisted of a direct oblimin rotation on all neural data. This stage was used to ensure that components were orthogonal and to determine the number of components that would be retained. Components were retained only if they had an eigenvalue >1 and were retained using the elbow method. That is, factors that explain a large proportion of the variance above the ‘elbow’ were retained, while those that poorly explain variance in the data within the level portion of the scree plot below the elbow were removed.
Based on the results from stage one, the second stage of the analysis was run on the reduced dataset using a forced two-component solution (varimax rotation). The solution was then used in order to create a taxonomy of firing patterns in which neurons were placed into different groups based on their component loading values. To define different categories, neurons with negative, positive, or a combination of negative and positive loadings were categorized separately. Neurons with loadings ≤ |0.32| (a standard PCA cutoff denoting that at least 10% of a neuron's variance is explained by the component; Comrey, 1973; Tabachnick & Fidell, 1989) on all components in the second stage were included together in a “no change” category.
2.7.2-Determination of reversal type and direction
Previous analyses of slow phasic data in this laboratory (Root et al., 2012; Fabbricatore et al., 2010; Peoples & West, 1996; Peoples et al., 1998) have defined two types of post-infusion changes (increase and decrease) and three different reversal patterns (early, progressive, and late). To define the type of post-infusion change and reversal for each component, Anderson-Rubin component scores derived from the stage two PCA were imported into SAS PROC LOESS. Subsequently, the minimum and maximum values of the Anderson-Rubin scores in the 4 minutes before (pre-infusion) and after (post-infusion) were computed. For Anderson-Rubin curves where the difference between the post-infusion max and pre-infusion min was greater than the difference between the post-infusion min and pre-infusion max, the post-infusion maximum was defined as the “overall maximum” and the pre-infusion minimum was defined as the “overall minimum.” In the reversed situation, the pre-infusion maximum was defined as the “overall maximum” and the post-infusion minimum was defined as the “overall minimum.”
Once the overall minimum and maximum of each component had been determined, the infusion change was calculated using |overall max- overall min|. Components that exhibited changes of ≤ 0.26 standard deviations (corresponding to a 10% change in either direction from the mean; total of 20%), were designated as exhibiting “no change.” Change scores of >0.26 were designated as a post-infusion “decrease” if the difference between the post-infusion max and pre-infusion max was less than zero and designated as a post-infusion “increase” if the difference was greater than zero.
A reversal type was also determined for each component using the Anderson-Rubin curves. This was done by calculating the values that corresponded to a 5% and 95% change from the post-infusion maximum (post-infusion increase) and minimum (post-infusion decrease), respectively. The value corresponding to a 5% change was defined as the reversal onset, while the value corresponding to the 95% change was designated as the reversal completion. If the reversal onset and completion occurred in the post-infusion period (0 to +4 minutes), the component was categorized as an “early reversal” (ER). If both the reversal onset and completion occurred in the pre-infusion period (-4 to 0 minutes) the component was categorized as a “late reversal” (LR). Finally, if the reversal onset occurred in the post-infusion period and the reversal completion occurred in the pre-infusion period, the component was categorized as a “progressive reversal” (PR).
2.8 Correlation of Firing Rate and Calculated Drug Level
To assess a potential relationship between drug level and firing rate, the average calculated drug level and average firing rate within each 0.5 min bin of the maintenance phase of self-administration were paired and all such pairs were used to determine the correlation. Given that correlations were performed for each of the 46 recorded neurons, the critical value was set at |r=0.321|. This value corresponds to r2=0.103 (10.3% of variance in firing rate accounted for by drug level or vice versa). While not being used as an inferential test, these values correct for multiple comparisons and correspond to critical values for α=0.001.
2.9 Correlation of Firing Rate and Locomotor Activity
A subset of neurons (n=28) were recording using hardware and software that allowed for motion tracking. For these neurons, the potential relationship between firing rate and locomotor activity was assessed by tracking animals’ locations in the chamber using Datawave Video Bench software. To accomplish this, a camera was mounted outside the chamber, approximately 23 cm from the front Plexiglas wall, and elevated 30 cm above the chamber's floor. In order to enable tracking, animals’ neural recording harnesses were tagged with a pink tape immediately above the head stage. Pink tape was selected as it contrasted against the blue chamber background. Datawave Video Bench software was then used to track and record the X and Y coordinates of the pink marker every 0.033 s throughout neural recording sessions. For each 30 second bin, the distance traveled by animals was assessed using the formula:
Where:
D(bin) = total distance traveled in a given 30 sec bin
N = number of frames/position samples in a 30 sec bin
dt(n) = distance travelled in a given frame
xt(n) and yt(n) the animals coordinate at a given frame
xt(n-1) and yt(n-1) the animal's coordinate at the preceding frame.
The total distance traveled during each 30s bin and the average firing rate during that 30s bin were paired. These pairs were then used to determine the correlation. Similar to the correlation of calculated drug level and firing rate the critical value for correlations between locomotion and firing rate was set at |r=0.321|. Although distance/time formally yields average velocity, given the heterogeneous nature of motor behavior during SA, e.g., numerous stops and starts, turns, rears, episodes of focused stereotypy, etc., we interpret distance traveled in 30-sec bins as a general measure of locomotor activity.
3.0 Results
3.1 Behavior
Representative behavioral data for animals in this task have been reported previously (Root et al., 2010; Fabbricatore et al., 2010). Briefly, all animals were trained for at least two weeks and had acquired the task prior to electrophysiological recordings, as evidenced by an increase in the number of infusions, cumulative daily drug intake, and operant responses across training sessions. The behavioral profile for animals consisted of an initial, brief ‘load up’ period of rapidly spaced infusions followed by four to five hours of ‘maintenance’ comprising intermittent drug-seeking responses at regularly spaced inter-infusion intervals (III) that were predominated by focused stereotypy.
3.2 LPH pre-SA recordings
Of 192 wires targeting the LPH, 46 were localized in the LPH, did not fall within 100 μm of the border for any adjacent structures, and exhibited a single-unit (Figure 1). Prior to the start of SA, LPH neurons fired at 1.26 ± 0.23 Hz (Mean ± SEM). These firing rates are faster than those we have reported in the NAcc (0.53 ± 0.12 Hz; Fabbricatore et al., 2009) but slower than rates we have previously observed in the VP (6.54 ± 2.22 Hz; Root et al., 2012).
Figure 1.
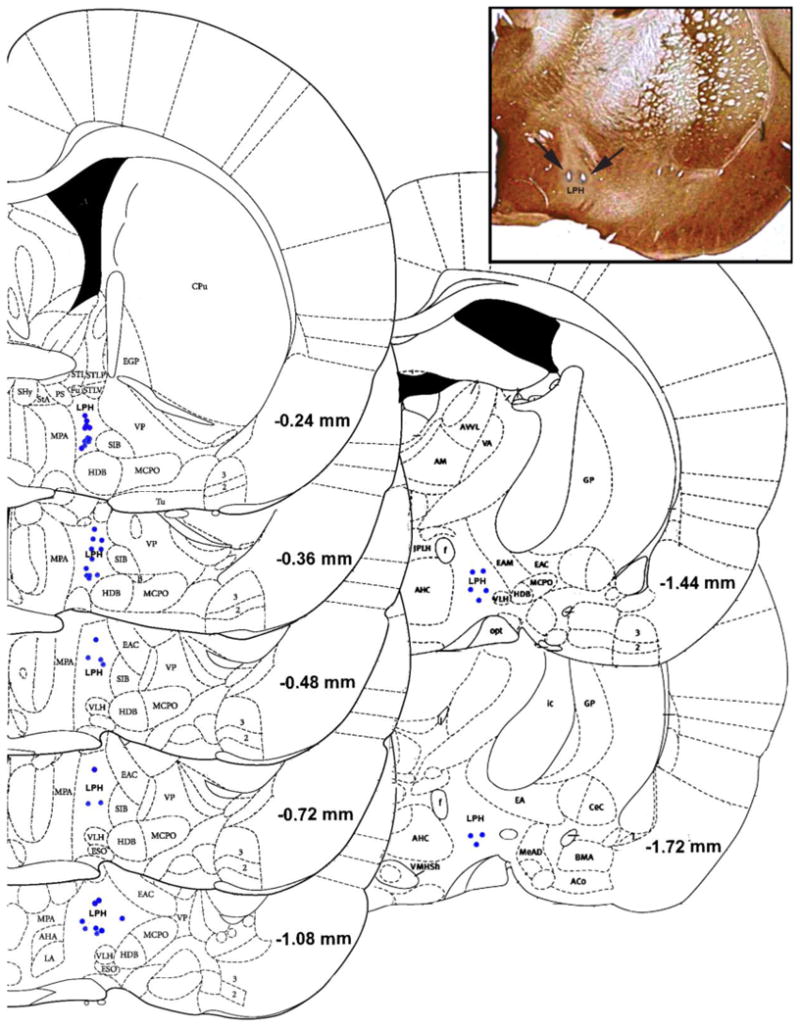
A diagram of wire placements within the lateral preoptic-rostral lateral hypothalamic continuum (LPH) for wires exhibiting a single unit. Each blue dot represents a single localized microwire tip. The inset shows a representative histological slice with wires localized in the LPH. Arrows point to the lesions created at the microwire tips. The section is stained for antibodies raised against Calbindin D28k.
3.1 Tonic firing patterns
To examine whether LPH neurons are modulated during cocaine self-administration, we initially analyzed the changes in firing rate of LPH neurons during distinct components of the SA task (load phase, maintenance phase, and post-drug availability phase) compared with pre-SA baseline firing rates. Self-administration of cocaine immediately changed the firing patterns of LPH neurons [load-up: t(44)=6.95, p < 0.001] (Figures 2 & 3). During the drug loading period, 39.1% of neurons (n=18) exhibited at least a two-fold change in firing rate when compared to baseline rates. These changes typically consisted of decreases from baseline, with 61% of these neurons (n=11/18) exhibiting decreasing patterns and 39% exhibiting increases in firing rate (n=7/18; Figure 3). As drug levels stabilized into the maintenance period, changes from baseline became even more pronounced [t(44) =9.98, p < 0.001]. During the maintenance phase of SA, 69.6% of neurons (n=32) showed two-fold or greater changes in firing rate when compared to pre-drug firing rates (Figure 3). Similar to the loading phase, the predominant profile of these neurons was a tonic decrease (81.2%; 26/32) with only 18.8% (6/32) of neurons exhibiting tonic increases. While firing patterns began to return to pre-SA levels following the end of cocaine self-administration, drug-induced changes in firing rate remained different from baseline during the post-drug period (40-60 minutes following the last infusion; t(44) = 11.06, p < 0.001). Thus, LPH neurons are highly modulated during cocaine self-administration.
Figure 2.
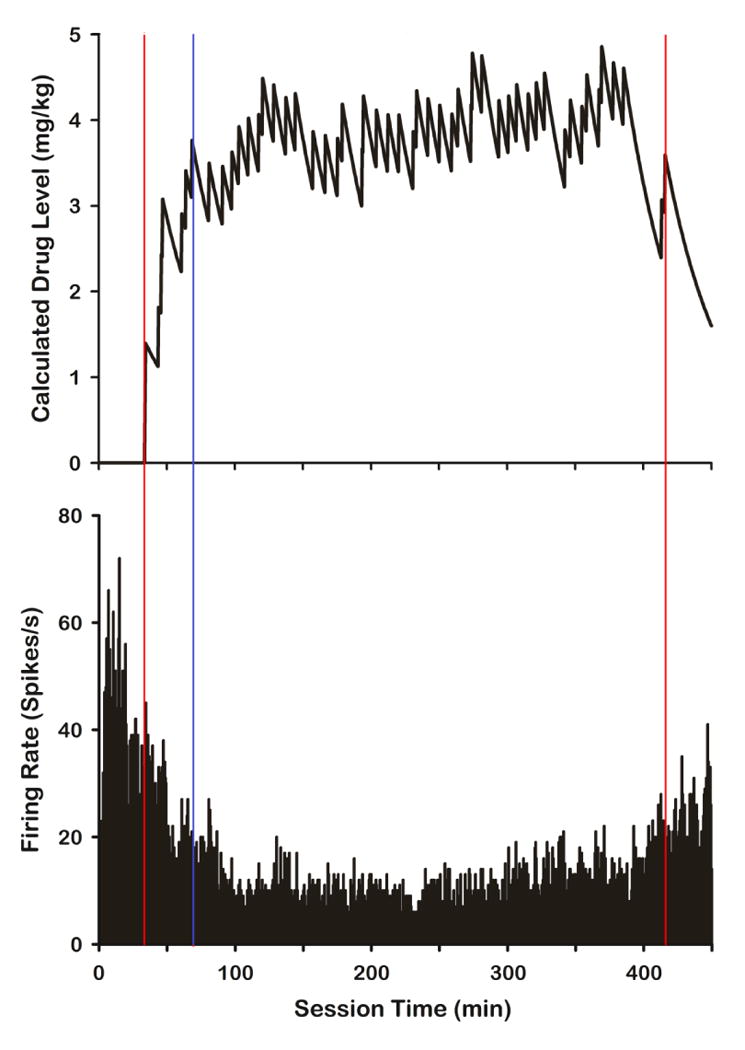
Calculated drug levels and the corresponding firing rate for a neuron that shows an inhibitory response to cocaine self-administration and a negative correlation between calculated drug level and firing rate. Red lines demarcate the start and end of self-administration while the blue line designates the end of the loading phase and start of the maintenance phase.
Figure 3.
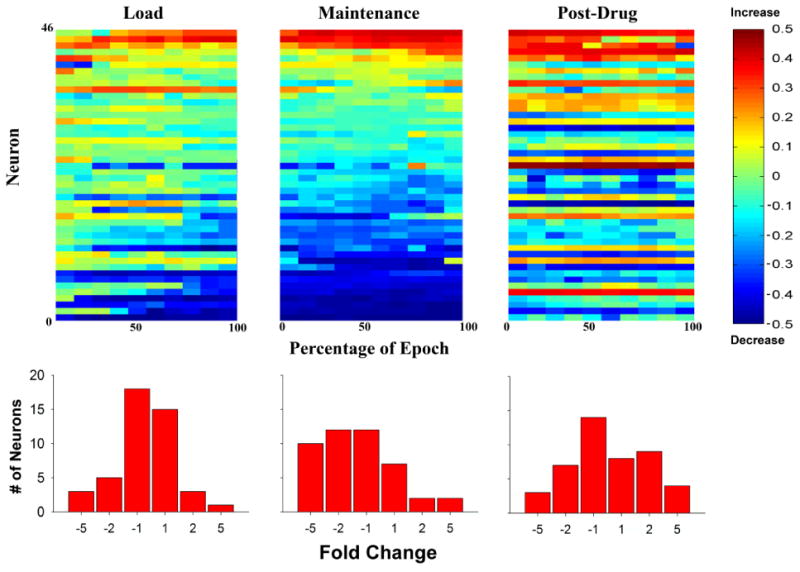
Top: Heatmaps showing firing rate change scores for all individual neurons (neurons 1-46; y-axes) across the load up, maintenance, and recovery periods. For each of these epochs, change scores for individual neurons [Δ firing rate (FR)= (EpochFR/ (Pre-drug BaselineFR + EpochFR))-0.5] are shown across ten bins (x-axes), each representing 10% of that epoch. Change scores below 0 represent decreases in firing rate when compared to the pre-drug baseline, while those above 0 represent increases in firing rate compared to baseline. Bottom: Frequency histogram displaying tonic firing rate changes across load up, maintenance and recovery. Histograms show the fold change when comparing each portion of the recording session (Load, Maintenance, Post-Drug) to the pre-drug baseline period. Change scores are normally distributed around no change during the loading period, but show a pronounced change during the maintenance period. Changes in firing then begin to normalize again during the post-drug recovery period.
3.2 Slow Phasic
To examine if LPH neurons are modulated specifically with respect to fluctuations in drug level over the inter-infusion interval we examined the slow-phasic firing patterns of LPH neurons. Analysis of the ± 4 min surrounding the cocaine infusion, using a principal components analysis (PCA) yielded 2 viable components; 82.61% of LPH neurons (n=38/46) exhibited loadings of greater than |0.32| on one or both components (Table 1). Categories of different firing patterns were created based on the direction and number of components onto which each LPH neuron loaded. For each observed category, a factor score was generated and subsequently tested for the type of post infusion change (increase, decrease or no change) and reversal type (early, progressive, or late reversal).
Table 1. Rotated Component Matrix.
| Neuron | Component 1 | Component 2 | Category | Reversal Direction | Reversal Type |
|---|---|---|---|---|---|
|
| |||||
| Loading Value | |||||
| 1 | -.431 | - | -1 | Inc | PR |
| 2 | -.406 | - | 1 | Dec | PR |
| 3 | .817 | - | 1 | Dec | PR |
| 4 | .890 | - | 1 | Dec | PR |
| 5 | .554 | - | 1 | Dec | PR |
| 6 | .441 | - | 1 | Dec | PR |
| 7 | .849 | - | 1 | Dec | PR |
| 8 | .587 | - | 1 | Dec | PR |
| 9 | .870 | - | 1 | Dec | PR |
| 10 | .589 | - | 1 | Dec | PR |
| 11 | .605 | - | 1 | Dec | PR |
| 12 | .933 | - | 1 | Dec | PR |
| 13 | .546 | - | 1 | Dec | PR |
| 14 | .604 | - | 1 | Dec | PR |
| 15 | .812 | - | 1 | Dec | PR |
| 16 | .814 | - | 1 | Dec | PR |
| 17 | .509 | - | 1 | Dec | PR |
| 18 | - | -.424 | -2 | Dec | LR |
| 19 | - | -.630 | -2 | Dec | LR |
| 20 | - | -.854 | -2 | Dec | LR |
| 21 | - | .788 | 2 | Inc | LR |
| 22 | - | .702 | 2 | Inc | LR |
| 23 | - | .394 | 2 | Inc | LR |
| 24 | - | .557 | 2 | Inc | LR |
| 25 | - | .782 | 2 | Inc | LR |
| 26 | - | .478 | 2 | Inc | LR |
| 27 | - | .755 | 2 | Inc | LR |
| 28 | - | .730 | 2 | Inc | LR |
| 29 | - | .698 | 2 | Inc | LR |
| 30 | - | .727 | 2 | Inc | LR |
| 31 | .692 | .503 | 1,2 | Dec | PR |
| 32 | -.783 | .391 | 1,2 | Dec | PR |
| 33 | .350 | .885 | 1,2 | Dec | PR |
| 34 | .557 | .543 | 1,2 | Dec | PR |
| 35 | .504 | .745 | 1,2 | Dec | PR |
| 36 | .564 | -.435 | 1,-2 | Dec | PR |
| 37 | -.641 | -.459 | -1,-2 | Inc | PR |
| 38 | -.849 | -.357 | -1,-2 | Inc | PR |
| 39 | - | - | NA | - | - |
| 40 | - | - | NA | - | - |
| 41 | - | - | NA | - | - |
| 42 | - | - | NA | - | - |
| 43 | - | - | NA | - | - |
| 44 | - | - | NA | - | - |
| 45 | - | - | NA | - | - |
| 46 | - | - | NA | - | - |
Over half of LPH neurons exhibited progressive reversal (PR) firing patterns (n=25, 54.35%; Figures 4 & 5; Table 2, showing a relationship between drug level and firing pattern across the inter-infusion interval (Peoples et al., 1998). Of PR neurons, 22/25 (88%) were categorized as decrease PR neurons with the remaining PR neurons (n=3/25; 12%) exhibiting increase PR patterns. Over one-quarter of LPH neurons (13/46; 28.26%) exhibited a late reversal (LR) pattern (Figures 4 & 5; Table 2). In contrast to the trend observed for progressive reversal neurons, most LR neurons were classified as increasing patterns (n=10/13; 76.92%), with only a few LR neurons showing decreasing patterns (n=3/13; 23.08%). No early reversal firing patterns were observed (Table 2). The remaining neurons (n=8, 17.4%) did not exhibit any type of slow phasic pattern (i.e., did not load on any component produced by the PCA). These results demonstrate that LPH neurons are specifically modulated during the minutes between self-administered cocaine infusions.
Figure 4.
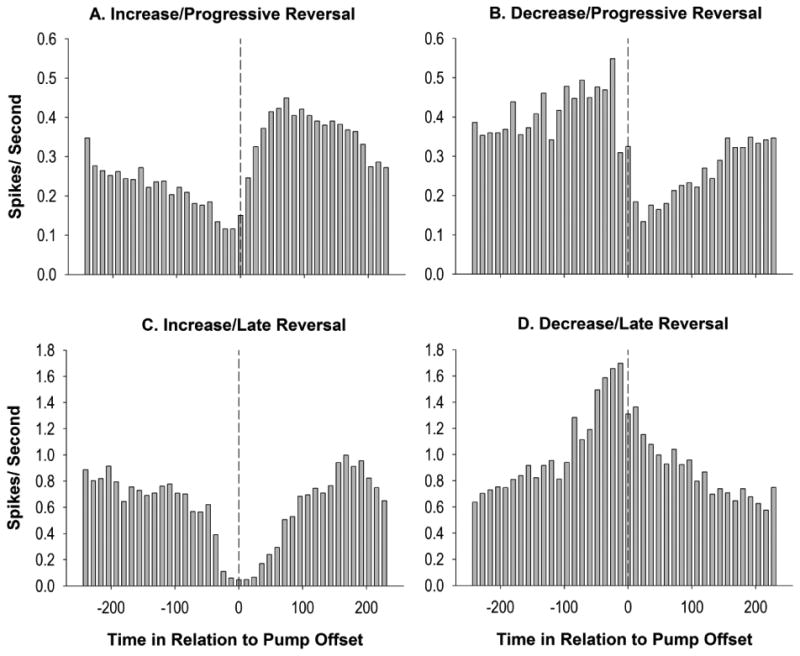
Examples of raw firing patterns of individual neurons for the observed progressive (A & B) and late reversal (C & D) patterns. Time in relation to the infusion offset (seconds) is shown on the x-axis (infusion offset at time zero), the window around the inter-infusion intervals spans between -4 minutes prior to the infusion and +4 minutes following the infusion. Examples of post-infusion increases are shown in panels A &C, while post-infusion decreases are shown in panels B & D. Decrease/progressive reversals (B) were the most commonly observed pattern and were more common than increase/progressive reversals. In contrast, increase/late reversal patterns were more common than decrease/late reversal patterns.
Figure 5.
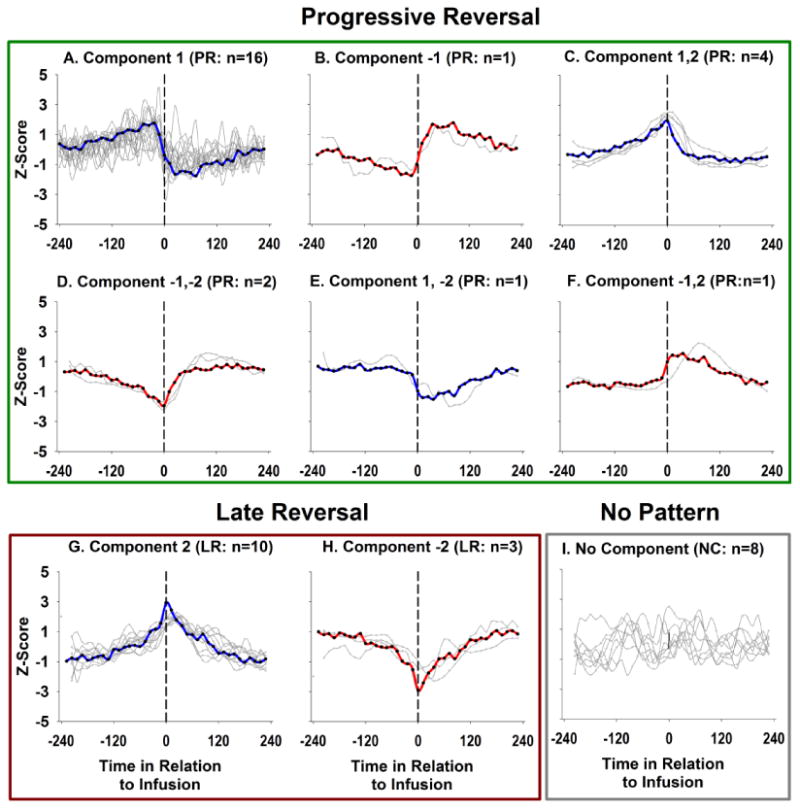
The taxonomy of firing patterns as determined by the principle components analysis. The representative pattern for each taxon is shown in blue for post-infusion decreases and red for post-infusion increases. Gray traces represent individual neurons assigned to each taxon. Time in relation to the infusion offset (seconds) is shown on the x-axis (infusion offset at time zero) and the Z-score for each factor score (taxa) and firing pattern (neuron) is shown on the y-axis. Principal components analysis categorized neurons as increase/ or decrease/progressive reversals patterns (PR; A-F), or increase/ or decrease/late reversal patterns (LR; G-H). Available evidence indicates that progressive reversal patterns are related to pharmacological changes across the inter-infusion interval. Hybrid component loadings (C-F) represent variations in the progressive reversal pattern, perhaps owing to differences in the timing of pharmacological effects or differences in the integration of upstream neuronal signals.
Table 2. Direction of Infusion Change.
| n | Percentage | |
|---|---|---|
| Decrease/Progressive Reversal | 22 | 47.8% |
| Increase/Progressive Reversal | 3 | 06.5% |
| Decrease/Late Reversal | 3 | 06.5% |
| Increase/Late Reversal | 10 | 21.7% |
| No Slow Phasic Pattern | 8 | 17.4% |
|
| ||
| Total | 46 | 100% |
3.3 Correlation of Firing Rate and Calculated Drug Level
To determine the strength of the relationship between drug levels and firing rates of LPH neurons, the correlation between these variables was examined. Over half of LPH neurons (58.7%, n=27) exhibited a significant correlation between fluctuating drug level and firing rate (Figure 6). Nearly all of these neurons exhibited strong negative correlations (92.59% 25/27), averaging a coefficient of -0.63 ± 0.03. The remaining 2 neurons, which exhibited significant positive correlations between drug level and firing rate, showed similar correlation coefficients, averaging 0.58 ± 0.16.
Figure 6.
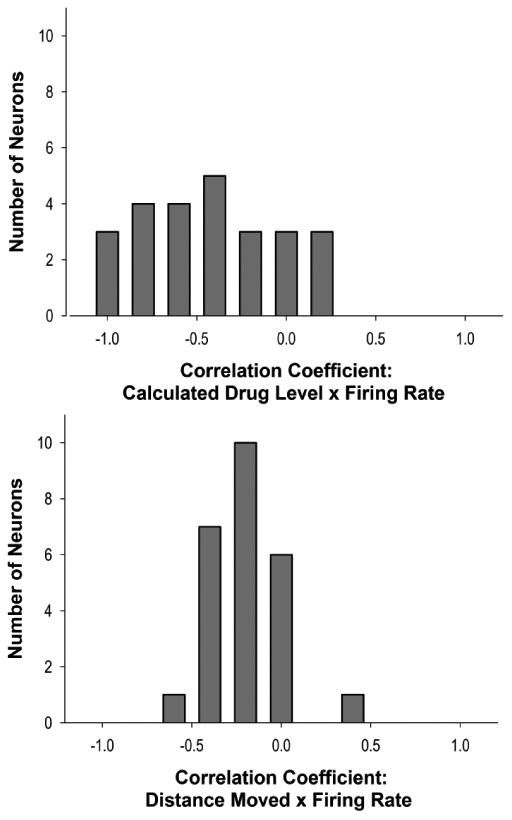
The distribution of observed correlations between calculated drug level and firing rate (top) and locomotion and firing rate (bottom). More neurons exhibited significant negative correlations between drug level and firing rate than between locomotor behaviors and firing rate. The magnitude of correlations with drug level, on the average, was also greater.
3.4 Correlation of Firing Rate and Locomotion
An alternate interpretation of changes in firing rate across the inter-infusion interval is that LPH neuron activity is modulated by changes in locomotion that correspond to fluctuations in drug level during the maintenance phase of self-administration. To investigate whether LPH neurons are modulated by locomotion, we examined the correlation between firing rate and measures of locomotor activity in a subset of recorded neurons (n=28). Of the 28 analyzed neurons, only 5 (17.8%) exhibited a weak, but significant correlation between locomotor activity and firing rate (Figure 6). Four of these neurons exhibited a negative relationship between firing rate and the animal's locomotor activity (r = -0.36 ± 0.02). All four neurons were previously classified as showing progressive reversal patterns. Notably, for all of these neurons, the correlation between drug level and firing rate was stronger than the relationship between locomotion and firing rate (drug level × firing rate r = -0.80 ± 0.08). One neuron exhibited a positive correlation (r = 0.41) between firing rate and locomotion; it was previously classified as not showing a slow-phasic pattern. Thus, while a small subset of LPH neurons are sensitive to locomotor activity, their firing patterns are more strongly related to self-administered drug levels, suggesting that these relations to drug level were not secondary to variations in locomotor activity as a function of drug level.
4.0 Discussion
The NAcc is known to contribute to psychostimulant behavioral effects including drug-seeking behavior (Pettit et al., 1984, Roberts et al., 1977; Fabbricatore et al., 2009, 2010), but the individual contributions of regions receiving NAcc projections, such as LPH and VP, are less understood. Here, we show that LPH neurons are highly sensitive to self-administered drug levels. Neurons in the LPH exhibited changes in both tonic and slow-phasic firing patterns in response to fluctuating drug levels. At the onset of cocaine self-administration, approximately 40% of LPH neurons exhibited two-fold or greater tonic changes in firing rate compared to pre-SA rates. As drug levels stabilized to their peak values during the maintenance phase of SA, the number of LPH neurons exhibiting at least a two-fold change in firing rate doubled to nearly 70%. The increased prevalence of LPH neurons exhibiting strong changes in firing rate following the transition from the loading to maintenance phases of SA suggests that changes in firing rate corresponded to changes in bodily levels of cocaine.
A closer inspection of the relationship between firing rates and drug level in the minutes surrounding self-infusions showed that most neurons exhibited slow phasic firing patterns synchronous with the timing of the infusions. Similar to the NAcc and VP, slow phasic changes primarily consisted of decrease/progressive reversal patterns (Fabbricatore et al. 2010; Root et al. 2012). Available evidence indicates that progressive reversal patterns are related to pharmacological changes across the inter-infusion interval (Peoples & West, 1996; Peoples et al., 1998; Nicola & Deadwyler, 2000; Root et al., 2012). These changes relate to animals' cycles of self-infusion wherein drug levels rise after each infusion and then gradually decay until the point at which animals re-initiate responding for the subsequent infusion. Slow phasic patterns, which span the entire ∼8 minute inter-infusion cycle, indicate that the firing properties LPH neurons are highly sensitive to fluctuations in bodily cocaine concentration over this interval.
Given that NAcc stimulation decreases LPH firing rates (Mogenson et al. 1983) and NAcc neurons typically exhibit decrease/progressive reversal firing patterns (Fabbricatore et al., 2010; Peoples et al., 1998), one might expect LPH neurons to predominantly exhibit increase/progressive reversal firing patterns (i.e., disinhibitions via inhibition of GABAergic cells in the NAcc). Instead, the opposite pattern was observed. Nevertheless, VP neurons--which receive a similar GABAergic projection from the NAcc--also exhibit predominantly decrease/progressive reversal patterns, suggesting that such patterns are widespread within the basal forebrain during cocaine self-administration. The mechanism underlying the predominance of the decrease/progressive reversal firing pattern is not yet known. One potential explanation could involve changes in accumbal or other afferents to LPH, or intrinsic changes to LPH neurons in response to chronic exposure to drug. The lack of a simple inverse relationship suggests that GABAergic signaling from the NAcc is not the predominant factor in determining drug-induced changes in LPH or VP firing. The observed firing patterns may instead result from sensitivity of neurons in all three regions to cocaine's pharmacological effects (see below) or other signaling mechanisms (e.g., substance P; Zhang et al., 2004).
In contrast to the NAcc and VP (Fabbricatore et al. 2010; Root et al. 2012), early reversal slow phasic firing patterns were not observed in LPH. In addition, while late reversal slow phasic firing patterns were observed in about a quarter of LPH neurons, these were rarely observed in VP (Root et al. 2012). When observed in VP, late reversals were always post-infusion decreases in firing rate while in LPH, late reversals were predominantly post-infusion increases in firing rate (Root et al. 2012). Taken together, these results suggest that the accumbal afferents to VP may serve a different function than those to the LPH. Alternatively, the integration of afferents over the slow phasic time scale may differ between LPH and VP.
Correlations between firing rate and drug level during the maintenance phase of self-administration demonstrated that approximately 60% of LPH neurons exhibited a significant correlation between drug level and firing rate. This proportion is higher than the VP (22%; Root et al., 2012), suggesting that the LPH neurons may play a greater role in processing the pharmacological effects of abused psychostimulants than VP neurons. Furthermore, in contrast to the heterogeneity of VP neurons, nearly all of the LPH neurons exhibited negative correlations between drug level and firing rate. Also, while a small percentage of LPH neurons exhibited correlations between locomotor behavior and firing rate, correlations with drug level were always stronger. Therefore, we conclude that only a weak or indirect (i.e., by way of connections with other structures) relationship exists between the firing of LPH neurons and locomotion. On the other hand, recent work in our laboratory has shown that VP neurons exhibit firing changes during goal-directed locomotor behaviors (Root et al., 2013). Thus, differences may exist in the contributions of VP and LPH to exploratory, goal-directed or locomotor behaviors (e.g., Zahm et al., 2013).
Consistent with the notion that the lateral preoptic area and rostral portions of the lateral hypothalamus represent a functional anatomical continuum, analyses of the rostrocaudal, mediolateral, or dorsoventral coordinate of recorded wires revealed no relationship between recording site and the observed tonic changes, slow phasic patterns, or correlations between firing rate and drug level or locomotor behaviors. Thus, while heterogeneity existed in the types of slow-phasic and tonic firing patterns observed, the distribution of these patterns was rather homogeneous.
Putative Roles for the LPH in Motivated Behavior
While the specific contribution of LPH neurons to drug seeking behaviors requires further study, the present study demonstrates a clear role for LPH neurons in cocaine processing. Given that neurons in the LPH have been implicated in other mechanisms, such as the sleep-wake cycle (Szymusiak et al., 1998; Gervasoni et al., 2000), are modulated by state changes in the awake-behaving animal (present data), and that the LPH sends projections to a wide array of monoaminergic cell groups (Jhou et al., 2009; Kowski et al., 2008; Geisler et al., 2007 Gervasoni et al., 2000; Steininger et al., 2001), the LPH may play a more general role in modulating arousal, in lieu of controlling a specific type of behavioral output. Indeed, the firing of LPO neurons is predominantly increased during sleep (Kaitin, 1984: Szymusiak et al., 1998) and predominantly decreased under the influence of stimulants (present data). It has also been shown that GABAergic antagonism of the LPH produces behavioral arousal ( Zahm et al., 2013), perhaps via downstream effects on the mesencephalic locomotor region (Mogenson et al., 1985; Swanson et al., 1984; Brudzynski & Mogenson, 1985).
The LPH might also play a role in affective processing. One especially important property of the medial NAcc neurons that project to the LPH is their role in processing hedonic information (Peciña, Smith, & Berrdige, 2006). That, in combination with the LPH's projections to the RMTg, LHb, and VTA (Jhou et al., 2009; Kowski et al., 2008; Geisler et al., 2007), positions the LPH to modulate processing of both appetitive and aversive stimuli. Certainly, dopaminergic projections from the VTA have long been implicated in the rewarding effects of cocaine (Wise & Bozarth, 1987). Moreover, LPH projections to the RMTg and LHb may be of particular importance considering recent evidence that these projections are involved in the dissipation of cocaine's rewarding effects and subsequent transition to aversive effects (Jhou et al., 2013), and evidence that cocaine's aversive effects are dependent on bodily levels of cocaine (Barker et al., 2013), to which LPH neurons are highly sensitive (present data).
Conclusions
The LPH represents an area that is underrepresented in the drug abuse literature. Given the known importance of the NAcc (Fabbricatore et al., 2009, 2010; Peoples et al., 1998; Nicola and Deadwyler, 2000) and emerging role of the ventral pallidum (Root et al., 2010, 2012, 2013; Stefanik et al., 2013) in motivated behaviors and drug abuse, studies of the LPH are clearly warranted. Indeed, the present data demonstrate a number of differences between the LPH and VP. Zahm and colleagues (2013) have demonstrated that certain previous experiments targeting the VP may have inadvertently affected neurons in the LPH. Thus, it would seem that future studies should focus on clearly differentiating the contributions of the LPH and VP to motivated behaviors, and on understanding the diverse connections between the LPH and midbrain catecholaminergic cell groups.
Acknowledgments
The authors thank Dr. D.S. Zahm for his advice during the preparation of the manuscript. We also thank Jackie Thomas, Joshua Stamos, and Sisi Ma for technical assistance. This study was supported by the National Institute on Drug Abuse grants DA06886 (MOW) DA 029873 (MOW) and DA032270 (DJB). The authors have no financial interests to disclose. The funders had no role in study design, data collection, data analysis, decision to publish, or manuscript preparation. DJB, BMS, KCC, DHR, JK, and ATF collected and organized the data for analysis. DJB, BMS, APP, and OK conducted analyses of the data. DJB, BMS and MOW were responsible for writing the manuscript. MOW was responsible for critical commentary and project oversight.
This study was supported by the National Institute on Drug Abuse Grants DA006886 (MOW), and DA032270 (DJB). The authors have no financial interests to be disclosed. The funders had no role in study design, data collection and analysis, decision to publish, or preparation of the manuscript. All coauthors have seen and approve of the contents of the manuscript. This article is not currently under review by another journal.
References
- Barker DJ, Simmons SJ, Servilio LC, Bercovicz D, Ma S, Root DH, Pawlak AP, West MO. Ultrasonic Vocalizations: evidence for an affective opponent process during cocaine self-administration. Psychopharmacology. 2013 doi: 10.1007/s00213-013-3309-0. In press. [DOI] [PMC free article] [PubMed] [Google Scholar]
- Brudzynski MS, Mogenson GJ. Association of the mesencephalic locomotor region with locomotor activity induced by injections of amphetamine into the nucleus accumbens. Brain Res. 1985;334(1):77–84. doi: 10.1016/0006-8993(85)90569-4. [DOI] [PubMed] [Google Scholar]
- Burgdorf J, Knutson B, Panksepp J, Ikemoto S. Nucleus accumbens amphetamine microinjections unconditionally elicit 50-kHz ultrasonic vocalizations in rats. Behavioral neuroscience. 2001;115(4):940. doi: 10.1037//0735-7044.115.4.940. [DOI] [PubMed] [Google Scholar]
- Comrey AL. A first course on factor analysis. New York, NY: Academic Press; 1973. [Google Scholar]
- Delfs JM, Schreiber L, Kelley AE. Microinjection of cocaine into the nucleus accumbens elicits locomotor activation in the rat. The Journal of neuroscience. 1990;10(1):303–310. doi: 10.1523/JNEUROSCI.10-01-00303.1990. [DOI] [PMC free article] [PubMed] [Google Scholar]
- Fabbricatore AT, Ghitza UE, Prokopenko VF, West MO. Electrophysiological evidence of mediolateral functional dichotomy in the rat accumbens during cocaine self-administration: tonic firing patterns. Eur J Neurosci. 2009;30(12):2387–400. doi: 10.1111/j.1460-9568.2009.07033.x. [DOI] [PMC free article] [PubMed] [Google Scholar]
- Fabbricatore AT, Ghitza UE, Prokopenko VF, West MO. Electrophysiological evidence of mediolateral functional dichotomy in the rat nucleus accumbens during cocaine self-administration II: Phasic firing patterns. Eur J Neurosci. 2010;31(9):1671–82. doi: 10.1111/j.1460-9568.2010.07230.x. [DOI] [PMC free article] [PubMed] [Google Scholar]
- Gervasoni D, Peyron C, Rampon C, Barbagli B, Chouvet G, Urbain N, Luppi PH, et al. Role and origin of the GABAergic innervation of dorsal raphe serotonergic neurons. The Journal of Neuroscience. 2000;20(11):4217–4225. doi: 10.1523/JNEUROSCI.20-11-04217.2000. [DOI] [PMC free article] [PubMed] [Google Scholar]
- Geisler S, Derst C, Veh RW, Zahm DS. Glutamatergic afferents of the ventral tegmental area in the rat. J Neurosci. 2007;27(21):5730–5743. doi: 10.1523/JNEUROSCI.0012-07.2007. [DOI] [PMC free article] [PubMed] [Google Scholar]
- Jhou TJ, Geisler S, Marinelli M, Degarmo BA, Zahm DS. The mesopontine rostromedial tegmental nucleus: a structure targeted by the lateral habenula that projects to the ventral tegmental area of tsai and substantia nigra compacta. J Comp Neurol. 2009;513:566–96. doi: 10.1002/cne.21891. [DOI] [PMC free article] [PubMed] [Google Scholar]
- Jhou TC, Good CH, Rowley CS, Xu S, Wang H, Burnham NW, Hoffman AF, Lupica CR, Ikemoto S. Cocaine drives aversive conditioning via delayed activation of dopamine-responsive habenular and midbrain pathways. J Neurosci. 2013;33(17):7501–12. doi: 10.1523/JNEUROSCI.3634-12.2013. [DOI] [PMC free article] [PubMed] [Google Scholar]
- Kaitin KI. Preoptic area unit activity during sleep and wakefulness in the cat. Experimental neurology. 1984;83(2):347–357. doi: 10.1016/S0014-4886(84)90103-1. [DOI] [PubMed] [Google Scholar]
- Kowski AB, Geisler S, Krauss M, Veh RW. Differential projections from the subfields in the lateral preoptic area to the lateral habenular complex of the rat. J Comp Neurol. 2008;507:1465–1478. doi: 10.1002/cne.21610. [DOI] [PubMed] [Google Scholar]
- Lyon M, Robbins TW. The action of central nervous system stimulant drugs: a general theory concerning amphetamine effects. Current developments in psychopharmacology. 1975;2:79–163. [Google Scholar]
- Mogenson GJ, Jones DL, Yim CY. From motivation to action: functional interface between the limbic system and the motor system. Progress in neurobiology. 1980;14(2):69–97. doi: 10.1016/0301-0082(80)90018-0. [DOI] [PubMed] [Google Scholar]
- Mogenson GJ, Swanson LW, Wu M. Evidence that projections from substantia innominata to zona incerta and mesencephalic locomotor region contribution to locomotor activity. Brain Res. 1985;334(1):65–76. doi: 10.1016/0006-8993(85)90568-2. [DOI] [PubMed] [Google Scholar]
- Mogenson GJ, Nielen MA. Evidence that an accumbens to subpallidal GABAergic projection contributes to locomotor activity. Brain Research Bulletin. 1983;11:309–314. doi: 10.1016/0361-9230(83)90166-1. [DOI] [PubMed] [Google Scholar]
- Nicola SM, Deadwyler SA. Firing rate of nucleus accumbens neurons is dopamine-dependent and reflects the timing of cocaine-seeking behavior in rats on a progressive ratio schedule of reinforcement. The Journal of Neuroscience. 2000;20(14):5526–5537. doi: 10.1523/JNEUROSCI.20-14-05526.2000. [DOI] [PMC free article] [PubMed] [Google Scholar]
- Norman AB, Tsibulsky VL. The compulsion zone: a pharmacological theory of acquired cocaine self-administration. Brain research. 2006;1116(1):143–152. doi: 10.1016/j.brainres.2006.07.092. [DOI] [PMC free article] [PubMed] [Google Scholar]
- Paxinos G, Watson C. The rat brain in stereotaxic coordinates. Academic Press; New York: 1997. [DOI] [PubMed] [Google Scholar]
- Peciña S, Smith KS, Berridge KC. Hedonic hot spots in the brain. The Neuroscientist. 2006;12(6):500–511. doi: 10.1177/1073858406293154. [DOI] [PubMed] [Google Scholar]
- Peoples LL, West MO. Phasic firing of single neurons in the rat nucleus accumbens correlated with the timing of intravenous cocaine self-administration. The Journal of neuroscience. 1996;16(10):3459–3473. doi: 10.1523/JNEUROSCI.16-10-03459.1996. [DOI] [PMC free article] [PubMed] [Google Scholar]
- Peoples LL, Gee F, Bibi R, West MO. Phasic firing time locked to cocaine self-infusion and locomotion: dissociable firing patterns of single nucleus accumbens neurons in the rat. J Neurosci. 1998;18(18):7588–7598. doi: 10.1523/JNEUROSCI.18-18-07588.1998. [DOI] [PMC free article] [PubMed] [Google Scholar]
- Pettit HO, Ettenberg A, Bloom FE, Koob GF. Destruction of dopamine in the nucleus accumbens selectively attenuates cocaine but not heroin self-administration in rats. Psychopharmacology. 1984;84:167–173. doi: 10.1007/BF00427441. [DOI] [PubMed] [Google Scholar]
- Roberts DCS, Corcoran ME, Fibiger HC. On the role of ascending catecholaminergic systems in intravenous self administration of cocaine. Pharmacol Biochem Behav. 1977;6:615–620. doi: 10.1016/0091-3057(77)90084-3. [DOI] [PubMed] [Google Scholar]
- Root DH, Barker DH, Ma S, Coffey KR, Fabbricatore AT, West MO. Evidence for learned skill during cocaine self-administration in rats. Psychopharmacology (Berl) 2011;217(1):91–100. doi: 10.1007/s00213-011-2261-0. [DOI] [PMC free article] [PubMed] [Google Scholar]
- Root DH, Fabbricatore AT, Ma S, Barker DJ, West MO. Rapid phasic activity of ventral pallidal neurons during cocaine self-administration. Synapse. 2010;64(9):704–713. doi: 10.1002/syn.20792. [DOI] [PMC free article] [PubMed] [Google Scholar]
- Root DH, Fabbricatore AT, Pawlak AP, Barker DJ, Ma S, West MO. Slow phasic and tonic activity of ventral pallidal neurons during cocaine self-administration. Synapse. 2012;66:106–127. doi: 10.1002/syn.20990. [DOI] [PMC free article] [PubMed] [Google Scholar]
- Root DH, Ma S, Barker DJ, Megehee L, Striano BM, Ralston CM, West MO. Differential roles of ventral pallidum subregions during cocaine self-administration behaviors. Journal of Comparative Neurology. 2013;521(3):558–588. doi: 10.1002/cne.23191. [DOI] [PMC free article] [PubMed] [Google Scholar]
- Shreve PE, Uretsky Effect of GABAergic transmission in the subpallidal region on the hypermotility response to the administration of excitatory amino acids and picrotoxin into the nucleus accumbens. Neuropharmacology. 1988;27(12):1271–77. doi: 10.1016/0028-3908(88)90030-5. [DOI] [PubMed] [Google Scholar]
- Shreve PE, Uretsky NJ. GABA and glutamate interact in the substantia innominata/lateral preoptic area to modulate locomotor activity. Pharmacology Biochemistry and Behavior. 1991;38:385–388. doi: 10.1016/0091-3057(91)90296-e. [DOI] [PubMed] [Google Scholar]
- Stefanik MT, Kupchik YM, Brown RM, Kalivas PW. Optogenetic evidence that pallidal projections, not nigral projections, from the nucleus accumbens core are necessary for reinstating cocaine seeking. J Neurosci. 2013;33(34):13654–13662. doi: 10.1523/JNEUROSCI.1570-13.2013. [DOI] [PMC free article] [PubMed] [Google Scholar]
- Steininger TL, Gong H, Mcginty D, Szymusiak R. Subregional organization of preoptic area/anterior hypothalamic projections to arousal-related monoaminergic cell groups. Journal of Comparative Neurology. 2001;429(4):638–653. [PubMed] [Google Scholar]
- Swanson LW, Mogenson GJ, Gerfen CR, Robinson P. Evidence for a projection from the lateral preoptic area and substantia innominata to the mesencephalic locomotor region in the rat. Brain Res. 1984;295(1):161–78. doi: 10.1016/0006-8993(84)90827-8. [DOI] [PubMed] [Google Scholar]
- Swerdlow NR, Vaccarino FJ, Amalric M, Koob GF. The neural substrates for the motor-activating properties of psychostimulants: a review of recent findings. Pharmacology, Biochemistry and Behavior. 1986;25:233–248. doi: 10.1016/0091-3057(86)90261-3. [DOI] [PubMed] [Google Scholar]
- Szymusiak R, Alam N, Steininger TL, McGinty D. Sleep–waking discharge patterns of ventrolateral preoptic/anterior hypothalamic neurons in rats. Brain research. 1998;803(1):178–188. doi: 10.1016/s0006-8993(98)00631-3. [DOI] [PubMed] [Google Scholar]
- Tabachnick BG, Fidell LS. Using multivariate statistics. 2nd. New York, NY: HarperCollins Publishers; 1989. [Google Scholar]
- Usuda I, Tanaka K, Chiba T. Efferent projections of the nucleus accumbens in the rat with special reference to subdivision of the nucleus: biotinylated dextran amine study. Brain research. 1998;797(1):73–93. doi: 10.1016/s0006-8993(98)00359-x. [DOI] [PubMed] [Google Scholar]
- Wise RA, Bozarth MA. A psychomotor stimulant theory of addiction. Psychological review. 1987;94(4):469. [PubMed] [Google Scholar]
- Zahm DS, Schwartz SM, Lavezzi HN, Yetnikoff L, Parsley KP. Comparisons of the locomotor-activating effects of bicuculline infusions into the preoptic area and ventral pallidum. Brain Struct Funct. 2013 doi: 10.1007/s00429-013-0514-x. In Press. [DOI] [PMC free article] [PubMed] [Google Scholar]
- Zhang G, Wang L, Liu H, Zhang J. Substance P promotes sleep in the ventrolateral preoptic area of rats. Brain research. 2004;1028(2):225–232. doi: 10.1016/j.brainres.2004.09.017. [DOI] [PubMed] [Google Scholar]
- Zimmer BA, Dobrin CV, Roberts DC. Examination of behavioral strategies regulating cocaine intake in rats. Psychopharmacology. 2013;225(4):935–944. doi: 10.1007/s00213-012-2877-8. [DOI] [PMC free article] [PubMed] [Google Scholar]