

Abstract
Parkinson's disease (PD) is a progressive debilitating neurodegenerative disorder clinically manifest by motor, posture and gait abnormalities. Human neurophysiological studies recording local field potentials within the subthalamic nucleus and scalp-based electroencephalography have shown pathological beta synchrony throughout the basal ganglia-thalamic-cortical motor network in PD. Notably, suppression of this pathological beta synchrony by dopamine replacement therapy or deep-brain stimulation has been associated with improved motor function. However, due to the invasive nature of these studies, it remains unknown whether this “pathological beta” is actually stronger than that observed in healthy demographically matched controls. We used magnetoencephalography to investigate neuronal synchrony and oscillatory amplitude in the beta range and lower frequencies during the resting state in patients with PD and a matched group of patients without neurological disease. Patients with PD were studied both in the practically defined drug “OFF” state, and after administration of dopamine replacements. We found that beta oscillatory amplitude was reduced bilaterally in the primary motor regions of unmedicated patients with PD compared with controls. Administration of dopaminergic medications significantly increased beta oscillatory activity, thus having a normalizing effect. Interestingly, we also found significantly stronger beta synchrony (i.e., hypersynchrony) between the primary motor regions in unmedicated patients with PD compared with controls, and that medication reduced this coupling which is in agreement with the intraoperative studies. These results are consistent with the known functionality of the basal ganglia-thalamic-cortical motor circuit and the likely consequences of beta hypersynchrony in the subthalamic nucleus of patients with PD.
Keywords: cortex, oscillations, magnetoencephalography, MEG, resting state
parkinson's disease (pd) is the second most common neurodegenerative disorder after Alzheimer's disease, affecting an estimated 1–2% of adults in the United States (National Institute of Neurological Disorders and Stroke 2011). Disease pathobiology is characterized by the progressive loss of dopaminergic neurons in the substantia nigra pars compacta (SNpc), resulting in muscle rigidity, resting tremor, hypo- or bradykinesia, instability, and muscle weakness (Jankovic 2008). Currently, there is no disease-ameliorating therapies, and symptomatic improvements rely primarily on the replenishment of lost dopamine (Stacy 2009) or by deep-brain stimulation (DBS). Moreover, there are no biomarkers available that can definitively diagnose PD, and there are a number of different disorders with Parkinson's-like symptoms. Thus a greater understanding of the basic pathophysiology of disease is needed to help facilitate improved diagnostics and treatment strategies.
In the human brain, 8 to 12 intrinsic functional networks have been identified in resting-state functional MRI and magnetoencephalography (MEG) recordings (Brookes et al. 2011c; Calhoun et al. 2008; Hillebrand et al. 2012). One of these is the sensorimotor network, which includes the bilateral primary motor and somatosensory regions and the supplementary motor area, or SMA (Brookes et al. 2011c; Calhoun et al. 2008; Hillebrand et al. 2012). Notably, recent resting-state MEG analyses have determined that local neuronal ensembles of the sensorimotor network primarily oscillate at the beta (14–30 Hz) frequency (Brookes et al. 2011b; Hillebrand et al. 2012), and that brain regions within this network exhibit high interregional phase-locking (i.e., coupling) in the beta band. This is in agreement with a study that used independent components analysis to identify the dominant oscillatory frequencies of each of the 8–12 major intrinsic brain networks and found that neuronal activity in the sensorimotor regions and the SMA was strongest in the beta rhythm and that the regions were significantly coupled at rest (Brookes et al. 2011b). It is well known that the SMA and motor regions are structurally connected through direct lateral connections (Ashe et al. 2006; DeLong and Wichmann 2007; Nachev et al. 2008; Tanji 1994) and through the basal ganglia-thalamo-cortical loop (McFarland and Haber 2000). Other components of this loop include the subthalamic nucleus (STN), which receives input from the primary motor regions, SMA, and premotor cortical areas and provides excitatory output to the globus pallidus internus (GPi), substantia nigra pars reticulata (SNpr), and globus pallidus externus (GPe). Meanwhile, the GPi and SNpr receive inhibitory projections from the GPe and putamen and ultimately provide inhibitory feedback to thalamic nuclei, which in turn modulate all components of the cortical motor network (Fig. 1) (DeLong and Wichmann 2007). This circuit is responsible for coordinating motor output via the spinal cord and mediates motor control. Importantly, it also contains the specific locus of degeneration in PD (i.e., the SNpc) (DeLong and Wichmann 2007). Thus understanding how PD affects this motor circuit, as well as how it is modulated by treatment, is a critical step for improving symptom management and developing physiological markers of PD.
Fig. 1.
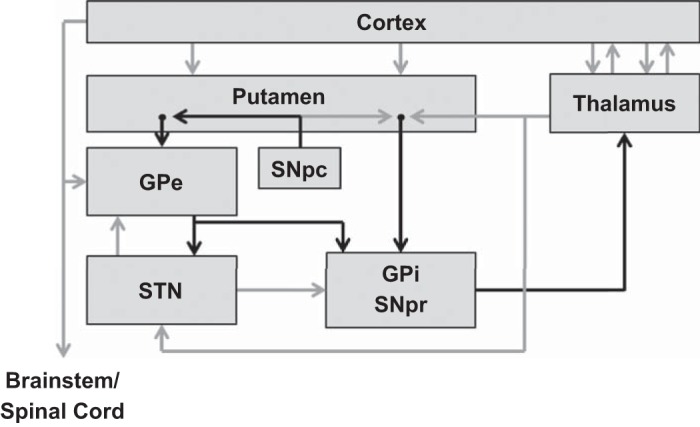
Motor circuit components of importance to Parkinson's disease (PD). Black arrows indicate inhibitory [gamma-aminobutyric acid (GABA)-ergic] connections; gray arrows indicate excitatory (glutamatergic) connections. Cortex includes the cortical motor areas: primary motor, supplementary motor area (SMA), premotor areas, and cingulate motor areas. GPe, external segment of the globus pallidus; GPi, internal segment of the globus pallidus; SNpc, substantia nigra pars compacta; SNr, substantia nigra pars reticulata; STN, subthalamic nucleus. [Figure adapted from Delong and Wichmann (2007) with permission.]
Interestingly, hypersynchrony of neuronal responses in the same 14- to 30-Hz beta range has been found during intraoperative evaluation of the effects of DBS on the STN in PD (Brown 2007; 2003; Cassidy et al. 2002; Hammond et al. 2007; Hirschmann et al. 2011, 2013; Jenkinson and Brown 2011; Kuhn et al. 2008; Weinberger et al. 2006). The most common finding is pathological hypersynchronization (i.e., coherence) of neurons within the STN and between cortical motoneurons and those in the STN of patients, both of which are partially arrested by DBS and/or dopamine replacement therapy. Such observations have been critical to understanding the therapeutic mechanisms of DBS and the underlying pathophysiology. In addition, these observations have been coalesced into the so-called oscillation model of PD, which postulates that beta oscillations become hypersynchronous in the STN of patients with PD, and that this impairs motor function by modulating other structures in the motor network toward a state of excessive synchrony (Hutchison et al. 2004). However, it is important to recognize that all of the involved patients had severe PD, and that none of these studies included any type of control group, which greatly complicates interpretation of these findings in the context of healthy brain physiology. Essentially, the degree of beta synchrony was interpreted as abnormal in these studies because dopaminergic medications and/or DBS decreased beta coupling between the STN and motor cortex (and within the STN itself) while improving motor function (Brown 2003, 2007; Cassidy et al. 2002; Hammond et al. 2007; Hirschmann et al. 2011, 2013; Jenkinson and Brown 2011; Kuhn et al. 2008; Weinberger et al. 2006), but, in the absence of data from healthy controls, one can only speculate about the whether the degree of beta synchrony was in fact abnormal in the patients with PD prior to administration of dopamine medication and/or DBS. In other words, it has been inherently assumed that the effect of these treatments is to “normalize” neuronal responses (i.e., becoming more like a healthy brain), which is not necessarily the case as these treatments could modulate different neural parameters that have some form of compensatory net effect on the motor system.
To date, only a few studies have examined spontaneous beta activity (i.e., oscillatory amplitude and/or synchrony) in patients with mild to moderate PD and included a control group (Bosboom et al. 2006; Stoffers et al. 2007). Stoffers et al. (2007) recorded resting-state MEG oscillatory activity in patients with PD, both on and off dopaminergic medication, compared with healthy controls and found that patients with PD had significantly reduced lower beta activity and significantly higher theta and alpha activity in almost every MEG sensor. However, overall these MEG studies have limited their analyses to the sensor level (Bosboom et al. 2006; Pollok et al. 2012; Stoffers et al. 2007), which, regrettably, provides spatially nonspecific results often complicating interpretation. Nonetheless, based on these studies, there is no indication that patients with PD have beta “hypersynchrony” in motor regions relative to healthy controls, nor stronger amplitude beta oscillations, as some studies have reported the opposite (i.e., weaker cortical beta in patients; Stoffers et al. 2007). These data stand in contrast to what has been predicted based on the intraoperative studies and highlight a significant disconnect for interpreting prior invasive and noninvasive neurophysiological studies of spontaneous neural activity in PD. On the other hand, paradoxically, there is substantial agreement between invasive and noninvasive studies of beta oscillatory activity during movement tasks in patients with PD (Brown 2007; Buhmann et al. 2003; Cassidy et al. 2002; Heinrichs-Graham et al., in press; Kuhn et al. 2008; Salenius et al. 2002; Weinberger et al. 2006).
Based on such gaps, we used spatially-filtered MEG to assess resting neurophysiological activity in the motor network of patients with mild to moderate PD, both off and on their dopaminergic medication, and in demographically matched controls. We hypothesized that patients with PD would exhibit abnormally reduced oscillatory activity throughout the motor network compared with healthy controls, and that these abnormalities would be restricted to the beta frequency. In addition, we predicted abnormally high levels of beta synchrony (i.e., hypercoupling) between regions of the motor network in unmedicated patients with PD. Finally, we hypothesized that the administration of dopaminergic medication would normalize beta oscillatory activity and synchrony, with the medicated patients exhibiting neuronal responses closer to those of healthy controls. We propose that, by understanding how neuronal dynamics differ between unmedicated patients with PD and healthy controls, therapeutic techniques can be better optimized toward normalizing these dynamics and not rely solely on measures of symptom improvement, which are often more categorical (i.e., nonquantitative) in nature.
METHODS
Subject selection.
Eighteen adults with PD (4 women) and 17 age-, sex-, and educationally matched adults (5 women) without PD were enrolled. Participants with PD were recruited from local neurology clinics and the regional chapter of the American Parkinson Disease Association, while participants without PD were recruited from the local community. All participants except one control were right-handed. All participants with PD had been prescribed their current dosage of regularly monitored dopamine replacement therapy for at least 2 mo prior to study enrollment (see Table 1) and had showed a satisfactory clinical response to the particular medication(s). Motor impairments were measured by a certified rater using the Unified Parkinson's Disease Rating Scale (UPDRS) in both the practically defined “off” state (i.e., following at least a 12-h withdrawal of dopamine replacements) and in the “on” state (i.e., after administration of typical medication regimen). Exclusionary criteria included any medical illness affecting central nervous system function, presence of any neurological or psychiatric disorder (besides PD), history of head trauma, and current substance abuse. After complete description of the study to participants, written, informed consent was obtained following the guidelines of the University of Nebraska Medical Center's Institutional Review Board, which had reviewed and approved the study protocol. Complete demographics and UPDRS scores are provided in Table 1.
Table 1.
Clinical and demographic characteristics
| Subject ID | Age, yr | Sex | Disease Duration, yr | Affected Side (R/l) | PD Medications (Type, Dose) | UPDRS III Off | UPDRS III On |
|---|---|---|---|---|---|---|---|
| p01* | 75 | M | 4 | Pram (0.5 mg), CD-LD (25/100 mg) | 17 | ||
| p02 | 57 | M | 2.5 | R | Pram (3 mg) | 37 | 23 |
| p03 | 62 | M | 4 | R | Pram (4.5 mg), Rasagiline (1 mg) | 22 | 21 |
| p04 | 70 | M | R | Pram (1.5 mg), CD/LD (25/100 mg) | 17 | ||
| p05 | 52 | M | 9 | R | CD/LD, Ropinirole | 62 | 42 |
| p06 | 70 | M | 5.5 | L | Rasagiline, Pram | 29 | 24 |
| p07 | 76 | M | 4 | L | Rasagiline (1 mg), CD/LD (50/200 mg) | 35 | 26 |
| p08 | 61 | M | L | Ropinirole (1 mg) | 15 | ||
| p09 | 60 | M | 1 | R | Ropinirole (1 mg) | 27 | 24 |
| p10 | 72 | F | 9 | L | Ropinirole | 13 | 13 |
| p11* | 54 | F | 6 | Pram (4.5 mg), CD/LD (25/100 mg) | 48 | 37 | |
| p12 | 64 | F | 8 | R | Pram (2 mg), Rasagiline (1 mg) | 27 | 16 |
| p13 | 67 | M | 1 | L | CD/LD (25/100 mg) | 23 | 20 |
| p14 | 66 | M | 3 | L | Rasagiline (1 mg), CD/LD (25/100 mg) | 53 | 53 |
| p15* | 69 | M | CD/LD (50/200 mg) | 52 | 43 | ||
| p16 | 52 | M | 6 | R | Ropinirole (8 mg) | 14 | 13 |
| p17 | 64 | M | 7 | L | CD/LD (25/100 mg), Aman | 28 | 19 |
| p18 | 64 | F | L | 19 | 14 | ||
| c01 | 68 | F | |||||
| c02 | 60 | F | |||||
| c03 | 69 | F | |||||
| c04 | 56 | M | |||||
| c05 | 69 | M | |||||
| c06 | 56 | M | |||||
| c07 | 70 | M | |||||
| c08 | 64 | M | |||||
| c09 | 83 | F | |||||
| c10 | 85 | M | |||||
| c11* | 53 | F | |||||
| c12 | 75 | M | |||||
| c13 | 71 | M | |||||
| c14 | 68 | M | |||||
| c15* | 53 | M | |||||
| c16 | 50 | M | |||||
| c17 | M |
M, male; F, female; R, right; L, left; PD, Parkinson's disease; UPDRS, Unified Parkinson's Disease Rating Scale; Pram, pramipexole; CD/LD, carbidopa/levodopa; Aman, amantadine.
Participants who were excluded from analysis due to major dental artifacts, large or repetitive head movements, or tremor-related (or exasperated) artifacts.
Three patients with PD and two controls were excluded from data analysis due to major dental artifacts, large or repetitive head movements, tremor-related (or exasperated) artifacts, MEG malfunctions, or related problems. Mean ages of the 15 patients with PD and 15 controls that were included in the analysis were 63.1 yr for patients (range: 52–76 yr) and 66.3 yr for controls (range: 50–85 yr) at enrollment. This difference was not significant. Mean patient UPDRS-III scores for the included patients were 29.92 in the “off” state and 23.69 in the “on” state, which was a significant improvement [t(13)=3.69; P = 0.003].
To ensure that any medication effects observed in this study were not a result of a possible time-of-day effect, four healthy, right-handed adult men (mean age: 31.4 yr, range 24–39 yr) were recorded using the same protocol described below. These participants were recorded in the early and late morning for 3 consecutive days.
Experimental paradigm.
All participants were scheduled early in the morning (e.g., 0730–800) and, for the participants with PD, after at least a 12-h withdrawal from dopamine replacement medication. Prior to starting the task, each participant entered the magnetically shielded room and was seated in the MEG chair. During the task, participants were instructed to relax, remain still, and fixate on a centrally presented cross hair for one continuous 6-min block of awake, eyes-open rest. Patients with PD were then moved to the patient waiting area and were administered their regular dosage of anti-Parkinsonian medication. About 75 min after administration, these patients returned to the MEG chamber and completed a second 6-min recording of eyes-open rest.
Dual-plane accelerometers were attached to the proximal portion of the participant's left and right index fingers and sampled with the MEG data, which allowed us to precisely monitor for movement and/or tremor artifacts throughout the recording. The resulting time series were differenced to account for any discrepancies in the positioning of the accelerometers between subjects and sessions, and subsequently the standard deviation (i.e., movement; any variation from zero) was calculated. These data were examined using independent-samples t-tests for patient/control comparisons and paired-samples t-tests for medication effects.
MEG data acquisition.
All recordings were conducted in a one-layer magnetically shielded room with active shielding engaged. Neuromagnetic responses were sampled continuously at 1 kHz, with an acquisition bandwidth of 0.1–330 Hz, using a 306-sensor Elekta Neuromag system with 204 planar gradiometers and 102 magnetometers (Elekta, Helsinki, Finland). Using MaxFilter (version 2.1.15; Elekta), MEG data from each session and subject were individually corrected for head motion, coregistered to structural MRI, and subjected to noise reduction using the signal space separation method with a temporal extension (Taulu and Simola 2006; Taulu et al. 2005).
MEG coregistration and structural MRI processing.
Prior to MEG measurement, four coils were attached to the subject's head, and the locations of these coils, together with the three fiducial points and scalp surface, were recorded with a three-dimensional digitizer (Fastrak 3SF0002, Polhemus Navigator Sciences, Colchester, VT). Once the subject was positioned for MEG recording, an electric current with a unique frequency label (e.g., 322 Hz) was fed to each of the coils. This induced a measurable magnetic field and allowed each coil to be localized in reference to the sensors throughout the recording session. Since coil locations were also known in head coordinates, all MEG measurements could be transformed into a common coordinate system. With this coordinate system (including the scalp surface points), each participant's MEG data was coregistered with structural T1-weighted MRI data prior to source space analyses. Structural MRI data were aligned parallel to the anterior and posterior commissures and transformed into the Talairach coordinate system (Talairach and Tournoux 1988) using BESA MRI (Version 2.0).
MEG source and connectivity analyses.
Following noise reduction and head-motion correction, the sensor-level time series was divided into epochs of 4096 ms duration (4096 points) and artifact rejection was performed using a fixed threshold method supplemented with visual inspection. Artifact-free epochs were transformed into a regional source model per participant via inverse spatial filtering using the Brain Electrical Source Analysis software (BESA version 6.0; see Fig. 2) (Becker et al. 2013; Franzen et al. 2013; Scherg et al. 2002; Wilson et al. 2013). Only data from the 204 gradiometer sensors were used for calculation of the source model. Essentially, a 29-point grid with dual orthogonal orientations per point was constructed, and spatial filtering was performed by creating a linear inverse operator of the lead field matrix L = (l1, l2 . . . ln), which contained the lead field vector of each source orientation in the model. Briefly, we can denote the MEG signals from the individual sensors by the matrix U (sensors × samples) and state that U is the linear overlap coming from the source regions (i.e., U = L × S + noise), with each source region having an unknown level of activity over time (si, row i in source time series matrix S). The unknown levels of brain activity S can then be reconstructed by inverting matrix L (i.e., S = L−1 × U − L−1 × noise), with L−1 being a spatial filter that reconstructs the magnitude of source activity in brain area i over time (si), while suppressing activity from all other brain areas. We used regularization (1%), based on the truncated singular value decomposition approach, to prevent the weights in the inverse spatial filter operator (L−1) from becoming too large and enhancing the MEG background noise. Such regularization does cause minor smearing of activity among the sources, but the overall effect is negligible (Becker et al. 2013; Franzen et al. 2013; Wilson et al. 2013). Each resulting source waveform represents activity in a cortical volume near 2 cm3 (Scherg et al. 2002).
Fig. 2.
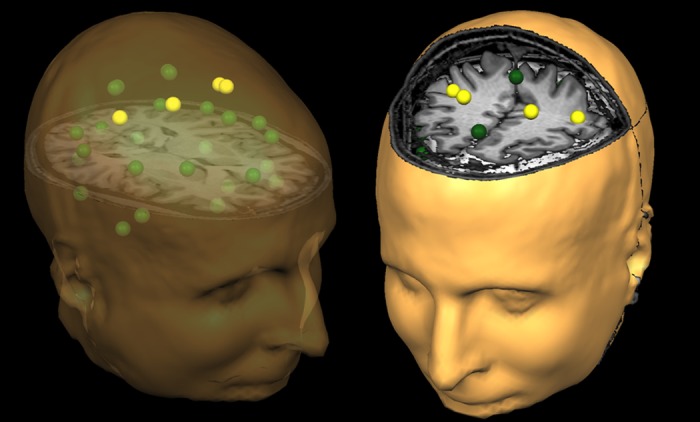
Representation of the regional source model. For each participant, a 29-node (grid-point) model with dual orthogonal orientations was used to estimate regional neuronal activity during the resting-state magnetoencephalography recording using inverse spatial filtering. The model can be seen above overlaid on a structural MRI, with the yellow sources representing the cortical motor regions, which were of primary interest in the present study. The same three-dimensional rendition is shown in both the left and right panels, although the orientation of the image differs between the two panels to facilitate visualization of the spatial location of each source. The nonyellow color is only meant to aid in visually distinguishing the regional sources. Note that the regional sources are spaced equidistant apart, and that each represents activity over an extended cortical area (i.e., >1 cm3). Thus the time series of each node reflects the average neuronal activity over that brain region and not the amount of activation at a precise neuroanatomical coordinate (e.g., a voxel in Montreal Neurological Institute space). Following spectral analyses, the current amplitude (in nAm) from the dominant orientation of each source was used for statistical analysis.
After transformation into source space, the current-amplitude (nAm) time series for each of the two orthogonal orientations per source were transformed into the frequency domain using Fourier analyses (i.e., 4,096 data points per window). Average spectra across the 6 min recording were then computed for each orientation per brain region by averaging the ∼90 Fourier-transformed epochs. Subsequently, for each of the 29 dual-orientation regional sources, the orientation with the strongest amplitude (broadband) was individually identified for each participant as the dominant orientation for that brain region, and the respective current-amplitude time series (per region) was used for the connectivity (i.e., phase coherence) analyses. Briefly, given our hypotheses, we extracted the zero-lag phase-locking value (PLV) using the method described by Lachaux et al. (1999) for the dominant orientation of only the sources corresponding to the left and right motor cortex and the left and right SMA. The signals were band-pass filtered at ±2.0 Hz, and their convolution was computed using a complex Gabor wavelet centered at the target frequency. We extracted the phase of the convolution for each time bin, frequency, trial and source pair and then averaged these values across the frequency bands of interest and across trials to derive the PLV, which was then collapsed across the entire epoch to estimate the average PLV per source pair per frequency. Thus the PLV reflects the intertrial variability of the phase difference between source pairs across the entire epoch. Values close to 1 indicate strong synchronicity with only minute differences in phase across the time series, whereas values close to 0 indicate substantial phase variation between the two signals across time and thus low synchronicity (connectivity) between the two regions.
Statistical analyses.
We first examined local spectral amplitude within the four traditional frequency bands of quantitative electroencephalography (i.e., delta: 1–4 Hz, theta: 4–7 Hz, alpha: 8–14 Hz, and beta: 14–30 Hz) among the four brain regions that comprise the resting-state cortical motor network (left/right primary motor cortex and left/right SMA) (Brookes et al. 2011b; Calhoun et al. 2008; Hillebrand et al. 2012) using a mixed-model ANOVA. Initially, we evaluated group differences using an omnibus mixed-model ANOVA with brain region and frequency-band as within-subjects fixed factors, and group (unmedicated PD, controls) as a between-subjects random factor. To investigate the effect of dopamine replacement therapy, we ran a separate repeated-measures ANOVA with brain region, frequency band, and medication status (on/off medication) as within-subject factors. Follow-up t-tests were performed to determine the locus of significant main effects and interactions, as appropriate. All statistical analyses were two-tailed and conducted in SPSS (release 21.0.0).
RESULTS
All participants were able to complete the task. As described in Subject selection in methods, three patients with PD and two controls were excluded from data analysis. To ensure there were no group differences in inadvertent movements during MEG, we examined the bilateral accelerometer signals. There were no significant differences (P values ranged from 0.3 to 0.7) in the standard deviations of the finger accelerations between the patients and controls, nor between unmedicated and medicated patients with PD, which confirms that movement during MEG was equivalent between groups and between medication states in patients.
Amplitude analysis.
To investigate the relationship between disease state and spectral amplitude, an omnibus 4 × 4 × 2 ANOVA with location (four regions) and frequency (four bands) as within-subjects fixed factors, and group as a between-subjects random factor was conducted. Results showed a significant main effect of region, F(3,84) = 4.340 (P = 0.007) and frequency band, F(3,84) = 398.536 (P < 0.001), as well as a significant region-by-frequency band interaction, F(9,252) = 3.857 (P < 0.001), frequency-by-group interaction, F(3,84) = 4.113 (P = 0.009), and a region-by-frequency-by-group three-way interaction, F(9,252) = 1.875 (P = 0.056). Post hoc t-tests were conducted to probe the frequency-by-group interaction, which showed that unmedicated patients with PD had significantly reduced beta amplitude across brain regions compared with controls, t(28) = 2.032 (P = 0.05). No other frequencies were significantly different between groups. Post hoc independent sample t-tests were also conducted to probe group differences in each frequency band and region. These tests showed that unmedicated patients with PD had reduced beta oscillatory activity in both the left primary motor cortex, t(28) = 2.213 (P = 0.035) and right primary motor cortex, t(28) = 2.963 (P = 0.006; see Fig. 3). No other differences in the amplitude of neuronal activity were significant. Note that we did not evaluate the main effect of brain region because of the potential for partial volume effects (i.e., differences in the sensitivity of the imaging device to neural activity in different brain regions) that are always a concern in neuroimaging and bioimaging in general.
Fig. 3.
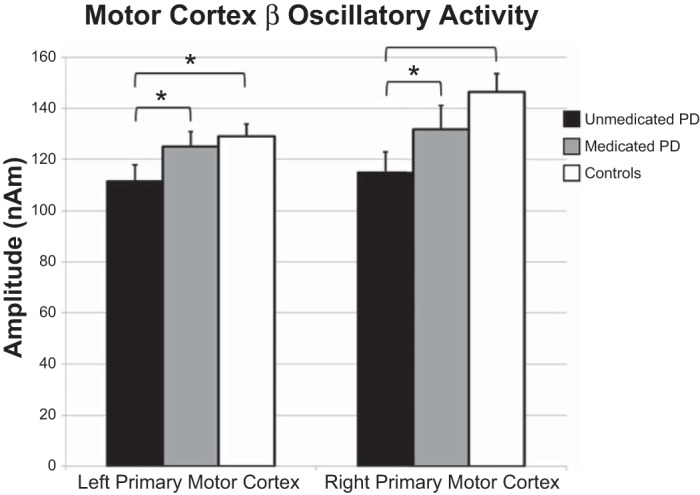
Beta oscillatory amplitude differences in the primary motor regions. Amplitude (in nAm) is shown on the y-axis, while region is denoted along the x-axis. Significant differences between unmedicated patients with PD (black bars) and healthy controls (white bars) were restricted to the beta band in the left (P = 0.035) and right (P = 0.006) primary motor regions. Gray bars, data from medicated patients. Administration of anti-Parkinsonian medication increased the amplitude of beta activity in the left (P = 0.024) and right (P = 0.011) primary motor regions. A similar pattern of changes following medication was detected in the left and right SMA (not shown, see Table 2). Error bars indicate 1 SE. *P < 0.05.
To evaluate the effect of dopamine replacement therapy on resting-state oscillations, a repeated-measures 4 × 4 × 2 ANOVA with location (four regions), frequency (four bands), and medication status (off/on medication) was conducted. We observed a significant effect of frequency, F(3,42) = 162.867 (P < 0.001) and medication status, F(1,14) = 6.378 (P = 0.024), as well as a significant frequency-by-medication status interaction, F(3,42) = 7.661 (P < 0.001). Follow-up paired-sample t-tests showed significant increases (P < 0.05) following dopamine administration across all four bands in the left SMA and the left primary motor cortex (see Table 2 and Fig. 3). In contrast, increased resting-state amplitude in the right SMA postmedication was restricted to the beta frequency t(14) = 2.925 (P = 0.011), and only a marginal increase in beta activity following medication was detected in the right primary motor cortex, t(14) = 1.941 (P = 0.073). No other results were significant, although there were trending differences in all other frequency bands in the right motor cortex (P < 0.10). Follow-up testing was conducted to evaluate whether dopamine normalized cortical beta oscillations, and these tests were affirmative; we found no significant differences between healthy controls and medicated patients [left primary motor cortex: t(28) = 0.531, P = 0.600; right primary motor cortex: t(28) = 1.240, P = 0.225].
Table 2.
Medication amplitude effects
| Region | Frequency | Premedication Amplitude, nAm | Postmedication Amplitude, nAm | t | P |
|---|---|---|---|---|---|
| Left primary motor cortex | Delta | 32.96 (2.24) | 37.37 (2.12) | 2.17 | 0.047 |
| Theta | 30.91 (3.06) | 35.62 (3.13) | 2.62 | 0.020 | |
| Alpha | 52.22 (4.54) | 58.83 (3.92) | 3.54 | 0.003 | |
| Beta | 111.63 (6.24) | 125.03 (5.73) | 2.54 | 0.024 | |
| Left SMA | Delta | 33.35 (2.67) | 38.05 (2.32) | 2.27 | 0.040 |
| Theta | 31.07 (3.36) | 35.63 (2.65) | 3.08 | 0.008 | |
| Alpha | 47.75 (3.79) | 56.27 (3.78) | 2.30 | 0.037 | |
| Beta | 116.02 (10.04) | 135.24 (9.73) | 2.54 | 0.024 | |
| Right primary motor cortex | Delta | 34.11 (3.22) | 38.17 (2.32) | 1.82 | 0.090 |
| Theta | 33.79 (5.33) | 36.81 (3.37) | 1.98 | 0.068 | |
| Alpha | 55.53 (5.42) | 61.60 (5.20) | 1.97 | 0.068 | |
| Beta | 114.83 (7.96) | 131.85 (9.34) | 2.93 | 0.011 | |
| Right SMA | Delta | 33.16 (2.93) | 36.91 (2.91) | 1.63 | 0.126 |
| Theta | 30.53 (3.11) | 33.83 (2.94) | 0.84 | 0.413 | |
| Alpha | 47.96 (4.68) | 53.73 (4.73) | 1.47 | 0.164 | |
| Beta | 110.59 (9.46) | 125.65 (37.91) | 1.94 | 0.073 |
Amplitude values are shown as means (SE).
SMA, supplementary motor area.
Significant increases in amplitude from pre- to postmedication are shown in bold.
To ensure that the medication effects were, in fact, due to the administration of dopaminergic medication and not a result of a possible time-of-day effect, we evaluated resting state amplitudes in the same cortical motor areas in four healthy adult men. These participants were recorded in the early and late morning for 3 consecutive days (unpublished observations). Amplitudes were extracted for each frequency band and source, using exactly the same methods as the present study, and then averaged across the 3 days for each source, frequency band, and time. An omnibus 4 × 4 × 2 ANOVA was conducted with location (four regions), frequency (four bands) and time-of-day (early/late morning) as within-subjects factors. Importantly, our results showed that there was no main effect of time (P = 0.776), no time-by-region interaction (P = 0.932), no time-by-frequency interaction (P = 0.702), and no three-way interaction (P = 0.748). Thus it is unlikely that our medication effect was confounded by the time-of-day difference between pre- and postmedication scans.
Phase synchrony analysis.
Given the beta oscillatory amplitude results, we focused connectivity analyses on the primary motor regions. Independent-samples t-tests of zero-lag PLVs showed that beta synchronicity between the left and right primary motor regions was significantly stronger in unmedicated patients with PD relative to healthy controls [t(28) = 2.385, P = 0.024]; synchronicity in the theta (P = 0.379) and alpha (P = 0.438) bands was not significant. Furthermore, there were no significant differences between groups in the synchronicity between primary motor cortexes and the SMA in any frequency band. Finally, administration of dopaminergic medication decreased beta synchronicity between the left and right primary motor cortexes in patients with PD, but this effect was not significant (P = 0.578; Fig. 4).
Fig. 4.
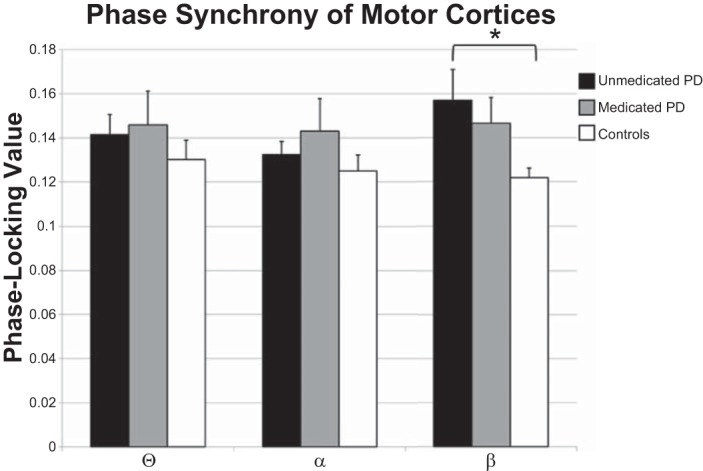
Phase synchrony between the left and right primary motor regions. Phase-locking values are shown on the y-axis, while frequency band is denoted on the x-axis. Data for healthy controls are shown by white bars, for unmedicated patients with PD by black bars, and the data for medicated patients with PD by gray bars. Unmedicated patients with PD showed significantly stronger beta synchrony between the left and right primary motor regions than did healthy controls. While beta synchrony was reduced following medication, this reduction was not significant. *P < 0.05.
DISCUSSION
We examined resting-state neurophysiological activity in the motor network of patients with PD before and after dopamine replacement therapy and compared these data to a group of matched controls without neurological disease. We found that unmedicated patients with PD exhibit significantly decreased beta oscillations compared with controls in the bilateral motor regions, and that this difference is largely normalized following dopamine replacement, meaning that, after medication administration, there was no longer a statistical difference between neural activity in controls and patients with PD. Furthermore, despite decreased beta oscillatory activity in the primary motor cortexes, patients with PD exhibit significantly higher synchronicity between the left and right motor cortex, which is also restricted to the beta frequency and partially normalized by dopamine replacement therapy. Below, we discuss the implications of these findings for understanding how PD affects the striatal-thalamo-cortical motor loop, as well as how dopaminergic medication might function to normalize the activity in the motor network of patients with PD.
We found that resting-state beta activity in the bilateral primary motor regions was significantly reduced in unmedicated patients with PD compared with controls, and that administering dopamine replacement therapy normalized beta oscillatory amplitude in these same cortical regions. In addition, dopamine replacement resulted in broad-band increases (i.e., delta, theta, alpha, and beta) in oscillatory amplitude across the cortical motor system, especially in the left hemisphere, although there were also trending effects (P values < 0.09) in the right primary motor cortex. At first glance, these results may seem surprising, since the most common findings from invasive (intraoperative) studies of patients with PD have been beta hypersynchronization within the STN and/or between the STN and motor regions (i.e., the oscillation model of Parkinson's) (Brown 2003, 2007; Cassidy et al. 2002; Hammond et al. 2007; Hirschmann et al. 2011, 2013; Jenkinson and Brown 2011; Kuhn et al. 2008; Weinberger et al. 2006). However, examination of the excitatory and inhibitory pathways throughout the striatal-thalamic-cortical motor circuit (Fig. 1) shows that the STN provides excitatory input to the GPi and the SNpr, which in turn provide strong inhibitory drive to thalamic neurons that project to the motor regions, including both primary motor and the SMA. Thus, given the network architecture, the expected outcome of hypersynchrony in the STN would be pathological inhibition of the thalamus, which would strongly reduce excitatory drive to the cortex and thereby may encourage local hypersynchronization of cortical neurons (DeLong and Wichmann 2007). Furthermore, previous research has demonstrated that dopamine replacement therapy reduces beta synchronization in the STN (Priori et al. 2004). Given the previously described relationship between the STN and the cortical motor areas, it is logical that dopaminergic modulation of the STN would ultimately reduce the inhibitory drive to the thalamus, which would “release” the thalamus to stimulate motor cortical neurons and thereby increase resting-state beta oscillations.
Similarly, degeneration of neurons in the SNpc, which is the hallmark feature of PD, would cause a similar inhibition of cortical beta activity, although this effect would be mediated through a different cortical pathway. Degeneration of the SNpc would decrease the inhibitory drive to the GPi and SNpr and, through these means, increase inhibition of thalamic neurons via the GPi and SNpr, resulting in reduced excitatory output of thalamic neurons projecting to the motor regions, and hence reduced beta amplitude in the cortex (Fig. 1). Wichmann and Delong (2003) tested this hypothesis using PET imaging in macaques infected with 1-methyl-4-phenyl-1,2,3,6-tetrahydropyridin (MPTP), which causes severe nigrostriatal degeneration. They found increased activity in the GPi and SNpr, as well as decreased activity in the thalamus. Thus hypersynchrony in the STN and/or reduced SNpc activity would ultimately reduce resting-state beta oscillatory amplitude in motor regions. Such a reduction and the subsequent increase in cortical beta oscillations following dopamine replacement therapy may serve as a reliable measure of motor circuit functionality and treatment efficacy in patients with PD.
Our results also showed frequency-dependent beta hypersynchrony between the bilateral primary motor regions, which was marginally reduced with dopaminergic medication. From strictly a MEG signal-processing perspective, there is a positive relationship between amplitude and phase synchrony (a.k.a., phase coherence) due to the increased signal-to-noise ratio that results from increased local oscillatory amplitude (Brookes et al. 2011a; Schoffelen and Gross 2009). Consequently, the significantly reduced beta amplitude observed in unmedicated patients would have biased the phase-synchrony computation toward lower values in this group. Despite this, unmedicated patients had significantly stronger beta synchrony relative to controls between the left and right primary motor regions, which is even more compelling, given that the synchrony values were clearly biased against this conclusion. These results compliment previous findings (Baudrexel et al. 2011; Brown and Williams 2005; Pollok et al. 2013; Salenius et al. 2002; Silberstein et al. 2005; Williams et al. 2002) that showed increased coherence throughout the striatal-thalamic-cortical motor network in patients with PD. Our results are also consistent with a recent study showing that the degree of cortico-cortical coupling between primary motor regions and the SMA was positively correlated with disease duration (Pollok et al. 2013). Many of these studies have posited that this increased coherence could act as a compensatory mechanism resulting from a breakdown in the motor circuit. However, Brown (2007) suggested that a loss of functional segregation within the parallel loops between the basal ganglia and cortex may be the primary source of pathological beta synchrony throughout the motor circuit. This loss of functional segregation leads to hypersynchrony within the cortex (as found in the present study), between the cortex and subcortical structures, and within the basal ganglia itself (2007). Alternatively, we hypothesize that the decreased excitatory drive from the thalamus might lead to increased functional connectivity between the cortical motor regions, as their bidirectional reciprocal inputs may create a closed loop in the absence of thalamic inputs. Although speculative, this would be consistent with our previous study, which showed that unmedicated patients with PD are unable to properly suppress beta activity in the primary motor cortex during movement planning (Heinrichs-Graham et al., in press). Future multiunit recording studies, perhaps using the MPTP model, could test these alternatives by recording cortical, basal ganglia, and thalamic neural populations (simultaneously) in the unmedicated and medicated state. A strong negative relationship between the amplitude of neural activity in the thalamus and the cortical synchrony would support our view, whereas widespread changes in coupling (pre- to postmedication) would support the loss of functional segregation theory. Finally, unlike other studies (Silberstein et al. 2005), we did not observe a significant change in cortico-cortical synchronicity following administration of dopaminergic medication, although coupling did decrease postdrug and became more like controls. It is important to note, however, that Silberstein and colleagues were studying patients who were undergoing DBS implantation and thus were much more severe.
In conclusion, this study is the first to demonstrate that beta oscillatory amplitude in the primary motor regions is significantly reduced in unmedicated patients with PD relative to healthy controls, and that this effect is normalized following dopamine replacement therapy; in other words, there was no longer a statistical difference in cortical activity between controls and patients with PD. In addition, this study showed beta hypercoupling between the left and right primary motor cortex in unmedicated PD relative to controls, which was reduced but not eliminated by dopaminergic medications. Before closing, there are a few limitations to the study that warrant discussion. Foremost, while our results compliment previous neurosurgical findings regarding amplitude and synchronicity in the STN and other subcortical structures of patients with PD, we were unable to compute an accurate time series for these subcortical structures using resting-state MEG, and as such a concrete relationship between cortical and subcortical oscillations and synchrony could not be derived. This limitation is due to subcortical structures, especially the STN, being extremely small, the fact that magnetic field strength falls off with the square of the distance from the current source, and the rather poor signal-to-noise ratio of resting-state recordings (relative to task-based MEG). That said, other noninvasive neuroimaging methods would also be unable to derive these measures; functional MRI lacks the temporal resolution to compute synchrony and the spatial precision to accurately estimate activity in the STN, and EEG imaging also lacks the spatial resolution to resolve these small structures. Thus, while limited, MEG remains one of the most capable noninvasive tools for probing cortical and subcortical neurophysiology. Second, when discussing connectivity in the context of electrophysiology, it is important to keep in mind that there are several different measures that can be used to quantify connectivity, each with its own strengths and weaknesses. Coherence, for example, is a functional connectivity measure that does not separate the differential effects of phase and amplitude on the computed values and can be biased by small amplitude changes (Lachaux et al. 1999). Measures of the PLV, which was used in the present analysis, are susceptible to linear mixing due to volume conduction, while other calculations, such as the phase-lag index are relatively immune to this problem (Schoffelen and Gross 2009; Stam et al. 2007). While the PLV is relatively more affected by volume conduction, it is unlikely that this significantly contributed to our results for at least several reasons. For one, volume conduction should have been relatively equal between the patients and controls; thus any effect on the PLV would not have produced the group differences that we observed. Second, our results showed a decreased amplitude response in our patients with PD along with an increase in the PLV, which is contrary to what would have been expected if our results were due to volume conduction or signal leakage. Basically, an increase in oscillatory amplitude, reflective of a larger or more synchronous population of active neurons, would actually result in more volume conduction and give an artificially high PLV, which is opposite to what was observed in this study. Nonetheless, it is important to recognize that volume conduction is an important consideration when computing connectivity in electrophysiology data. Another limitation is that we did not divide our patient population into symptom-specific subgroups. As such, there may be underlying physiological differences between, for example, tremor-dominant patients with PD and bradykinesia-dominant patients with PD.
Despite these limitations, this study is the first to show reductions in cortical beta amplitude within motor circuits of patients with PD compared with healthy controls and, as such, provides an avenue by which therapeutic methods can be evaluated. Essentially, rather than simply judging efficacy by the degree of reduction in symptomatology within individual patients, new therapies can be gauged by their capacity to normalize neuronal activity to that of healthy individuals. Moreover, such neurophysiological response patterns may also be diagnostically informative. For example, a recent electrocorticography study suggested that patterns of cortical oscillatory activity could distinguish between PD, primary dystonia, and essential tremor (Crowell et al. 2012). However, this study was unable to utilize a control group (i.e., electrocorticography is invasive), and overall such applications remain a relatively distant goal for noninvasive methods.
GRANTS
This work was supported by the Michael J. Fox Foundation (H. E. Gendelman), the Community Neuroscience Pride of Nebraska Research Initiative, the Carol Swarts, M.D., Emerging Neuroscience Research Laboratory, and the National Institute of Neurological Disorders and Stroke (Grants R01-NS-36126, P01-NS-31492, 2-R01-NS-034239, and P01-NS-43985 to H. E. Gendelman), the National Institute of Mental Health (Grants P01-MH-64570 and P30-MH-062261 to H. E. Gendelman), the National Institute of Drug Abuse (Grant P01-DA-028555 to H. E. Gendelman), and the National Institute on Aging (Grant R01-AG-043540 to H. E. Gendelman) of the National Institutes of Health. This work was also supported by an award from the Parkinson's Skate-A-Thon fund of the University of Nebraska Foundation (T. W. Wilson). E. Heinrichs-Graham was partially supported by the Hattie B. Munroe Foundation through a graduate research assistantship. The Center for Magnetoencephalography at the University of Nebraska Medical Center was founded through an endowment fund from an anonymous donor.
DISCLOSURES
No conflicts of interest, financial or otherwise, are declared by the author(s).
AUTHOR CONTRIBUTIONS
Author contributions: E.H.-G., H.E.G., and T.W.W. conception and design of research; E.H.-G., P.M.S., and T.W.W. performed experiments; E.H.-G., M.J.K., K.M.B., and T.W.W. analyzed data; E.H.-G., H.E.G., and T.W.W. interpreted results of experiments; E.H.-G. and T.W.W. prepared figures; E.H.-G., M.J.K., and T.W.W. drafted manuscript; E.H.-G., M.J.K., K.M.B., P.M.S., H.E.G., and T.W.W. edited and revised manuscript; E.H.-G., M.J.K., K.M.B., P.M.S., H.E.G., and T.W.W. approved final version of manuscript.
ACKNOWLEDGMENTS
We thank the Nebraska chapter of the American Parkinson Disease Association for helping with participant recruitment and thank our participants for volunteering.
REFERENCES
- Ashe J, Lungu OV, Basford AT, Lu X. Cortical control of motor sequences. Curr Opin Neurobiol 16: 213–221, 2006 [DOI] [PubMed] [Google Scholar]
- Baudrexel S, Witte T, Seifried C, von Wegner F, Beissner F, Klein JC, Steinmetz H, Deichmann R, Roeper J, Hilker R. Resting state fMRI reveals increased subthalamic nucleus-motor cortex connectivity in Parkinson's disease. Neuroimage 55: 1728–1738, 2011 [DOI] [PubMed] [Google Scholar]
- Becker KM, Heinrichs-Graham E, Fox HS, Robertson KR, Sandkovsky U, O'Neill J, Swindells S, Wilson TW. Decreased MEG beta oscillations in HIV-infected older adults during the resting state. J Neurovirol 19: 586–594, 2013 [DOI] [PMC free article] [PubMed] [Google Scholar]
- Bosboom JL, Stoffers D, Stam CJ, van Dijk BW, Verbunt J, Berendse HW, Wolters E. Resting state oscillatory brain dynamics in Parkinson's disease: an MEG study. Clin Neurophysiol 117: 2521–2531, 2006 [DOI] [PubMed] [Google Scholar]
- Brookes MJ, Hale JR, Zumer JM, Stevenson CM, Francis ST, Barnes GR, Owen JP, Morris PG, Nagarajan SS. Measuring functional connectivity using MEG: methodology and comparison with fcMRI. Neuroimage 56: 1082–1104, 2011a [DOI] [PMC free article] [PubMed] [Google Scholar]
- Brookes MJ, Wood JR, Stevenson CM, Zumer JM, White TP, Liddle PF, Morris PG. Changes in brain network activity during working memory tasks: a magnetoencephalography study. Neuroimage 55: 1804–1815, 2011b [DOI] [PMC free article] [PubMed] [Google Scholar]
- Brookes MJ, Woolrich M, Luckhoo H, Price D, Hale JR, Stephenson MC, Barnes GR, Smith SM, Morris PG. Investigating the electrophysiological basis of resting state networks using magnetoencephalography. Proc Natl Acad Sci U S A 108: 16783–16788, 2011c [DOI] [PMC free article] [PubMed] [Google Scholar]
- Brown P. Abnormal oscillatory synchronisation in the motor system leads to impaired movement. Curr Opin Neurobiol 17: 656–664, 2007 [DOI] [PubMed] [Google Scholar]
- Brown P. Oscillatory nature of human basal ganglia activity: relationship to the pathophysiology of Parkinson's disease. Mov Disord 18: 357–363, 2003 [DOI] [PubMed] [Google Scholar]
- Brown P, Williams D. Basal ganglia local field potential activity: character and functional significance in the human. Clin Neurophysiol 116: 2510–2519, 2005 [DOI] [PubMed] [Google Scholar]
- Buhmann C, Glauche V, Sturenburg HJ, Oechsner M, Weiller C, Buchel C. Pharmacologically modulated fMRI–cortical responsiveness to levodopa in drug-naive hemiparkinsonian patients. Brain 126: 451–461, 2003 [DOI] [PubMed] [Google Scholar]
- Calhoun VD, Kiehl KA, Pearlson GD. Modulation of temporally coherent brain networks estimated using ICA at rest and during cognitive tasks. Hum Brain Mapp 29: 828–838, 2008 [DOI] [PMC free article] [PubMed] [Google Scholar]
- Cassidy M, Mazzone P, Oliviero A, Insola A, Tonali P, Di Lazzaro V, Brown P. Movement-related changes in synchronization in the human basal ganglia. Brain 125: 1235–1246, 2002 [DOI] [PubMed] [Google Scholar]
- Crowell AL, Ryapolova-Webb ES, Ostrem JL, Galifianakis NB, Shimamoto S, Lim DA, Starr PA. Oscillations in sensorimotor cortex in movement disorders: an electrocorticography study. Brain 135: 615–630, 2012 [DOI] [PMC free article] [PubMed] [Google Scholar]
- DeLong MR, Wichmann T. Circuits and circuit disorders of the basal ganglia. Arch Neurol 64: 20–24, 2007 [DOI] [PubMed] [Google Scholar]
- Franzen JD, Heinrichs-Graham E, White ML, Wetzel MW, Knott NL, Wilson TW. Atypical coupling between posterior regions of the default mode network in attention-deficit/hyperactivity disorder: a pharmaco-magnetoencephalography study. J Psychiatry Neurosci 38: 333–340, 2013 [DOI] [PMC free article] [PubMed] [Google Scholar]
- Hammond C, Bergman H, Brown P. Pathological synchronization in Parkinson's disease: networks, models and treatments. Trends Neurosci 30: 357–364, 2007 [DOI] [PubMed] [Google Scholar]
- Heinrichs-Graham E, Wilson TW, Santamaria PM, Heithoff SK, Torres-Russotto D, Hutter-Saunders JA, Estes KA, Meza JL, Mosley RL, Gendelman HE. Neuromagnetic evidence of abnormal movement-related beta desynchronization in Parkinson's disease. Cereb Cortex. In press [DOI] [PMC free article] [PubMed] [Google Scholar]
- Hillebrand A, Barnes GR, Bosboom JL, Berendse HW, Stam CJ. Frequency-dependent functional connectivity within resting-state networks: an atlas-based MEG beamformer solution. Neuroimage 59: 3909–3921, 2012 [DOI] [PMC free article] [PubMed] [Google Scholar]
- Hirschmann J, Ozkurt TE, Butz M, Homburger M, Elben S, Hartmann CJ, Vesper J, Wojtecki L, Schnitzler A. Differential modulation of STN-cortical and cortico-muscular coherence by movement and levodopa in Parkinson's disease. Neuroimage 68: 203–213, 2013 [DOI] [PubMed] [Google Scholar]
- Hirschmann J, Ozkurt TE, Butz M, Homburger M, Elben S, Hartmann CJ, Vesper J, Wojtecki L, Schnitzler A. Distinct oscillatory STN-cortical loops revealed by simultaneous MEG and local field potential recordings in patients with Parkinson's disease. Neuroimage 55: 1159–1168, 2011 [DOI] [PubMed] [Google Scholar]
- Hutchison WD, Dostrovsky JO, Walters JR, Courtemanche R, Boraud T, Goldberg J, Brown P. Neuronal oscillations in the basal ganglia and movement disorders: evidence from whole animal and human recordings. J Neurosci 24: 9240–9243, 2004 [DOI] [PMC free article] [PubMed] [Google Scholar]
- Jankovic J. Parkinson's disease: clinical features and diagnosis. J Neurol Neurosurg Psychiatry 79: 368–376, 2008 [DOI] [PubMed] [Google Scholar]
- Jenkinson N, Brown P. New insights into the relationship between dopamine, beta oscillations and motor function. Trends Neurosci 34: 611–618, 2011 [DOI] [PubMed] [Google Scholar]
- Kuhn AA, Kempf F, Brucke C, Gaynor Doyle L, Martinez-Torres I, Pogosyan A, Trottenberg T, Kupsch A, Schneider GH, Hariz MI, Vandenberghe W, Nuttin B, Brown P. High-frequency stimulation of the subthalamic nucleus suppresses oscillatory beta activity in patients with Parkinson's disease in parallel with improvement in motor performance. J Neurosci 28: 6165–6173, 2008 [DOI] [PMC free article] [PubMed] [Google Scholar]
- Lachaux JP, Rodriguez E, Martinerie J, Varela FJ. Measuring phase synchrony in brain signals. Hum Brain Mapp 8: 194–208, 1999 [DOI] [PMC free article] [PubMed] [Google Scholar]
- McFarland NR, Haber SN. Convergent inputs from thalamic motor nuclei and frontal cortical areas to the dorsal striatum in the primate. J Neurosci 20: 3798–3813, 2000 [DOI] [PMC free article] [PubMed] [Google Scholar]
- Nachev P, Kennard C, Husain M. Functional role of the supplementary and pre-supplementary motor areas. Nat Rev Neurosci 9: 856–869, 2008 [DOI] [PubMed] [Google Scholar]
- National Institute of Neurological Disorders and Stroke. Parkinson's Disease: Hope Through Research (Online). http://www.ninds.nih.gov/disorders/parkinsons_disease/detail_parkinsons_disease.htm#118225315 [26 November 2012].
- Pollok B, Kamp D, Butz M, Wojtecki L, Timmermann L, Sudmeyer M, Krause V, Schnitzler A. Increased SMA-M1 coherence in Parkinson's disease–Pathophysiology or compensation? Exp Neurol 247: 178–181, 2013 [DOI] [PubMed] [Google Scholar]
- Pollok B, Krause V, Martsch W, Wach C, Schnitzler A, Sudmeyer M. Motor-cortical oscillations in early stages of Parkinson's disease. J Physiol 590: 3203–3212, 2012 [DOI] [PMC free article] [PubMed] [Google Scholar]
- Priori A, Foffani G, Pesenti A, Tamma F, Bianchi AM, Pellegrini M, Locatelli M, Moxon KA, Villani RM. Rhythm-specific pharmacological modulation of subthalamic activity in Parkinson's disease. Exp Neurol 189: 369–379, 2004 [DOI] [PubMed] [Google Scholar]
- Salenius S, Avikainen S, Kaakkola S, Hari R, Brown P. Defective cortical drive to muscle in Parkinson's disease and its improvement with levodopa. Brain 125: 491–500, 2002 [DOI] [PubMed] [Google Scholar]
- Scherg M, Ille N, Bornfleth H, Berg P. Advanced tools for digital EEG review: virtual source montages, whole-head mapping, correlation, and phase analysis. J Clin Neurophysiol 19: 91–112, 2002 [DOI] [PubMed] [Google Scholar]
- Schoffelen JM, Gross J. Source connectivity analysis with MEG and EEG. Hum Brain Mapp 30: 1857–1865, 2009 [DOI] [PMC free article] [PubMed] [Google Scholar]
- Silberstein P, Oliviero A, Di Lazzaro V, Insola A, Mazzone P, Brown P. Oscillatory pallidal local field potential activity inversely correlates with limb dyskinesias in Parkinson's disease. Exp Neurol 194: 523–529, 2005 [DOI] [PubMed] [Google Scholar]
- Stacy M. Medical treatment of Parkinson disease. Neurol Clin 27: 605–631, 2009 [DOI] [PubMed] [Google Scholar]
- Stam CJ, Nolte G, Daffertshofer A. Phase lag index: assessment of functional connectivity from multichannel EEG and MEG with diminished bias from common sources. Hum Brain Mapp 28: 1178–1193, 2007 [DOI] [PMC free article] [PubMed] [Google Scholar]
- Stoffers D, Bosboom JL, Deijen JB, Wolters EC, Berendse HW, Stam CJ. Slowing of oscillatory brain activity is a stable characteristic of Parkinson's disease without dementia. Brain 130: 1847–1860, 2007 [DOI] [PubMed] [Google Scholar]
- Talairach J, Tournoux P. Co-planar Stereotaxic Atlas of the Human Brain: 3-Dimensional Proportional System: an Approach to Cerebral Imaging. Stuttgart, Germany: Thieme, 1988, p. 122 [Google Scholar]
- Tanji J. The supplementary motor area in the cerebral cortex. Neurosci Res 19: 251–268, 1994 [DOI] [PubMed] [Google Scholar]
- Taulu S, Simola J. Spatiotemporal signal space separation method for rejecting nearby interference in MEG measurements. Phys Med Biol 51: 1759–1768, 2006 [DOI] [PubMed] [Google Scholar]
- Taulu S, Simola J, Kajola M. Applications of the signal space separation method (SSS). IEEE Trans Signal Process 53: 3359–3372, 2005 [Google Scholar]
- Weinberger M, Mahant N, Hutchison WD, Lozano AM, Moro E, Hodaie M, Lang AE, Dostrovsky JO. Beta oscillatory activity in the subthalamic nucleus and its relation to dopaminergic response in Parkinson's disease. J Neurophysiol 96: 3248–3256, 2006 [DOI] [PubMed] [Google Scholar]
- Wichmann T, DeLong MR. Pathophysiology of Parkinson's disease: the MPTP primate model of the human disorder. Ann N Y Acad Sci 991: 199–213, 2003 [DOI] [PubMed] [Google Scholar]
- Williams D, Tijssen M, Van Bruggen G, Bosch A, Insola A, Di Lazzaro V, Mazzone P, Oliviero A, Quartarone A, Speelman H, Brown P. Dopamine-dependent changes in the functional connectivity between basal ganglia and cerebral cortex in humans. Brain 125: 1558–1569, 2002 [DOI] [PubMed] [Google Scholar]
- Wilson TW, Franzen JD, Heinrichs-Graham E, White ML, Knott NL, Wetzel MW. Broadband neurophysiological abnormalities in the medial prefrontal region of the default-mode network in adults with ADHD. Hum Brain Mapp 34: 566–574, 2013 [DOI] [PMC free article] [PubMed] [Google Scholar]