

Abstract
Social behaviour is notoriously difficult to study archaeologically and it is unclear how large the networks of prehistoric humans were, or how they remained connected. Maintaining social cohesion was crucial for early humans because social networks facilitate cooperation and are imperative for survival and reproduction. Recent hunter-gatherer social organisation typically comprises a number of nested layers, ranging from the nuclear family through to the ~1500-strong ethnolinguistic tribe. Here we compare maximum obsidian transfer distances from the late Pleistocene with ethnographic data on the size of the geographic areas associated with each of these social grouping layers in recent hunter-gatherers. The closest match between the two is taken to indicate the maximum social layer within which contact could be sustained by Pleistocene hominins. Within both the (sub)tropical African and Subarctic biomes, the maximum obsidian transfer distances for Pleistocene modern humans (~200km and ~400km respectively) correspond to the geographic ranges of the outermost tribal layer in recent hunter-gatherers. This suggests that modern humans could potentially sustain the cohesion of their entire tribe at all latitudes, even though networks are more dispersed nearer the poles. Neanderthal obsidian transfer distances (300km) indicate that although Neanderthal home ranges are larger than those of low latitude hominins, Neanderthals travelled shorter distances than modern humans living at the same high latitudes. We argue that, like modern humans, Neanderthals could have maintained tribal cohesion, but that their tribes were substantially smaller than those of contemporary modern humans living in similar environments. The greater time taken to traverse the larger modern human tribal ranges may have limited the frequency of their face-to-face interactions and thus necessitated additional mechanisms to ensure network connectivity, such as the exchange of symbolic artefacts including ornaments and figurines. Such cultural supports may not have been required to the same extent by the Neanderthals due to their smaller tribes and home ranges.
Keywords: Latitude, biome, social network layers, population density, Neanderthals, modern humans
Introduction
Social networks are imperative for human survival and reproduction: they allow the sharing of information, knowledge and resources, as well as aiding cooperation, for example in hunting and for collective childcare (e.g. Adams et al., 2002; Cashdan, 1985; Colson, 1979; Low, 1990; Whallon, 2006; Wiessner, 1982). An individual with a larger social network should be better able to cope with local resource failure than someone with a smaller network, due to the more numerous independent sources of help available to them (Nettle, 1996, 1998; Whallon, 2006). Furthermore, a larger network will provide more opportunities for mating and shared childrearing. Similarly, larger networks might be better able to conserve cultural knowledge because the reservoir of ‘experts’ would be larger and this might facilitate the diversification of technology and the cumulative development of complex storage procedures that reduce the risk of shortfalls (Henrich, 2004; Powell et al., 2009; Testart et al., 1982). These advantages mean that maintaining the relationships that comprise social networks is critical, and doing so would seem straightforward given frequent face-to-face interaction. However, rather than being aggregated in a single location, the members of a hunter-gatherer’s social network are distributed between a number of different residential groups, which disperse and re-aggregate over time across an ecologically-determined home range area (Binford, 2001; Grove, 2009; Grove et al., 2012; Layton and O’Hara, 2010). Sustaining social bonds beyond the residential band is a challenge that hunter-gatherers need to solve in order to survive. A key question, then, is to what extent different hominins managed to do this.
The overarching question tackled in this paper is how large a social network late Pleistocene hominins could maintain, in terms of both membership and the geographic area over which members of the network was spread. The number of individuals that could be successfully incorporated into a single network might have limited the advantages listed above. We explore possible variation in network size at different latitudes and between different hominin taxa, namely modern humans and Neanderthals. Note that although technically ‘groups’ are aggregations of individuals whereas ‘networks’ denote the actual relationships between those individuals, due to the paucity of network data for recent hunter-gatherers, we treat groups and networks synonymously here.
Social interaction does not survive in the archaeological or fossil record, so in order to gain insight into potential constraints acting on hominin social network maintenance during the late Pleistocene, we combine archaeological and ethnographic proxies. Raw material transfer distances between archaeological sites and their geological source that exceed typical hunter-gatherer foraging radii have been taken to represent interaction between social groups (Féblot-Augustins, 2009; Gamble, 1998; Marwick, 2003; Mellars, 1996; Moutsiou, 2011). However, if tools are curated they may be carried over distances that exceed the foraging radius of any particular site during the seasonal round or as part of logistic expeditions. We argue that the most conservative interpretation of the distance over which raw materials are moved is that it reflects the distance over which there exists the potential for maintaining social cohesion if social encounters and interactions occur. Whether transfer distances represent actual social interaction depends on which behaviours underlie the movement of raw materials: whether artefacts are exchanged/traded or curated.
If artefacts are exchanged or traded then the distance over which they are transferred directly reflects social interaction and the distance over which social ties are maintained and network cohesion can be assured. Although transfer distances do not necessarily reflect direct exchanges between two social partners, under this scenario raw material displacement distance may represent the summed distance of transfer through a chain of individuals in overlapping exchange networks.
In contrast, if artefacts are curated, their transfer reflects the movement of individuals or social units. However agents move around the landscape we can assume that social interactions do take place, if only for mating purposes, between these individuals or social units and others that they encounter. That is to say, transfers of raw materials under this second scenario do not represent direct face-to-face interactions themselves, but do reflect the potential for interactions to occur at a particular spatial scale. Even if transfers represent a palimpsest of the mobility of individuals over their lifetimes, or even of a specific residential group over its history, rather than inter-personal exchange, the distances involved still give some indication of the area within which inter-individual and inter-group interactions could, and almost certainly did, take place. To a certain extent, therefore, the transfer of curated artefacts can still tell us something about the scale of social interaction.
Interpretation of raw material transfers also depends to some extent on the mobility strategy used, ranging on a continuum from a residential group moving as an integrated unit on a seasonal round to periodic fissioning into logistic subgroups that make forays out from a more sedentary base camp (Binford, 1980). Which strategy dominates will vary both between habitats (which could be exploited by the same group) and seasonally, which might be reflected in the distribution of transfer distance frequencies for different sites in terms of occupation duration and journey length. If transfers are the result of exchange then they may reflect either the social network maintained by the members of a mobile band or the network maintained by individuals in logistic subgroups. Network maintenance via the interaction of logistic subgroups would imply a relatively high degree of variation in network size and structure between individuals in the mobile subgroups (in effect ‘social representatives’) and those in the residential camps left behind. If mobility consists of seasonal rotation of a cohesive residential unit, fluid band membership could equally lead to transfer patterns reflecting the behaviour of independent family units, although there would be less variation between these than in the case of logistic mobility.
On the other hand, if transfers are created through the movement of curated artefacts, then they reflect either the seasonal mobility of residential units (bands) or the movement of fissioned logistic task forces making trips from residential base camps. In terms of implications for social network maintenance, logistical movement might increase the chance that mobility within a certain area leads to social interactions actually taking place: fissioning into logistic subgroups would likely increase the encounter rate with other social groups (similarly to hunting encounters: Grove, 2010a) and thus create more opportunities for maintaining ties.
Although different movement patterns have interesting implications for network maintenance, the ethnographic data we use (Binford, 2001, see below) does not record mobility behaviour in sufficient detail to distinguish between these strategies. Consequently, here we take transfer distances to reflect the geographic area over which groups (whether residential bands or logistic subgroups) move and within which individuals have the potential to maintain social unity through encountering and interacting with other groups.
A greater barrier to interpreting raw material transfers in terms of social behaviour is the possibility that artefacts may have been discarded and re-used by socially disconnected individuals, perhaps in episodes thousands of years apart. However, given the functional and aesthetic value of the raw material we focus on, obsidian (Moutsiou, 2011, 2012), here we assume that artefacts made from this material would either be curated until no longer usable (i.e. until retouching reached diminishing returns) or retained in exchange circulation. In either case this reduces the likelihood of discard and the opportunity for recycling by completely unrelated individuals. Rather than being the result of recycling, we propose that transfer distances represent the geographic extent of either (i) the combined social network of individuals in a social unit of a particular size reflected through direct evidence of exchange or (ii) the area over which social interactions could have taken place given the potential for mobile groups to meet each other. Transfer distances may thus provide information on the total area covered by actual or potential overlapping individual personal networks and we take the more conservative interpretation of potential interaction here. Since individuals cannot interact with the members of groups moving in areas that they themselves do not exploit, this scenario will still provide insight into any upper threshold on social cohesion in terms of social network size.
In this paper, the longest archaeological obsidian transfer distances for a particular time period and environment (Moutsiou, 2011, 2014) are taken to index the maximum area over which component subgroups had the potential to maintain contact. It is worth noting that these data are distances to the nearest obsidian source and do not use chemical identification, meaning that they provide conservative maxima. Previous literature has compared lithic transfer distances to ethnographic hunter-gatherer mobility data, for instance regarding foraging radii and distances associated with visiting relatives and finding a spouse (Cavalli-Sforza and Hewlett, 1982; Gamble, 1998, 1999; Gamble and Steele, 1999; Hewlett et al., 1982; Layton and O’Hara, 2010; Layton et al., 2012; Marwick, 2003; Moutsiou, 2011). However, earlier authors have not used combined archaeological and ethnographic data to infer the level of social organisation different transfer distances might represent, nor to identify any upper limit on the cohesion of a dispersed social network.
Modern hunter-gatherer social organisation typically comprises a nested hierarchy of cumulative groupings (see Table 1), from the innermost nuclear family (~5 individuals) to the outermost ethnolinguistic tribe layer (~1500 individuals), via the foraging party (~15 individuals), band (up to 50 individuals), individual active networks of ~150 individuals (equivalent to a nonhuman primate community) and the megaband or mating community composed of ~500 individuals (e.g. Binford, 2001; Birdsell, 1958; Dunbar, 1998, 2012; Goncalves et al., 2011; Grove, 2010b, 2011; Hamilton et al., 2007; Layton et al., 2012; Lehman et al., in press; Murdock, 1949; Williams and Wobst, 1974; Wobst, 1974, 1976; Zhou et al., 2005). We propose that comparison with the geographic areas associated with different grouping/network layers in recent hunter-gatherers allows the identification of the grouping level most likely reflected by a particular archaeological transfer distance. The larger the geographic distance across which social relationships could be maintained, the greater the number of individuals incorporated into the combined network and the more numerous, and larger, the component nested social layers.
Table 1.
The concentric layers of social organisation in living humans, showing the equivalencies between different terminologies.
| ‘Idealised’ layers based on those identified by Zhou et al (2005) | Personal network layers | Hunter-gatherer grouping layers | Binford’s (2001) hunter-gatherer groups |
|---|---|---|---|
| 5 | Clique | Nuclear family | Family |
| 15 | Sympathy group | Foraging party | Group1 (band during the dispersed phase of the seasonal round) |
| 50 | Affiliation group | Residential band | Group 2 (band during the aggregated phase of the seasonal round) |
| 150 | Active network | Group 3 (periodic aggregations of bands) | |
| 500 | Megaband/endogamous mating pool | ||
| 1500 | Ethnolinguistic tribe | Population |
For example, if maximum obsidian transfer distances most closely resemble the ethnographic range radii associated with recent hunter-gatherer bands, one might infer that different nuclear families and foraging parties were potentially able to maintain contact with each other over the area associated with a band, but that social interaction could not occur between bands (because they could never meet). Such matching would give an indication of the upper limit on the geographic distance over which Pleistocene hunter-gatherers could maintain connectivity between dispersed social units (individuals or subgroups) and thus the approximate membership size of the corresponding social network (in this case, about 50 individuals), assuming that interactions did actually take place. If hominins failed to sustain all layers up to and including the tribe as a single cohesive unit with which members identified (not necessarily as a physical aggregation), then this could have limited their ability to use social means of dealing with resource variation and consequently may have impeded their survival.
Hunter-gatherer social networks are expected to be particularly dispersed at higher latitudes, because decreasing resource and population densities mean that the home range areas over which tribal networks are spread increases nearer the poles (Grove et al., 2012; Kelly, 1995; Pearce, 2013; Pearce et al., 2014). For instance, at higher latitudes and where seasonality is more pronounced, cultural, religious and language groups span larger areas (i.e. are less dense: Collard and Foley, 2002; Fincher and Thornhill, 2008; Mace and Pagel, 1995; Nettle, 1996, 1998, 1999). Since social relationships normally require a certain level of face-to-face interaction to be sustained (Roberts and Dunbar, 2011), any prohibition of sufficient interpersonal contact by large distances would limit the number of people that could cohere in a single tribal network. Due to enlarged home ranges nearer the poles, it is possible that late Pleistocene hunter-gatherers in Europe were unable to maintain as large social networks as those inhabiting more tropical regions. However, obsidian transfer distances are known to be greater in Europe compared to Africa (Moutsiou, 2012) and this may indicate that the same level of social connectivity could be sustained at all latitudes. We test whether the varying maximum obsidian transfer distances in different habitats imply a difference in the level of social cohesion attained, by comparing obsidian transfer distances recorded at different latitudes to the range radii of different grouping levels observed for recent hunter-gatherers living in analogous biomes.
Hominin social organisation can differ both in the number of social network layers that were incorporated in addition to the grooming clique/foraging party and community levels seen in chimpanzees and bonobos, and in the size of those different layers. Through examining the obsidian transfer distances associated with Neanderthals and contemporary modern humans, we aim to determine whether these closely related taxa differed in either or both aspects of social organisation. For instance, it has previously been argued that shorter Neanderthal transfer distances imply smaller social groups and perhaps indicate that, in contrast to modern humans, Neanderthals could not maintain as many social layers (e.g. Burke, 2012; Layton et al., 2012; Mellars, 1996; Pearce et al., 2013). If Neanderthal networks were substantially smaller than those of modern humans, this might have had significant repercussions for Neanderthal survival in terms of a reduced capacity to ride out local resource fluctuations, maintain demographic stability and conserve cultural innovations (Pearce et al., 2013). By combining archaeological and ethnographic signatures of the geographic range of combined social networks, in which ties can be potentially maintained even though members are spatially dispersed, we aim to provide insight into the size of those social networks in different latitudinal habitats and for different hominin taxa.
Method
Recent hunter-gatherers
We use geographic area (from which radii were calculated: see below) and group/population size data collated by Binford (2001), the largest quantitative database of hunter-gatherer societies currently available, for societies classified as mobile, non-mounted and of non-suspect hunter-gatherer status. Binford (2001) gives data on a number of different grouping levels (Table 1) and although Binford’s groups are not presented as necessarily nested, averaged across different biomes their median values are fairly similar to the mean size of the stable concentric layers of living human social group/network organisation (referred to here as ‘idealised’ layers): 5, 15, 50, 150, 500, 1500 (Binford, 2001; Zhou et al., 2005), as demonstrated below. Note the approximate scaling ratio of three between layers (Hamilton et al., 2007; Hill et al., 2008; Lehman et al., 2014; Pearce et al., 2014; Zhou et al., 2005). Although Hamilton et al’s (2007) analysis, which looked specifically at the scaling ratio between social groups in the Binford dataset, reached a ratio closer to four, Lehman et al (2014) have shown that this discrepancy with other work (Hill et al., 2008; Zhou et al., 2005) arises because Hamilton and colleagues chose to incorporate the individual (ego) as an additional social layer. Since the ratio of three has been found across human cultures as well as across non-human species (Hill et al., 2008; Zhou et al., 2005), here we choose to use this value as likely to be more generally representative of hominin social organisation.
Binford (2001) provides sizes for the (i) Family (we have taken the mean during aggregated and dispersed phases of the seasonal cycle combined: M=4.80, median=4.51, range=3-8, N=64), (ii) Group 1 (residential group/band size during the most dispersed phase of the seasonal round and here taken to represent the ‘idealised’ 15-layer foraging party: M=14.15, median=13.50, range=6-32, N=139), (iii) Group 2 (residential group/band size during the most aggregated/fused phase of the seasonal round and here taken as equivalent to the ‘idealised’ 50-layer band: M=41.02, median=36.50, range=20-134, N=148), (iv) Group 3 (size of periodic aggregations and here taken as roughly equivalent to an individual’s active network of 150 or a subset of the 500-strong megaband mating network: M=170.47, median=150.00, range=42-438, N=127) and (v) Population (the total number of individuals belonging to a particular named hunter-gatherer society and here taken as equivalent to the ‘idealised’ 1500-strong ethnolinguistic tribe: M=1074.97, median=550.00, range=23-9000, N=178) (Binford, 2001; Pearce, 2013; Roberts et al., 2009; Zhou et al., 2005), see Table 1. All the societies in the Binford database have Population-level data, but not all societies have data for all of the other four layers.
The ethnographic distance data used were derived from total inhabited population range areas, rather than mobility data per se: in other words, we used the total area over which individuals could travel, rather than the observed distance travelled in a certain time period. This is because we wanted to compare the ethnographic data with straight-line archaeological transfer distances and the annual residential movement distances are likely to deviate from a straight line between two points. If an archaeological site is considered the centre-point, procurement or catchment areas can be calculated by using transfer distances as the radii of those areas (e.g. Gamble, 1999; Roper, 1979). To aid comparison we chose to use the radius of the recent hunter-gatherer range areas (the total space within which individuals could move) associated with different grouping levels. In other words we assume that raw materials are moved from the edge to the centre of exploited areas (radius), rather than from edge to edge (diameter).
In order to calculate the approximate area associated with different grouping levels below the Population/tribal level for each hunter-gatherer society, we divided the number of individuals in the Family, Group 1, Group 2 and Group 3 of each society by the corresponding population density. We calculated the radius of each area modelled as a circle, for comparison with linear obsidian transfer distances (see above). We also calculated the theoretical radii for the ‘ideal grouping layers’ listed above (Zhou et al., 2005) using ethnographic population densities for different biomes following standard formulae: Area (km2)=Number of Individuals divided by Density (individuals/km2), converted into radii using the equation Radius=square root of Area (km2) over pi. Since most variables showed non-normal distributions, for comparisons with archaeological transfer distances and in calculating travelling times we calculated the median, minimum and maximum values per biome.
Biomes
The simulated reconstructions of Pleistocene biome distributions in Europe produced by the Cambridge Stage 3 Project (van Andel and Davies, 2003) indicate that the dominant biomes during Marine Isotope Stage 3 (MIS 3: 60-20 thousand years ago) were evergreen taiga/montane forest in the North and temperate grassland in the South around the Mediterranean, with the switch occurring at ~45° latitude. This suggests that recent hunter-gatherers from the Subarctic/Mid-latitude Continental Forest and Grassland Plains should show the closest correspondence with Pleistocene hominins in Europe. Unfortunately, the groups inhabiting the Plains of North America are mounted and therefore removed from this analysis. The recent Subarctic/Continental Forest groups therefore provide the closest analogy with Pleistocene Europeans in terms of ecologically-driven behaviour, but we also present the data associated with other biomes for comparison.
Transfer distances
We used the maximum obsidian transfer distances inferred from histograms in Moutsiou (2011), which reflect minimum transfer distances to known sources and may thus underestimate actual transfer distances to some degree. These data cover Central and Southeastern Europe, the Near East and East Africa during the Middle Stone Age/Palaeolithic (MSA/MP) and Later Stone Age/Upper Palaeolithic (LSA/UP).
Comparing Neanderthals and modern humans
We used active network (community) sizes estimated from endocranial volumes via a comparative primate equation (Pearce et al., 2013). Since visual and somatic brain regions were likely to have been larger in Neanderthals compared to contemporary modern humans, these endocranial volumes were standardised for visual system size and body size before the group size estimates were calculated (Pearce et al., 2013). The size of the other network layers were estimated from these active network sizes using the scaling factor of ~3 between successive nested network layers/grouping levels (Hamilton et al., 2007; Hill et al., 2008; Zhou et al., 2005): Table 2. We then used biome-specific recent hunter-gatherer population densities (Binford, 2001) to estimate the geographic range for each social layer/grouping.
Table 2.
Grouping/network layers estimated for Neanderthals and contemporary modern humans using different methods, assuming a scaling ratio of three between network layers, following Hill et al (2008) and Zhou et al (2005). The values in bold are the initial group size estimates from which the other layers were calculated using the scaling ratio.
| Social network/grouping layer | Expected group/network layer size for living humans (‘idealised’ layers) (Zhou et al., 2005) [numbers reached when scaling strictly by three from 5-layer upwards] | Group size estimated from: | |||
|---|---|---|---|---|---|
| Mean [minimum-maximum] endocranial volumes standardized for body mass and visual system size (Pearce et al., 2013) | Maximum obsidian transfer distances and a minimum density of 0.003 individuals/km (Moutsiou, 2011; Pearce, 2013) | ||||
| Modern humans | Neanderthals | Modern humans | Neanderthals | ||
| Family | 5[5] | 5 [4-6] | 4 [3-5] | 6 | 3 |
| Foraging Party/Dispersed Band | 15[15] | 15 [12-19] | 13 [9-16] | 19 | 10 |
| (Fused) Band | 50 [45] | 46 [37-57] | 38 [28-47] | 56 | 31 |
| Periodic Aggregation/Active Network | 150 [135] | 139 [112-172] | 115 [84-141] | 168 | 94 |
| Mating Community | 500 [405] | 417 [336-516] | 345 [252-423] | 503 | 283 |
| Ethnolinguistic Tribe/Population | 1500 [1215] | 1251 [1008-1548] | 1035 [756-1269] | 1508 | 848 |
As an alternative approach to using group sizes estimated from standardized endocranial volumes, we used the maximum obsidian transfer distances (converted to areas) associated with each taxon to estimate ethnolinguistic tribe sizes using ethnographic Subarctic hunter-gatherer population densities. We then successively scaled these estimates down by a factor of three in order to estimate the component layers (Table 2).
All estimates were made under the assumption that minimum population densities would have been similar for Neanderthals and modern humans, because attempting to estimate a different Neanderthal population density would add another level of uncertainty to the area and group size estimates. Moreover, assuming the same density yields a conservative estimate of the potential difference in group sizes between modern humans and Neanderthals based on maximum transfer distances (the second procedure described above), since the Neanderthals are likely to have had lower densities associated with their greater body sizes and energy requirements (e.g. Roebroeks et al., 2011) and thus are likely to have had correspondingly smaller tribes than predicted here.
Results
Comparisons between recent and archaeological hunter-gatherers
Table 3 suggests that the maximum radii for bands (Binford’s Groups 1 and 2) and periodic aggregations of bands (Binford’s Group 3) are too low to match maximum Palaeolithic obsidian transfer distances in all biomes. Rather, taken as a whole the archaeological obsidian transfer maxima seem to best match the home range radii of the outermost ethnolinguistic tribe (Population) layer in recent hunter-gatherers (Table 3, Figure 1).
Table 3.
The radii of the geographic areas associated with different grouping levels for recent hunter-gatherers from different biomes (Binford, 2001), compared with archaeological obsidian transfer distances from similar regions (Moutsiou 2011). Sample sizes (N) are for the number of recent hunter-gatherer societies in each biome.
| Biome | Median [range] radius (km) | Archaeological obsidian transfer distances | |||
|---|---|---|---|---|---|
| Band | Periodic Aggregations (Group 3) | Ethnolinguistic Tribe (Population) | |||
| Dispersed (Group 1) | Fused (Group 2) | ||||
| Subtropical Asia (N=5) | 3 [2-12] | 5 [4- 21] | 8 [7- 44] | 18 [13 -154] | |
| Subtropical America (N=8) | 8 [4 – 21] | 13 [5 – 36] | 23 [17 – 62] | 61 [10 – 389] | |
| Subtropical Africa (N=7) | 9 [5 – 21] | 18 [7– 41] | 30 [20– 62] | 61 [28 – 135] | Maximum 200km |
| Australia (N=46) | 6 [3 – 30] | 10 [4 – 45] | 23 [6– 117] | 54 [5 – 209] | |
| California & Northern Mexico (N=16) | 5 [4 – 7] | 8 [6 – 13] | 15 [9 – 23] | 43 [11 – 73] | Central & Southeastern Europe Maximum >400km for Upper Palaeolithic modern humans (Middle Palaeolithic Neanderthals: max=300km) |
| Desert & desert scrub (N=41) | 9 [4 – 21] | 15 [8 – 43] | 29 [11 – 64] | 43 [14– 175] | |
| Subarctic & mid-latitude forest (N=40) | 24 [9 – 42] | 40 [12 – 86] | 74 [19 – 143] | 146 [41– 458] | |
| Arctic (N=15) | 19 [10 – 53] | 29 [15 – 103] | 51 [25 – 137] | 129 [77– 343] | |
Figure 1.

The radii of the total Population/tribal home range areas associated with recent hunter-gatherer societies in different biomes (calculated using data from Binford, 2001). Horizontal dashed lines indicate maximum archaeological obsidian transfer distances during different time periods at different latitudes (Moutsiou, 2011). The Subarctic biome is the closest analogue of Pleistocene Europe (grey box).
At lower latitudes recent hunter-gatherer ethnolinguistic tribe (Population) radii generally do not exceed 200km and this matches the longest Eastern African obsidian transfer distances for all Palaeolithic time periods. In the higher latitude Subarctic and Arctic biomes the maximum ethnographic ethnolinguistic tribe (Population) radii exceed both the low-latitude obsidian limit of 200km and the Middle Palaeolithic (Neanderthal) high latitude obsidian limit of 300km. In the modern Subarctic biome, which seems to correspond to the European habitat during MIS 3 most closely, the maximum recent hunter-gatherer ethnolinguistic tribe (Population) radii matches the Upper Palaeolithic obsidian maximum of >400km: Figure 1, Table 3. The longest obsidian transfers thus seem to match the biome-/latitude-specific maximum range radii for recent hunter-gatherer tribes.
The geographic range radii estimated for ‘idealised’ social network layers (Zhou et al., 2005) yielded similar results to the ethnographic radii derived from observed group sizes: minimum population densities predicted maximum radii of ~400km for the 1500-strong ethnolinguistic tribe layer in the Subarctic/Continental Forest and Arctic biomes, matching maximum Upper Palaeolithic obsidian transfers, Figure 2. For the African biome the maximum radius for the idealised 1500-strong ethnolinguistic tribe (Population) layer (based on minimum population density) was ~200km (219km), again matching low latitude obsidian transfer and observed ethnolinguistic tribe (Population) home range radii data (Figure 2, Table 3).
Figure 2.

The maximum, median and minimum radii estimated for the ‘idealised’ ethnolinguistic tribe social layer comprising 1500 individuals (Hamilton et al., 2007; Zhou et al., 2005) using recent human hunter-gatherer population densities (calculated using data from Binford, 2001). The black dashed line indicates the maximum high latitude obsidian transfer distance and the grey dashed line the low latitude maximum obsidian transfer distance.
In summary, at low latitudes obsidian was transferred a maximum of 200km throughout the Stone Age/Palaeolithic. In contrast, Neanderthals, living at higher European latitudes during the Middle Palaeolithic, were transferring obsidian over longer distances of up to 300km. Since maximum transfer distances in East Africa remain constant from the Earlier Stone Age, it is likely that the common ancestor of modern humans and Neanderthals in Africa was transferring obsidian over no more than 200km. The additional 100km demonstrated by the Neanderthal record in Europe can most likely be attributed to the latitudinal trend of increasing home range areas. In contrast, modern humans in Europe were capable of transferring obsidian over more than 400km, an increase of 200km from low latitude transfer distances. Given the Neanderthal maximum of 300km in high latitudes, we might expect the same for modern human transfer distances in Europe. The 100km in addition to that, bringing the maximum for modern humans up to 400km rather than 300km, may be attributable to larger social network ranges than expected from the latitudinal increase alone reflected by the Neanderthal case.
Social network area comparisons between Neanderthals and modern humans
At the minimum Subarctic/Continental biome population density of 0.003 individuals/km, the estimates of tribe (Population) size derived from standardised endocranial volumes (Table 2) yields a tribal home range radius of 364km for AMH and 331km for Neanderthals (note that a population density an order of magnitude lower for Neanderthals (Mellars and French, 2011) of 0.0003 individuals/km yields a grossly overestimated maximum transfer distance of 1048km). The maximum estimated megaband (~500-strong mating pool layer) radii of 210km for AMH and 191km for Neanderthals, based on a minimum density of 0.003 individuals/km, lie below the maximum obsidian transfer distances observed for these hominins. The obsidian transfer maxima of 400km and 300km, respectively, suggest that both taxa were moving over the entire ranges of their tribes and could thus potentially maintain connectivity within the outermost tribal layer of their respective social networks.
Using maximum transfer distances and recent hunter-gatherer population densities to estimate group sizes (rather than depending on the standardized endocranial volumes as above) yielded an estimated ethnolinguistic population of 848 individuals for Neanderthals and 1508 individuals for AMH (Table 2). The median and maximum population densities for recent hunter-gatherers living in the Subarctic (Binford, 2001) yielded tribal population size estimates for modern humans of 5027 and 135,717 individuals respectively, which are ethnographically unrealistic. We therefore present only the estimates derived from minimum population density in Table 2.
Discussion
Comparison between archaeological obsidian transfer distances and geographic range radii associated with known recent hunter-gatherer grouping layers suggests that at all latitudes modern humans transfer obsidian across the area of their entire tribal home range. Consequently, they should be able to sustain this outermost encompassing network layer as a cohesive and identifiable unit if sufficient social encounters occur.
The maximum ‘social distance’ over which social relationships are routinely maintained is ~200km at low latitudes: for instance, each !Kung family has at least one hxaro exchange partner 150-200km away (Wiessner, 1981, 1982) and Aka pygmies travel maxima of 92km for family visits and 122km for trade (99% confidence intervals calculated from average data from Hewlett et al., 1982). These data match both maximum East African archaeological obsidian transfer distances and maximum subtropical African tribal home range radii in recent hunter-gatherers.
However, given decreasing population densities at higher latitudes, the distance over which social ties are maintained is expected to increase nearer the poles: at the lowest (sub)tropical African density of 0.01 individuals/km2 there would be ~1257 individuals in a circular area with a 200km radius, and at the minimum high latitude (Sub/Arctic) density of 0.003 individuals/km2 this number of individuals would require 419,000km2 of space, giving a radius of 365km. This ‘social distance’ prediction for high latitudes is in line with (i) maximum Upper Palaeolithic modern humans obsidian transfer distances in Europe (>400km) and (ii) the maximum ethnolinguistic tribe range radii of high latitude recent hunter-gatherers (343km in the Arctic and 458km in the Subarctic) (Table 3). Overall, the analysis presented here suggests that modern human hunter-gatherers at all latitudes had the potential to maintain contact across their tribal home ranges during the late Pleistocene: they do not seem to have been limited to smaller networks nearer the poles in terms of having the potential of interacting with groups exploiting the same space.
Geographic areas inferred from active network (cognitive group) sizes based on standardised endocranial volumes suggest that similarly to modern humans, Neanderthals were theoretically capable of maintaining contact across the geographic ranges of their ethnolinguistic tribes rather than being limited to cohesion of only the lower-level social layers, such as the endogamous megaband. The addition of this outer social layer to hominin social organisation is therefore likely to have occurred before the split between the Neanderthal and modern human lineages. The suggestion that Neanderthals maintained links across their tribal home ranges is supported by the work of Ruebens (2013a; 2013b), who has demonstrated regional variation in late Middle Palaeolithic bifacial tools in the Neanderthal record, perhaps suggesting cultural differentiation over substantial areas of Western (Mousterian of the Acheulean Tradition: MTA) versus Central/Eastern Europe (Keilmessergruppe: KMG), with a large contact zone in between (Mousterian Bifacial Tools: MBT). Such regional industries may reflect the ranges of different tribes.
Although the transfer data suggest that both Neanderthals and modern humans could potentially maintain contact within their ethnolinguistic tribes, the infrequent instances of even longer modern humans transfer distances of up to 800km for other lithics and shells in Europe (Féblot-Augustins, 1997; Mellars, 1996; Moutsiou, 2011; Taborin, 1993) suggest that unlike Neanderthal tribes, those of modern humans might have interacted on occasion in some regions. Moreover, the frequency of longer obsidian transfer distances are higher for modern humans than Neanderthals (Moutsiou, 2011), suggesting that although Neanderthal individuals from different endogamous megabands within a tribe could have interacted, they perhaps did so less often than did modern humans from different megabands. This may account for the distinct genetic demes of Western, Southern and Eastern Neanderthals (Dalén et al., 2012; Fabre et al., 2009).
In addition, the estimates of ethnolinguistic tribe size based on maximum obsidian transfer distances and ethnographic population densities suggest that, as expected for living humans, Upper Palaeolithic modern human tribes numbered ~1500 individuals, whereas Neanderthal tribes consisted of only ~848 members. These estimates of social layer size appear to confirm that maximum transfer distances relate to connectivity across the tribe, but suggest that even if both Neanderthals and contemporary modern humans could maintain cohesion across the total home range of their respective ethnolinguistic populations, Neanderthal tribes comprised substantially fewer individuals than those of modern humans. The longer obsidian transfers exhibited by Neanderthals in Europe compared to those of African hominins are likely to reflect the effect of latitude on food resource density and range area, whereas the even longer transfers of European modern humans suggests that their tribal areas were larger than those required by Neanderthals living in the same environment, implying larger modern human social networks. In other words, the transfers of modern humans in nearer the poles exceed what would be expected at higher latitudes given a Neanderthal-sized tribe.
A potential constraint on the area over which networks could remain connected is the time necessary to traverse the distances involved. This suggestion seems to gel well with previous work showing that travelling time is the limiting factor on population-specific community sizes in extant apes and Australopithecines (Bettridge, 2010). Assuming a walking speed of 5km/hour (Binford, 2001; Pearce, 2013), the area associated with the ethnolinguistic tribe (Population) of recent hunter-gatherers breaches the point where its radius can be walked in a 12 hour day at ~30 degrees latitude and cannot be covered in less than 8 hours at any latitude (see Figure 3). In contrast, the radii of areas associated with periodic aggregations of bands (Binford’s Group 3) breach a walking time of 12 hours at ~55 degrees latitude and a walking time of 8 hours at ~40 degrees latitude. Traversing Group 3 radii in order to periodically aggregate with other bands thus only exceeds a day of walking in the Subarctic/Forest and Arctic biomes. These time costs may account for why periodic aggregations rarely incorporate the whole tribe: a limit on the distance that individuals can reasonably cover constrains the size, and frequency, of aggregations.
Figure 3.
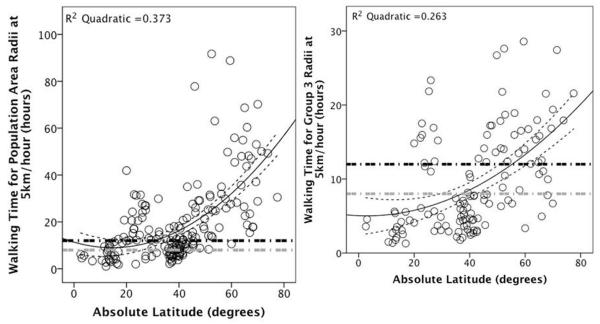
The walking time for radii associated with the ethnolinguistic tribe/Population (LEFT) and Group 3/periodic aggregations (RIGHT) in recent human hunter-gatherers (calculated from group size and area data from Binford 2001). The horizontal dashed lines represent 12- (black) and 8- (grey) hour limits. The curvilinear dashed lines indicate 95% confidence limits for the quadratic regression lines. The walking times are given in absolute hours.
Given the greater distances involved in sustaining modern human tribal connectivity and the consequently reduced frequency of interpersonal contact implied by obsidian transfer distances, higher latitude modern humans may have needed to use cultural scaffolding to support the maintenance of their social ties, for instance through the exchange of symbolic artefacts that are most easily identifiable as abstract or figurative art (Pearce et al., 2014; Shuttleworth, 2013). In addition, since recent hunter-gatherers may use transport aids such as sleds and snow shoes, the close correspondence between archaeological and recent range distances could imply that Upper Palaeolithic modern humans may have been using such technology to minimise travel times in the highest latitude biomes during the shorter day-lengths and more challenging conditions of winter.
Since the apparent difference in social network size between Neanderthals and modern humans seems a matter of degree rather than being qualitatively distinct, any mechanisms for maintaining networks in absentia may be found associated with Neanderthals, but are likely to be expressed to a far lesser extent than by modern humans (Pearce, 2013; Pearce et al., 2014). This might account for the paucity of symbolic artefacts in the Neanderthal record, as well as their apparent lack of time-efficient technologies such as unsupervised traps, which meant that they could not exploit abundant prey such as rabbits (Fa et al., 2013). Neanderthals may not have needed such devices because, in contrast to those of contemporary modern humans, their social networks were spread over sufficiently small areas that frequent face-to-face interaction was feasible and travel times associated with social visiting trips were not prohibitively high (Pearce, 2013; Pearce et al., 2014).
In summary, the maximum obsidian transfer distances for both modern humans and Neanderthals most closely match geographic ranges associated with ethnolinguistic tribes. This finding suggests that these hominins could potentially sustain social contact between megaband mating pools and that each tribe could exist as a cohesive unit, even at the highest latitudes where network dispersion would have been greatest and the frequency of face-to-face interaction lowest. The greater maximum distances over which European Upper Palaeolithic modern humans transferred other materials could imply some interaction between tribes, but this is not the case for the Neanderthals.
Although both Neanderthals and contemporary modern humans could potentially retain connectivity within their tribes, according to these analyses Neanderthal tribes seem to have been considerably smaller than those of modern humans. Having fewer social connections could have had significant implications for the Neanderthals’ ability to ride out resource fluctuations, maintain demographic stability, conserve cultural innovations and, ultimately, survive.
Highlights.
-
■
Modern humans could have maintained tribal connectivity (i.e. all network layers) at all latitudes.
-
■
Neanderthals were potentially able to sustain contact across their tribal ranges.
-
■
Modern humans seem to have had larger tribes than Neanderthals.
-
■
Larger tribal ranges may have necessitated additional bonding mechanisms in modern humans.
Acknowledgements
EP would like to thank Robin Dunbar, Jacques Launay, James Carney and an anonymous reviewer for useful comments during the development of this work and is grateful for funding from a European Research Council Advanced grant. TM would like to thank Clive Gamble for his on-going support as well as the Arts and Humanities Research Council (AHRC) and British Academy for funding the PhD research that generated the obsidian data used here.
Footnotes
The authors declare no conflict of interest.
References
- Adams AM, Madhavan S, Simon D. Women’s social networks and child survival in Mali. Social Science & Medicine. 2002;54:165–178. doi: 10.1016/s0277-9536(01)00017-x. [DOI] [PubMed] [Google Scholar]
- Bettridge C. Australopithecine Socioecology: Adapting Strategic Primate Models for an Extinct Species. Institute of Cognitive and Evolutionary Anthropology. University of Oxford; Oxford: 2010. [Google Scholar]
- Binford LR. Willow smoke and dog’s tails: hunter-gatherer settlement systems and archaeological site formation. American Antiquity. 1980;45:4–20. [Google Scholar]
- Binford LR. Constructing Frames of Reference: An Analytical Method for Archaeological Theory Building Using Ethnographic and Environmental Data Sets. University of California Press; 2001. [Google Scholar]
- Birdsell JB. On population-structure in generalized hunting and collecting populations. Evolution. 1958;12:189–205. [Google Scholar]
- Burke A. Spatial abilities, cognition and the pattern of Neanderthal and modern human dispersals. Quaternary International. 2012;247:230–235. [Google Scholar]
- Cashdan EA. Coping with risk: Reciprocity among the Basarwa of Northern Botswana. Man. 1985;20:454–474. [Google Scholar]
- Cavalli-Sforza LL, Hewlett B. Exploration and mating range in African Pygmies. Annals of Human Genetics. 1982;46:257–270. doi: 10.1111/j.1469-1809.1982.tb00717.x. [DOI] [PubMed] [Google Scholar]
- Collard IF, Foley RA. Latitudinal patterns and environmental determinants of recent human cultural diversity: do humans follow biogeographical rules? Evol. Ecol. Res. 2002;4:371–383. [Google Scholar]
- Colson E. The Harvey Lecture Series. In Good Years and in Bad: Food Strategies of Self-Reliant Societies. Journal of Anthropological Research. 1979;35:18–29. [Google Scholar]
- Dalén L, Orlando L, Shapiro B, Durling MB, Quam R, Gilbert MTP, Díez Fernández-Lomana JC, Willerslev E, Arsuaga JL, Götherström A. Partial genetic turnover in neandertals: continuity in the east and population replacement in the west. Molecular Biology and Evolution. 2012 doi: 10.1093/molbev/mss074. [DOI] [PubMed] [Google Scholar]
- Dunbar RIM. The social brain hypothesis. Evolutionary Anthropology. 1998;6:178–190. [Google Scholar]
- Dunbar RIM. Social cognition on the Internet: testing constraints on social network size. Philosophical Transactions of the Royal Society B-Biological Sciences. 2012;367:2192–2201. doi: 10.1098/rstb.2012.0121. [DOI] [PMC free article] [PubMed] [Google Scholar]
- Fa JE, Stewart JR, Lloveras L, Vargas JM. Rabbits and hominin survival in Iberia. J. Hum. Evol. 2013;64:233–241. doi: 10.1016/j.jhevol.2013.01.002. [DOI] [PubMed] [Google Scholar]
- Fabre V, Condemi S, Degioanni A. Genetic Evidence of Geographical Groups among Neanderthals. PLoS ONE. 2009;4:e5151. doi: 10.1371/journal.pone.0005151. [DOI] [PMC free article] [PubMed] [Google Scholar]
- Féblot-Augustins J. La circulation des matières premières au Paléolthique: Synthèse des données perspectives comportementales. Études et Reserches Archéologiques L’Université de Liège; 1997. [Google Scholar]
- Féblot-Augustins J. Revisiting European Upper Paleolithic Raw Material Transfers: The Demise of the Cultural Ecological Paradigm? Lithic Materials and Paleolithic Societies. Wiley-Blackwell; 2009. pp. 25–46. [Google Scholar]
- Fincher CL, Thornhill R. Assortative sociality, limited dispersal, infectious disease and the genesis of the global pattern of religion diversity. Proceedings of the Royal Society B: Biological Sciences. 2008;275:2587–2594. doi: 10.1098/rspb.2008.0688. [DOI] [PMC free article] [PubMed] [Google Scholar]
- Gamble C. Palaeolithic society and the release from proximity: A network approach to intimate relations. World Archaeology. 1998;29:426–449. [Google Scholar]
- Gamble C. The Palaeolithic Societies of Europe. Cambridge University Press; Cambridge: 1999. [Google Scholar]
- Gamble C, Steele J. Hominid ranging patterns and dietary strategies. In: Ullrich H, editor. Hominid Evolution: Lifestyles and Survival Strategies. Edition Aechaea; Weimar: 1999. pp. 396–409. [Google Scholar]
- Goncalves B, Perra N, Vespignani A. Validation of Dunbar’s number in Twitter conversations. PLoS ONE. 2011;6:e22656. doi: 10.1371/journal.pone.0022656. [DOI] [PMC free article] [PubMed] [Google Scholar]
- Grove M. Hunter-gatherer movement patterns: Causes and constraints. Journal of Anthropological Archaeology. 2009;28:222–233. [Google Scholar]
- Grove M. Logistical mobility reduces subsistence risk in hunting economies. Journal of Archaeological Science. 2010a;37:1913–1921. [Google Scholar]
- Grove M. Stone circles and the structure of Bronze Age society. Journal of Archaeological Science. 2010b;37:2612–2621. [Google Scholar]
- Grove M. An archaeological signature of multi-level social systems: The case of the Irish Bronze Age. Journal of Anthropological Archaeology. 2011;30:44–61. [Google Scholar]
- Grove M, Pearce E, Dunbar RIM. Fission-fusion and the evolution of hominin social systems. J. Hum. Evol. 2012;62:191–200. doi: 10.1016/j.jhevol.2011.10.012. [DOI] [PubMed] [Google Scholar]
- Hamilton MJ, Milne BT, Walker RS, Burger O, Brown JH. The complex structure of hunter-gatherer social networks. Proceedings of the Royal Society B: Biological Sciences. 2007;274:2195–2203. doi: 10.1098/rspb.2007.0564. [DOI] [PMC free article] [PubMed] [Google Scholar]
- Henrich J. Demography and Cultural Evolution: How Adaptive Cultural Processes Can Produce Maladaptive Losses - The Tasmanian Case. American Antiquity. 2004;69:197–214. [Google Scholar]
- Hewlett B, Koppel J.M.H.v.d., Cavalli-Sforza LL. Exploration Ranges of Aka Pygmies of the Central African Republic. Man. 1982;17:418–430. [Google Scholar]
- Hill R, Bentley A, Dunbar RIM. Network scaling reveals consistent fractal pattern in hierarchical mammalian societies. Biology Letters. 2008;4:748–751. doi: 10.1098/rsbl.2008.0393. [DOI] [PMC free article] [PubMed] [Google Scholar]
- Kelly RL. The Foraging Spectrum: Diversity in Hunter-Gatherer Lifeways. Smithsonian Institution Press; Washington; London: 1995. [Google Scholar]
- Layton R, O’Hara Human social evolution: A comparison of hunter-gatherer and chimpanzee social organisation. Proceedings of the British Academy. 2010;158:83–113. [Google Scholar]
- Layton R, O’Hara S, Bilsborough A. Antiquity and social functions of multilevel social organisation among human hunter-gatherers. International Journal of Primatology. 2012;33:1215–1245. [Google Scholar]
- Lehman J, Lee P, Dunbar RIM. Unravelling the function of community-level organisation. In: Dunbar RIM, Gamble C, Gowlett J, editors. The Lucy Project: Benchmark Papers. Oxford University Press; Oxford: 2014. pp. 245–276. [Google Scholar]
- Lehman J, Lee P, Dunbar RIM. Unravelling the function of community-level organisation. In: Dunbar RIM, Gamble C, Gowlett J, editors. The Lucy Project: Benchmark Papers. Oxford University Press; Oxford: in press. [Google Scholar]
- Low B. Human Responses to Environmental Extremeness and Uncertainty: A Cross-Cultural Perpective. In: Cashdan E, editor. Risk & Uncertainty in Tribal & Peasant Economies. Westview Press; Boulder, San Francisco & London: 1990. [Google Scholar]
- Mace R, Pagel M. A Latitudinal Gradient in the Density of Human Languages in North America. Proceedings of the Royal Society B: Biological Sciences. 1995;261:117–121. [Google Scholar]
- Marwick B. Pleistocene Exchange Networks as Evidence for the Evolution of Language. Cambridge Archaeological Journal. 2003;13:67–81. [Google Scholar]
- Mellars P. Symbolism, language and the Neanderthal mind. In: Mellars P, Gibson KR, editors. Modelling the Early Human Mind. Cambridge University Press; 1996. [Google Scholar]
- Mellars P, French JC. Tenfold Population Increase in Western Europe at the Neandertal to Modern Human Transition. Science. 2011;333:623–627. doi: 10.1126/science.1206930. [DOI] [PubMed] [Google Scholar]
- Moutsiou T. The Obsidian Evidence for the Scale of Social Life during the Palaeolithic. Department of Geography; Royal Holloway: 2011. University of London. [Google Scholar]
- Moutsiou T. Changing scales of obsidian movement and social networking. Unravelling the Palaeolithic: Ten years of research at the Centre for the Archaeology of Human Origins (CAHO, University of Southampton) In: Ruebens K, Bynoe R, Romanowska I, editors. British Archaeological Reports. 2012. pp. 85–95. [Google Scholar]
- Moutsiou T. The obsidian evidence for the scale of social life during the Palaeolithic. 2014. (British Archaeological Reports S2613). [Google Scholar]
- Murdock GP. Social Structure. Macmillan; New York: 1949. [Google Scholar]
- Nettle D. Language Diversity in West Africa: An Ecological Approach. Journal of Anthropological Archaeology. 1996;15:403–438. [Google Scholar]
- Nettle D. Explaining Global Patterns of Language Diversity. Journal of Anthropological Archaeology. 1998;17:354–374. [Google Scholar]
- Nettle D. Linguistic Diversity. Oxford University Press; Oxford: 1999. [Google Scholar]
- Pearce E. The Effects of Latitude on Hominin Social Network Maintenance. Department of Anthropology. University of Oxford; 2013. [DPhil Thesis] [Google Scholar]
- Pearce E, Shuttleworth A, Grove M, Layton R. The costs of being a high latitude hominin. In: Dunbar R, Gamble C, Gowlett J, editors. The Lucy Project: Benchmark Papers. Oxford University Press; 2014. pp. 356–379. [Google Scholar]
- Pearce E, Stringer C, Dunbar RIM. New insights into differences in brain organization between Neanderthals and anatomically modern humans. Proceedings of the Royal Society B: Biological Sciences. 2013:280. doi: 10.1098/rspb.2013.0168. [DOI] [PMC free article] [PubMed] [Google Scholar]
- Powell A, Shennan S, Thomas MG. Late Pleistocene Demography and the Appearance of Modern Human Behavior. Science. 2009;324:1298–1301. doi: 10.1126/science.1170165. [DOI] [PubMed] [Google Scholar]
- Roberts SGB, Dunbar RIM. The costs of family and friends: an 18-month longitudinal study of relationship maintenance and decay. Evolution and Human Behavior. 2011;32:186–197. [Google Scholar]
- Roberts SGB, Dunbar RIM, Pollet TV, Kuppens T. Exploring variation in active network size: Constraints and ego characteristics. Social Networks. 2009;31:138–146. [Google Scholar]
- Roebroeks W, Hublin J-J, MacDonald K, Nick Ashton SGL, Chris S. Developments in Quaternary Sciences. Elsevier; 2011. Chapter 8 - Continuities and Discontinuities in Neandertal Presence: A Closer Look at Northwestern Europe; pp. 113–123. [Google Scholar]
- Roper DC. The Method and Theory of Site Catchment Analysis: A Review. Advances in Archaeological Method and Theory. 1979;2:119–140. [Google Scholar]
- Ruebens K. From Keilmesser to Bout Coupé Handaxes: Macro-Regional Variability among Western European Late Middle Palaeolithic Bifacial Tools.om Keilmesser to Bout Coupé Handaxes: Macro-Regional Variability among Western European Late Middle Palaeolithic Bifacial Tools. Bulletin de la Societe prehistorique francaise. 2013a;110:364–365. [Google Scholar]
- Ruebens K. Regional behaviour among late Neanderthal groups in Western Europe: A comparative assessment of late Middle Palaeolithic bifacial tool variability. J. Hum. Evol. 2013b;65:341–362. doi: 10.1016/j.jhevol.2013.06.009. [DOI] [PubMed] [Google Scholar]
- Shuttleworth A. Assessing Neanderthal Behavioural Ecology. School of Archaeology, Classics and Egyptology. University of Liverpool; 2013. PhD Thesis. [Google Scholar]
- Taborin Y. La parure en coquillage au Paléolithique. CNRS Éditions; Paris: 1993. [Google Scholar]
- Testart A, Forbis RG, Hayden B, Ingold T, Perlman SM, Pokotylo DL, Rowley-Conwy P, Stuart DE. The Significance of Food Storage Among Hunter-Gatherers: Residence Patterns, Population Densities, and Social Inequalities [and Comments and Reply] Curr. Anthropol. 1982;23:523–537. [Google Scholar]
- van Andel TH, Davies WD. Neanderthals and Modern Humans in the European Landscape of the Last Glaciation - Archaeological Results of the Stage 3 Project. The McDonald Institute for Archaeological Research; Cambridge: 2003. Simulations provided [online] at: ftp://ftp.essc.psu.edu/pub/emsei/pollard/Stage3/ [Google Scholar]
- Whallon R. Social networks and information: Non-“utilitarian” mobility among hunter-gatherers. Journal of Anthropological Archaeology. 2006;25:259–270. [Google Scholar]
- Wiessner P. Measuring the impact of social ties on nutritional status among the !kung San. Social Science Information. 1981;20:641–678. [Google Scholar]
- Wiessner P. Risk, reciprocity and social influences on!Kung San economics. In: Leacock E, Lee RB, editors. Politics & History in Band Societies. Cambridge University Press; Cambridge, USA: 1982. pp. 61–84. [Google Scholar]
- Williams BJ, Wobst HM. A Model of Band Society. Memoirs of the Society for American Archaeology. 1974:i–138. [Google Scholar]
- Wobst HM. Boundary Conditions for Paleolithic Social Systems: A Simulation Approach. American Antiquity. 1974;39:147–178. [Google Scholar]
- Wobst HM. Locational relationships in Paleolithic society. J. Hum. Evol. 1976;5:49–58. [Google Scholar]
- Zhou WX, Sornette D, Hill RA, Dunbar RIM. Discrete hierarchical organization of social group sizes. Proceedings of the Royal Society B: Biological Sciences. 2005;272:439–444. doi: 10.1098/rspb.2004.2970. [DOI] [PMC free article] [PubMed] [Google Scholar]