Abstract
Aims:
To analyze and compare the angular and linear hard tissue cephalometric measurements using hand-tracing and computerized tracings with Nemoceph and Dolphin software systems.
Subjects and Methods:
A total of 30 cephalograms were randomly chosen for study with the following criteria, cephalograms of patients with good contrast, no distortion, and minimal radiographic artifacts were considered using the digital method (Kodak 8000 C) with 12 angular and nine linear parameters selected for the study. Comparisons were determined by post-hoc test using Tukey HSD method. The N-Par tests were performed using Kruskal-Walli's method.
Statistical Analysis Used:
ANOVA and post-hoc.
Results:
The results of this study show that there is no significant difference in the angular and linear measurements recorded. The P values were significant at 0.05 levels for two parameters, Co-A and Co-Gn with the hand-tracing method. This was significant in ANOVA and post-hoc test by Tukey HSD method.
Conclusions:
This study of comparison provides support for transition from digital hand to computerized tracing methodology. In fact, digital computerized tracings were easier and less time consuming, with the same reliability irrespective of each method of tracing.
KEY WORDS: Cephalometrics, computerized tracing, hand-tracing
Cephalometrics has been a great tool for orthodontic diagnosis and evaluation since its introduction in 1931 by Broadbent.[1] The applications of cephalometrics include case diagnosis, treatment planning and evaluation of treatment results and prediction of growth. Cephalometrics is also useful in deciding the choice of mechanics, and to study relapse.
Traditionally, cephalometric analysis is performed by radiographic landmarks identification and tracing on acetate overlays. These landmarks are used to measure the desired linear and angular values. This traditional hand-tracing process of the currently available 8 inch × 10 inch film can be time consuming, and the linear and angular cephalometric measurements obtained manually with a ruler and protractor may be prone to error.
The advent of computerized cephalometrics was pioneered by Ricketts.[2] He discussed about the importance of application of computerized cephalometrics in treatment planning, case presentation, public relations, monitoring of results, and its application in research.
Digitization of the cephalogram requires the film, chemicals and equipment for conventional films in addition to the cost and space of computer hardware and software. Another disadvantage is the increased time to convert images to a digitized format as well as the increased number of steps with potential errors associated with each step. The advent of digital cephalograms has revolutionized cephalometrics.
These digital forms reduce radiation exposure and allow all the benefits of the older digitized forms of radiology, while eliminating the need for film or the associated chemicals necessary for the development. Though the initial investment is high the benefits of digital cephalograms justify their growing popularity and offer the advantage of digital professionals is also easier. The images can be displayed on a monitor or can be printed.
Aim and objectives
To analyze and compare the angular and linear hard tissue cephalometric measurements using hand-tracing and computerized tracings with Nemoceph (Arroyomolinos (Madrid) Spain) and Dolphin software (CA,USA) systems.
To analyze, compare, and determine the reproducibility of angular and linear measurements by manual, Nemoceph and Dolphin software systems.
The reliability of tracing with manual and computerized methods was to be assessed.
Subjects and Methods
The materials for the investigation consisted of 30 digital lateral cephalometric radiographs. The subjects were positioned in natural head position with Frankfort horizontal plane parallel to the ground. The head was stabilized with ear rods placed in the external auditory meatus, and the nosepiece at the bridge of the nose. The sagittal plane was at right angles to the path of X-rays, the distance from the midsaggital plane to tube was 5 ft. The lateral cephalometric radiographs of the patients were taken using digital method (Kodak 8000 C).
The lateral cephalograms were taken using digital method with a Kodak 8000 C digital panoramic and cephalographic system. The distance of the object was kept at 5 feet. The exposure time/second was kept at 80 KV/0.5 s.
The processing and printing was done with dry view Kodak Laser Imager (DV 5800 Kodak Laser Imager).
Cephalograms were randomly selected for this study with the following criteria, cephalograms of patients with good contrast, no distortion, and minimal radiographic artifacts were considered.
The following are the 12 angular and 9 linear parameters chosen for the study:
Angular parameters
SNA - Angle between sella nasion and point A
SNB - Angle between sella nasion and point B
U1-NA - Upper incisor to nasion – point A line
L1-NB - Lower incisor to nasion – point B line
U and L - Upper and lower incisor angle
IMPA - Incisor mandibular plane angle
FMA - Frankfort mandibular plane angle
Go-Gn-SN - Steiner's mandibular plane angle
Facial axis - Angle between basion – nasion and Ptm - gnathion
Saddle - Angle between nasion, sella and articulare
Articular - Angle between sella, articular and gonion
Gonial - Angle between articulare, gonion and gnathion.
Linear parameters
U1-NA - Upper incisor to nasion – point A line
L1-NB - Lower incisor to nasion – point B line
L1-APog - Lower incisor to pogonion – point A line
N per to A - Nasion perpendicular to point A
N per to Pog - Nasion perpendicular to pogonion
Co-A - Maxillary length
Co-Gn - Mandibular length
NPog-A - Nasion pogonion to point A
LAFH - Lower anterior facial height.
The cephalograms were traced and landmarks identified using 0.5 mm, 3H mechanical lead pencil on to 0.003-inch matte acetate paper taped to digital cephalograms. All tracings were performed on a view box. Using a protractor for angular measurements and a millimeter ruler for linear measurements to the nearest 0.5 mm were made the measurements.
A desktop computer with Windows XP operating system (Microsoft Corp. USA), installed with Nemocep software and Dolphin software were used for the comparative study.
Results
A total of 30 cephalograms were evaluated for this study. Twelve angular and 9 linear hard tissue parameters were traced by hand and compared with computerized hard tissue measurements were located using Manual method, Nemoceph and Dolphin imaging software. A total of 1830 measurements were obtained in all the three methods.
Data analysis
The variability of 21 parameters means, standard deviations, and coefficients of variation (CV) were calculated using ANOVA. The multiple comparisons were determined by post-hoc test using Tukey HSD method. The N-Par tests were performed using Kruskal-Wallis method.
The difference in means between the manual tracing and computerized tracings was determined for each of the parameters. The standard deviation was determined.
The results of the present study show that there is no significant difference in the angular and linear measurements recorded. The P values were significant at 0.05 levels for two parameters, Co-A and Co-Gn with the hand-tracing method. This was significant in ANOVA and post-hoc test by Tukey HSD method.
Discussion
Chen et al.[3] said that traditional hand-tracing process can be time consuming, and the linear and angular cephalometric measurements obtained manually with a ruler and protractor may be prone to error. Time pressures in the clinical environment can contribute to decreased reliability.[4] Sources of errors in cephalometric analysis can be conventional or digital error.
Measurements errors associated with the thickness of the pencil line and the perceptive limits of the human eye also contribute to tracing errors. Previous studies revealed that inconsistency in landmark identification is an important source of error in conventional cephalometry. This error is specific to each landmark and affected by experience and training of the observers.[5] Computer-aided cephalometric analysis is faster in data acquisition and analysis than conventional methods. Moreover, the image can be manipulated to process the image and alter its visual appearance by altering the brightness and contrast and zooming of the image, which can facilitate easy landmark identification.
In addition to converting conventional film to electronic format using a digitizing pad or using a camera or a flatbed scanner. There are two additional types of technology used in current digital imaging. One method utilizes charged couple device (CCD) sensors, and the other utilizes a photo-stimulable phosphor plates.[6]
Although radiographic film is quite stable and can retain its information for many years, due to its physical nature, it is not always a dependable archive medium. Film deterioration has been a major source of information loss in craniofacial biology. Therefore, digital cephalograms is a valuable method for orthodontic clinics.[7]
Errors are introduced when anatomic landmarks are identified on radiographs and subsequent measurements are taken. Variability in landmark identification has been determined to be 5 times greater than measurement variability. It is important to assess the magnitude of identification errors. Density and sharpness of the image, observers experience when locating a particular landmark and precise definition of the location of a landmark and measuring angular and linear measurements are important factors that are to be taken into consideration.[8]
The digitization process of scanner changes the nature of images from an analog form to digital form. However, the use of computers in cephalometrics analysis does not increase the measurement error when compared with hand-tracing.[9]
Many orthodontic offices identify landmarks on monitor-displayed images. Therefore, a comparison between manual traced and monitor-displayed images is necessary if digital images and scanned conventional cephalograms are analyzed by using current Cephalometric software.[10] Geelen et al.[11] compared the reproducibility of cephalometric landmarks by using three different images, which included conventional films and two images acquired by storage phosphor technique, there were many statistically significant differences when the landmarks were identified by using the monitor-displayed image when compared with the conventional film and with the hard copy. There were no statistically significant differences between the conventional film and the hard copy printout.
The aim of this study therefore was to compare linear and angular measurements on digital and digitized cephalometric radiographs with that of conventional images.
In reference to various studies, 30 random digital cephalograms was used in this study. Each cephalogram was analyzed locating 12 angular and 9 linear hard tissue measurements. The criteria for selecting the measurements in this study were that all are hard tissue and these measurements are most commonly used which included both horizontal and vertical measurements.[5]
The 30 random samples of digital cephalograms were processed with the exposed images. All measurements were made by a single investigator to minimize variability of measurement. The manual tracing was considered as the reference cephalogram. The digital images of the cephalogram were imported to Nemoceph and Dolphin V-10 software programs.
The cephalograms were traced and landmarks identified using a 0.5 mm mechanical lead pencil onto 0.003-inch acetate matte tracing paper taped to the digital hard copy cephalogram. This method was considered the reference. The same operator performed all tracings on a view box. Measurements were made by using a cephalometric protractor for angular measurements and a millimeter ruler for linear measurements.
The CCD images were immediately converted directly into a JPEG file by using Digital Imaging System. The landmarks in the software program were registered by using a computer with Windows XP software (Microsoft Corp. USA). The same landmarks on each of the images were identified. The angular and linear parameters was calculated and displayed by the software program.
The reliability of the different modalities, CV was computed for all the parameters. The statistical analysis for all the parameters was performed by using one-way ANOVA, accepting P < 0.05 as significant. The variability among the groups was performed by post-hoc test by Tukey HSD method. The parameters whose means were less than twice the standard deviations were subjected to Kruskal-Wallis Test.
All the 21 parameters both angular and linear were subjected to ANOVA and post-hoc tests. The linear parameters U1-NA, L1-NB, L1-A-Pog, Nper-A, Nper-Pog, N-Pog-A were subjected to Kruskal-Wallis test, as their means were less than twice the standard deviation.
Figures 1 and 2 show Nemoceph software and Figures 3 and 4 show Dolphin software.
Figure 1.
Nemoceph software
Figure 2.
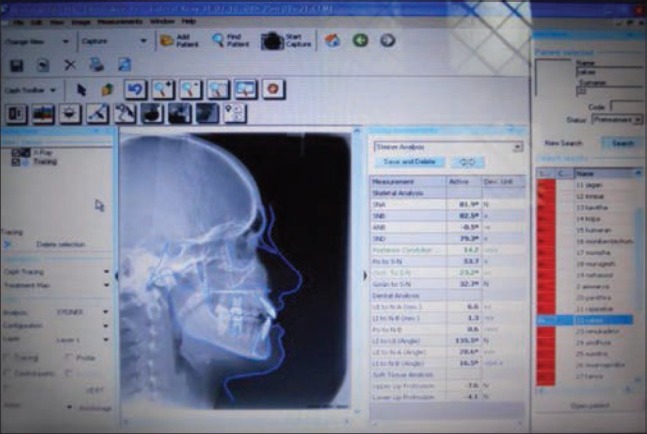
Digital landmarks in Nemoceph imaging
Figure 3.
Dolphin software
Figure 4.
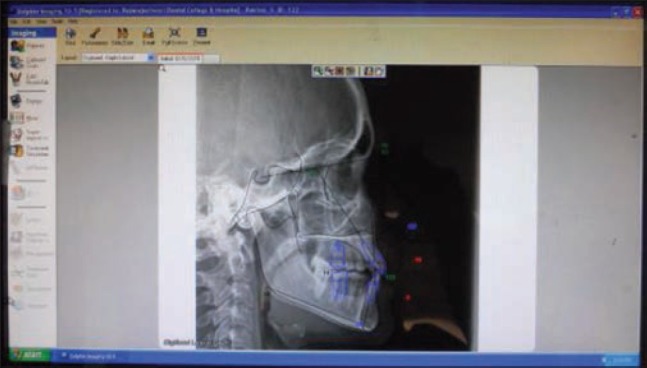
Digital landmarks in Dolphin software
The graphical representations among the groups indicate the following:
The Graph 1 represents the SNA, SNB, U1-NA, L1-NB corresponding to Table 1
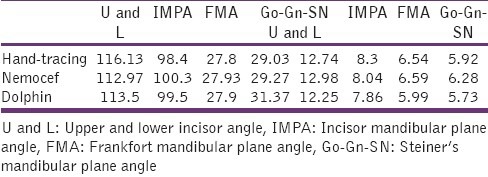
The Graph 2 represents U and L, IMPA, FMA, Go-Gn-SN corresponding to Table 2
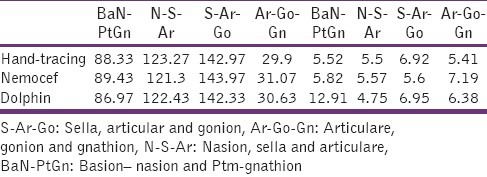
The Graph 3 represents Ba-N-PtGn, N-S-Ar, Ar-S-Go, S-Go-Gn corresponding to Table 3
The Graph 4 represents U1-NA, L1-NB, L1-A-Pog corresponding to Table 4
The Graph 5 represents Nper-A, Nper-Pog, Co-A corresponding to Table 5
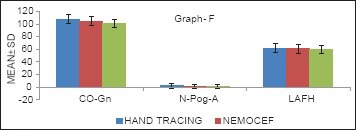
The Graph 6 represents Co-Gn, N-Pog-A, LAFH corresponding to Table 6.
Graph 1.
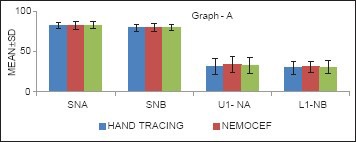
Group comparison of SNA, SNB, U1-NA, L1-NB
Table 1.
MEAN ± SD OF SNA, SNB, U1-NA, L1-NB

Graph 2.
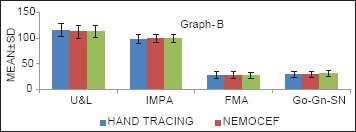
Group comparison of U&L, IMPA, FMA, Go-Gn-SN
Table 2.
MEAN ±SD OF U&L, IMPA, FMA, Go-Gn-SN
Graph 3.
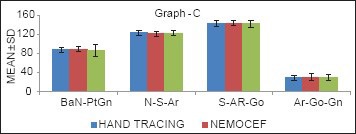
Group comparison of BaN-PtGn, N-S-Ar, S-Ar-Go, Ar-Go-Gn
Table 3.
MEAN ±SD OF BaN-PtGn, N-S-Ar, S-Ar-Go, Ar-Go-Gn
Graph 4.
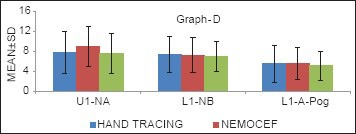
Group comparison of U1-NA, L1-NB, L1-A-Pog
Table 4.
MEAN ±SD OF U1-NA, L1-NB, L1-A-Pog

Graph 5.
Group comparison of Nper-A, Nper-Pog, Co-A
Table 5.
MEAN ±SD OF Nper-A, Nper-Pog, Co-A

Table 6.
MEAN ±SD OF Co-Gn, N-Pog-A, LAFH

Graph 6.

Group comparison of Co-Gn, N-Pog-A, LAFH
The graphical representation of all the parameters indicated that there was no significant variation among the groups (Hand-tracing, Nemoceph, Dolphin).
The results of this study show that there is no significant difference in the values recorded. The P values were significant at 0.05 levels for two parameters, Co-A and Co-Gn with the hand-tracing method. This was significant in ANOVA and post-hoc test by Tukey HSD method.
Huja et al.[12] compared the hand and computer-based cephalometric superimpositions and concluded that the study validates the use of superimpositions using Dolphin Imaging Software Version 10 for the best-fit cranial base was acceptable.
Digital radiography offers many advantages over conventional radiography. The patient's X-ray exposure is greatly reduced. The precision in landmark identification and obtaining a soft copy image is simplified. The digital image on the computer screen can be enlarged, filtered and enhanced for easier viewing. The image can be transferred over the internet without change in quality. Digital radiography is computer dependent and requires an additional software and hardware and is more expensive. As digital images are obtained at reduced exposure and easily enhanced and require no chemical processing they appear to be a feasible and reliable alternative to dental films. The future studies would be made easy with digital radiography and computerized imaging software.
Footnotes
Source of Support: Nil
Conflict of Interest: None declared.
References
- 1.Broadbent BH. A new X-ray technique and its application to orthodontia. Angle Orthod. 1931;1:45–66. [Google Scholar]
- 2.Ricketts RM. The evolution of diagnosis to computerized cephalometrics. Am J Orthod. 1969;55:795–803. doi: 10.1016/0002-9416(69)90052-9. [DOI] [PubMed] [Google Scholar]
- 3.Chen SK, Chen YJ, Yao CC, Chang HF. Enhanced speed and precision of measurement in a computer-assisted digital cephalometric analysis system. Angle Orthod. 2004;74:501–7. doi: 10.1043/0003-3219(2004)074<0501:ESAPOM>2.0.CO;2. [DOI] [PubMed] [Google Scholar]
- 4.Mostafa YA, El-Mangoury NH, Salah A, Rasmy EM. Automated cephalographic soft-tissue analysis. J Clin Orthod. 1990;24:539–43. [PubMed] [Google Scholar]
- 5.Chen YJ, Chen SK, Chang HF, Chen KC. Comparison of landmark identification in traditional versus computer-aided digital cephalometry. Angle Orthod. 2000;70:387–92. doi: 10.1043/0003-3219(2000)070<0387:COLIIT>2.0.CO;2. [DOI] [PubMed] [Google Scholar]
- 6.Menig JJ. The DenOptix digital radiographic system. J Clin Orthod. 1999;33:407–10. [PubMed] [Google Scholar]
- 7.Sayinsu K, Isik F, Trakyali G, Arun T. An evaluation of the errors in cephalometric measurements on scanned cephalometric images and conventional tracings. Eur J Orthod. 2007;29:105–8. doi: 10.1093/ejo/cjl065. [DOI] [PubMed] [Google Scholar]
- 8.Trpkova B, Major P, Prasad N, Nebbe B. Cephalometric landmarks identification and reproducibility: A meta analysis. Am J Orthod Dentofacial Orthop. 1997;112:165–70. doi: 10.1016/s0889-5406(97)70242-7. [DOI] [PubMed] [Google Scholar]
- 9.Held CL, Ferguson DJ, Gallo MW. Cephalometric digitization: A determination of the minimum scanner settings necessary for precise landmark identification. Am J Orthod Dentofacial Orthop. 2001;119:472–81. doi: 10.1067/mod.2001.112876. [DOI] [PubMed] [Google Scholar]
- 10.Gregston MD, Kula T, Hardman P, Glaros A, Kula K. A comparison of conventional and digital radiographic methods and cephalometric analysis software: Hard tissue. Semin Orthod. 2004;10:204–10. [Google Scholar]
- 11.Geelen W, Wenzel A, Gotfredsen E, Kruger M, Hansson LG. Reproducibility of cephalometric landmarks on conventional film, hardcopy, and monitor-displayed images obtained by the storage phosphor technique. Eur J Orthod. 1998;20:331–40. doi: 10.1093/ejo/20.3.331. [DOI] [PubMed] [Google Scholar]
- 12.Huja SS, Grubaugh EL, Rummel AM, Fields HW, Beck FM. Comparison of hand-traced and computer-based cephalometric superimpositions. Angle Orthod. 2009;79:428–35. doi: 10.2319/052708-283.1. [DOI] [PubMed] [Google Scholar]


