

Abstract
Background
Papillary thyroid carcinoma (PTC) has relatively indolent behavior, although some tumors recur and disseminate to distant sites. The aggressive biological behavior of PTC is difficult to predict. MicroRNAs (miRNAs) are dysregulated in various tumors types, and some of them serve as markers of poor prognosis. In this study, we evaluated miRNA expression as a marker of more aggressive behavior in PTC.
Methods
miRNA array was used to identify a subset of differentially expressed miRNAs between aggressive and non-aggressive PTC. These miRNAs were further validated by real-time RT-PCR in a cohort of 17 PTC with local tumor recurrence or distant metastases and 15 PTC with no extrathyroidal dissimination and correlated with BRAF, RAS, and RET/PTC mutations and MET expression.
Results
The miRNA array identified miR-146b, -221, -222, -155, -31 upregulation and miR-1, -34b, -130b, -138 downregulation in aggressive compared to non-aggressive PTC. Significant miRNA deregulation was confirmed in the validation cohort, with upregulation of miR-146b and miR-222 and downregulation of miR-34b and miR-130b seen in aggressive PTC. Among BRAF positive tumors, miR-146b showed strong association with aggressive PTC. MET was identified as a potential target gene for two downregulated miRNAs (miR-34b and miR-1), and significantly higher level of MET expression was observed in aggressive PTC.
Conclusions
We demonstrate that miR-146b, -222, -34b, -130b are differentially expressed in aggressive as compared to non-aggressive PTC. Among BRAF positive tumors, overexpression of miR-146b was associated with aggressive behavior, suggesting that it may further refine the prognostic importance of BRAF.
Keywords: aggressive papillary thyroid cancer (PTC), miRNA expression, BRAF mutation, MET expression
Introduction
Papillary thyroid cancer (PTC) is the most commonly diagnosed thyroid cancer. Although its incidence is increasing, the overall prognosis is very favorable with current 5-year survival rates of >95% (1). However, a subset of patients not readily identified by histopathologic staging will have aggressive disease characterized by local recurrence and/or distant metastasis. Identification of patients with PTC and an aggressive phenotype can potentially help guide clinical management by optimizing surgery, adjuvant therapy, and long term follow-up.
MicroRNAs (miRNA) are small, endogenous non-coding RNAs that are negative gene expression regulators and are important in embryonic development. MiRNA expression is tissue specific and dysregulation of miRNA expression has been described in a variety of tumors including lung, pancreas, breast and colorectal cancer (2). More than 700 human miRNAs have been described that regulate up to a third of all genes (3). In thyroid cancer, miRNA expression pattern depends on cellular origin and degree of tumor differentiation (4). Several studies have reported upregulation of miR-146b, miR-221 and miR-222 in papillary thyroid carcinoma (5-10). We recently identified a set of 7 miRNAs (miR-187, miR-221, miR-222, miR-146b, miR-155, miR-224, and miR-197) that were overexpressed at least 2-fold in PTC compared to benign hyperplastic nodules (11). Characterization of this panel has diagnostic utility and in fine needle aspiration specimens, upregulation of ≥3 of the 7 miRNAs in the panel can predict differentiated thyroid cancer with 88% sensitivity and 100% specificity (11).
Our study also showed a correlation between miRNA expression profile and oncogenic mutations known to be associated with thyroid carcinogenesis. The majority (>70%) of PTC have a non-overlapping genetic alteration, either a BRAF or RAS mutation, or RET/PTC rearrangement, that results in activation of the MAPK signaling pathway. The type of genetic alteration also correlates with tumor phenotype providing important prognostic information. For example, PTC with the BRAF V600E mutation is more likely to have extrathyroidal extension, lymph node metastasis, advanced stage at diagnosis, and need for cervical reoperation (12-14). However, BRAF mutations are found in 40-45% of PTC, and therefore not all BRAF positive tumors demonstrate an aggressive behavior. Moreover, not all aggressive PTC carry a BRAF mutation. Therefore, identifying new markers of aggressiveness in PTC is of interest and would be important for patient management.
In this study, we aimed to identify miRNAs differentially expressed in patients with more aggressive PTC, such as those with local recurrence and/or distant metastasis as compared to PTC patients without those complications on similar follow-up. We also correlated the miRNA expression with genetic mutations known to be associated with thyroid cancer and MET expression, an oncogene commonly overexpressed in PTC.
Materials and Methods
Tissue Samples
Snap-frozen tissue from surgically removed thyroid samples were collected at the Department of Pathology, University of Cincinnati following the University of Cincinnati Institutional Review Board (IRB) approval or obtained through the Cooperative Human Tissue Network (CHTN). Formalin-fixed paraffin-embedded (FFPE) tissues samples were obtained at the Department of Pathology, University of Pittsburgh after IRB approval. All tumors were reviewed by a single pathologist (Y.E.N.) and classified according to the widely accepted diagnostic histologic criteria (15). For the validation set of cases, after IRB approval we evaluated the clinicopathologic parameters of patients with PTC who were surgically treated at the University of Pittsburgh Medical Center. A cohort of PTC patients with local recurrence or distant metastatic (AG) disease was identified and a comparison cohort of PTC patients without recurrent or distant metastasis (NAG) disease was pair matched by age at presentation (± 1 year) and by length of clinical follow-up (± 6 months).
Nucleic Acid Isolation
Total RNA was isolated using Trizol reagent (Invitrogen, Carlsbad, CA) for snap frozen tissues as previously described (16). For FFPE tissues, tumor targets were manually microdissected from the 5 μm unstained histologic sections under the guidance of a corresponding H&E slide using an Olympus SZ61 stereo microscope (Olympus, Hamburg, Germany). RNA was isolated using RNeasy FFPE kit (Qiagen, Valencia, CA) to according to manufactures protocol. RNA yield was determined using the NanoDrop 1000 spectrophotometer (ThermoScientific, Wilmington, DE). RNA integrity was assessed with the Agilent 6000 NANO kit for the 2100 Bioanalyzer (Agilent Technologies, Santa Clara, CA) and by amplification of small nucleolar RNA RNU44 and GAPDH housekeeping gene. DNA was isolated using the DNeasy Tissue kit on the automated QIAcube (Qiagen, Valencia, CA) instrument.
miRNA Expression Array
Quantitation of expression of 319 mature miRNA was performed using FlexmiR™ human microRNA pool, version 8 (Exiqon, Vedbaek, Denmark) and analyzed on Luminex 200 (Luminex Corporation, Austin, Texas, USA) according to manufacturer instructions. In detail, 2.5 μg total RNA was labeled with biotin using the FlexmiR™ MicroRNA Labeling Kit (Luminex, Austin, Texas, USA) and subsequently hybridized to beads coated with locked nucleic acids (LNA) probes complementary to mature miRNA sequences. All samples were assayed in duplicate. The system calibration was performed using the xMAP™ calibration control reagents (Luminex, Austin, Texas, USA). A blank control set of beads was used to normalize the background value for every individual miRNA. The five synthetic controls and four small nucleolar RNA (snoRNA) normalization controls were used to adjust mean fluorescence intensities between samples and between runs using the average correction factor for these controls as recommended by the manufacturer. Finally, the miRNA expression in tumor samples was quantitated relatively to normal tissue using Luminex IS™ software v.2.3 (Luminex, Austin, Texas, USA)
miRNA Real-Time-RT-PCR
The measurement of the expression levels of individual miRNAs was performed using miRNA sequence specific primers (Applied Biosystems Inc., Foster City, CA) by the real time-RT-PCR-based detection methodology. Briefly, 10 ng of total RNA was reverse transcribed using High-Capacity cDNA Archive kit (Applied Biosystems Inc., Foster City, CA) followed by amplification on ABI 7500 Real-Time PCR System (Applied Biosystems Inc., Foster City, CA). All RT-PCR reactions were performed in triplicate Small nucleolar RNA RNU44 was used as endogenous control for the normalization of RNA input. miRNA expression levels were calculated by relative quantitation using the ABI 7500 Real-Time PCR SDS 1.2 software (Applied Biosystems Inc., Foster City, CA) and the fold expression changes were determined by 2-ΔΔCT method (17).
Detection of Mutations and MET expression
The DNA was tested for BRAF V600E and K601E, NRAS codon 61, HRAS codon 61, KRAS codons 12 and 13 point mutations using real-time LightCycler PCR and fluorescence melting curve analysis (FMCA) and RET/PTC rearrangements by real-time RT-PCR with primers designed to flank the respective fusion point as previously described (18). All samples that tested positive for mutations were sequenced using BigDye Terminator Kit on the ABI3130 (Applied Biosystems).
Expression of the MET gene was evaluated by reverse transcription and PCR amplification with gene specific primers (forward primer, 5′-GTC GCT TCA TGC AGG TGG TG-3′ spanned exons 3 and 4 and reverse primer, 5′- TGG GAG TCC AGG AGA AAA TTC A-3′ located in exon 4) and probe (5′-FAM-TTT CTC GAT CAG GAC CAT CAA CCC CTC-3BHQ-3′) using QuantiTech Probe RT-PCR Kit (Qiagen, Valencia, CA). GAPDH housekeeping gene was used as normalization control. Briefly, 5-50 ng of total RNA were reverse transcribed and amplified in a 50-μl volume using QuantiTect Probe RT Mix and 40 pmol of each primer and 2 pmol of each hybridization probe. The reverse transcription was carried out at 50°C for 30 min followed by 40 cycles PCR amplification (denaturation at 94°C for 15 sec and annealing and extension at 72°C for 60 sec).
Statistical Analysis
Differences in miRNA expression levels between groups were evaluated with Wilcoxon Two Sample test and paired Student's T-test. Statistical analyses were performed using SAS version 9.2 (SAS Institute Inc., Cary, NC). A significance level is set at p≤.05 and all P values reported are 2-sided. Agglomerative hierarchical clustering analysis was performed using Cluster software and TreeView software (http://genome-www5.stanford.edu/resources/restech.shtml) (19).
Search for Target Genes
Putative miRNA target genes were identified using miRBase (http://microrna.sanger.ac.uk), TargetScan (http://genes.mit.edu/targetscan) (20) and PicTar (http://pictar.bio.nyu.edu) (21) target prediction programs.
Results
MiRNA expression was initially assessed with miRNA array in 12 snap frozen PTC tissue, including 6 aggressive tumors, 6 non-aggressive tumors, and 4 normal thyroid tissues. The aggressive tumors were identified based on the presence of local recurrence and/or distant metastases, and were matched by mutational status (4 BRAF positive, 1 RET/PTC positive, and 1 tumor with no mutations) to tumors with no such complications after similar length follow-up (mean follow-up 6.1 years). miRNA array analysis for expression of 319 miRNAs revealed a subset of upregulated miRNAs (miR-146b, miR-221, miR-222, miR-155, miR-31) and downregulated miRNAs (miR-153, miR-448, miR-325, miR-382, miR-495, miR-34b, miR-1, miR-144, miR-367, miR-130b, and miR-138) that was seen in all 12 tumors when compared to normal thyroid tissue (Fig. 1A). However, the levels of expression were different between the aggressive and non-aggressive groups (Fig. 1B). miR-146b, miR-221, miR-222, and miR-155 were upregulated to a significantly greater degree in aggressive PTCs as compared to non-aggressive tumors (p=0.0001, 0.01, 0.07, and 0.01, respectively) and miR-1, miR-34b, miR-130b, and miR-138 demonstrated stronger downregulation in aggressive tumors as compared to non-aggressive PTCs (p=0.08, 0.001, 0.07, 0.3, respectively).
Fig. 1.
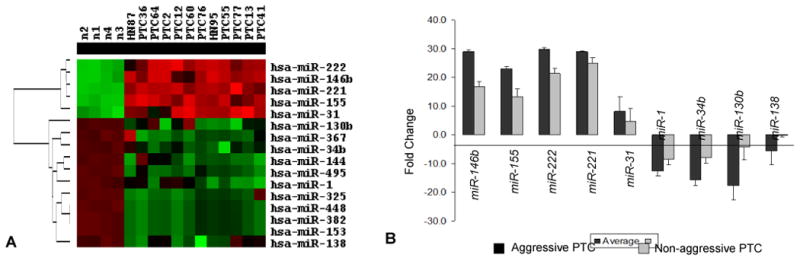
miRNA expression in papillary thyroid carcinomas using array approach. A-Cluster dendrogram demonstrates differentially expressed miRNAs in PTC and normal thyroid tissue. B-miRNAs dysregulated between aggressive and non-aggressive PTCs.
For the validation cohort, 37 PTC patients were selected. Nineteen PTCs were collected from patients with disease recurrence and/or distant metastasis (AG) and 18 from patients without recurrence or metastasis (NAG) who were selected to match the age and length of clinical follow-up of the AG patients. After nucleic acid isolation, RNA quality control was not adequate for 5 FFPE tissues and these cases were excluded from the study. The remaining 32 PTCs (17 AG and 15 NAG) were analyzed for miRNA expression and the panel of mutations frequently detected in thyroid cancer. The age of patients ranged from 21-79 years, and the female:male ratio was 3.3:1. Mutational analysis revealed 16 BRAF V600E mutations, one NRAS codon 61 mutation, and 3 RET/PTC rearrangements which were evenly distributed among the 2 study groups. Apart from locoregional recurrence and/or the presence of distant metastasis which defined the AG cohort, there were no differences between the 2 groups with respect to patient demographics, histologic subtype, or AJCC stage at presentation (Table 1).
Table 1. Initial clinicopathologic characteristics of tumors in the validation set.
| Aggressive (n=17) | Non-Aggressive (n=15) | p-value | |
|---|---|---|---|
| Age at Initial Thyroidectomy, mean yrs (range) | 42 (16-72) | 44 (21-73) | 0.93 |
| Men, No. (%) | 8 (47) | 6 (40) | 1 |
| Stage at Presentation* | 0.3 | ||
| I/II | 10 | 13 | |
| III/IV | 6 | 2 | |
| Unknown | 1 | 0 | |
| Initial tumor size, mean cm (range) | 3.8 (1.1-8) | 3.0 (1-5.5) | 0.2 |
| Histologic subtype | 0.2 | ||
| Conventional | 5 | 7 | |
| Tall Cell | 6 | 2 | |
| Follicular | 2 | 5 | |
| Other | 4 | 1 | |
| Mutation | 0.5 | ||
| BRAF | 10 | 6 | |
| RAS | 0 | 1 | |
| RET/PTC | 1 | 2 | |
| None | 6 | 6 | |
| Length of Follow-up, yrs (range) | 9 (4-26) | 8 (0.04-26) | 0.5 |
| Time to recurrence, yrs (range) | 7.9 (2.5-21.7) | NA |
Using American Joint Committee on Cancer Staging, 6th Edition (2002) Staging
Using real-time RT-PCR, expression of the miRNAs that were initially identified by miRNA array to be differentially dysregulated in aggressive and non-aggressive PTC, was evaluated in the validation cohort. In concordance with the array data, miR-146b, miR-221, miR-222, miR-31 were found to be upregulated more than 2-fold in AG PTC as compared NAG tumors, but miR-155 did not show similar dysregulation (Table 2). In particular, the expression levels of miR-146b and miR-222 were significantly higher in the AG PTC group (p=0.003 and 0.018 respectively). MiR-1, miR-34b, miR-130b, and miR-138 were found to be downregulated more than 2-fold in AG PTC with significantly stronger downregulation for miR-34b (p=0.017) and miR-130b (p=0.02) when compared to NAG tumors (Table 2).
Table 2. Levels of miRNA dysregulation in aggressive and non-aggressive PTC detected by RT-PCR.
| miRNA | Aggressive PTC | Non-aggressive PTC | Aggressive vs. Non-aggressive |
|---|---|---|---|
| Fold change | Fold Change | P Value | |
| miR-146b | 96.7 | 26.9 | 0.0031 |
| miR-221 | 7.6 | 3.1 | 0.1425 |
| miR-222 | 19.5 | 7.7 | 0.0177 |
| miR-155 | 7.0 | 6.0 | 0.5261 |
| miR-31 | 6.6 | 3.2 | 0.331 |
| mir-1 | 0.4 | 0.8 | 0.1545 |
| mir-130b | 0.3 | 0.7 | 0.0197 |
| mir-34b | 0.5 | 1.1 | 0.0172 |
| mir-138 | 0.3 | 0.6 | 0.189 |
We also compared miRNA expression in BRAF positive AG vs NAG PTCs to address the question if dysregulation of these miRNAs is independent of BRAF mutational status. miR-146b was upregulated more than two times higher in aggressive BRAF-positive tumors as compared to non-aggressive BRAF-positive tumors (p=0.023) (Table 3, Fig. 2). Other miRNAs demonstrated a tendency for differential expression in BRAF-positive AG vs NAG tumors, but the levels did not reach statistical significance (Table 3).
Table 3. miRNA expression in BRAF-positive PTCs.
| miRNA | BRAF Positive Aggressive PTC | BRAF Positive Non-aggressive PTC | Aggressive vs. Non-aggressive |
|---|---|---|---|
| Fold change | Fold Change | P | |
| miR-146b | 165.1 | 78.9 | 0.0225 |
| miR-221 | 10.0 | 15.3 | 0.6354 |
| miR-222 | 25.2 | 16.3 | 0.3676 |
| miR-155 | 12.0 | 6.1 | 0.4923 |
| miR-31 | 10.2 | 12.3 | 0.8749 |
| mir-1 | 0.56 | 0.91 | 0.2635 |
| mir-130b | 0.35 | 0.48 | 0.1806 |
| mir-34b | 0.57 | 1.95 | 0.1179 |
| mir-138 | 1.12 | 0.39 | 0.9578 |
Fig. 2.
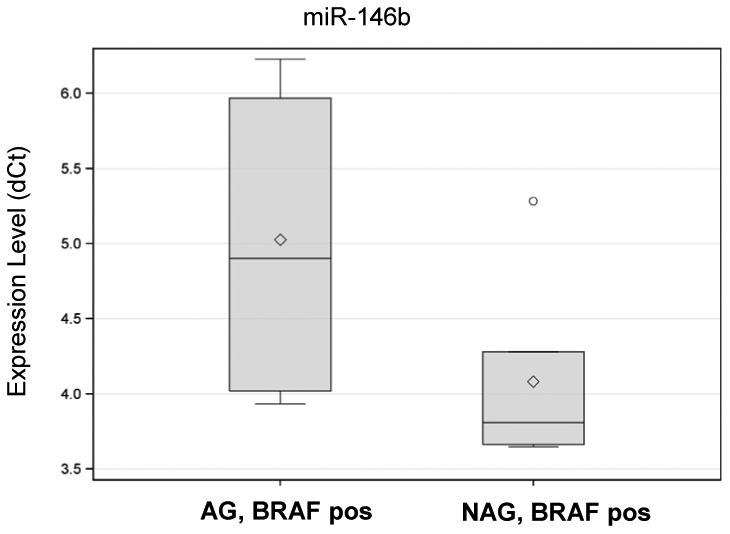
Box plot analysis of miR-146b expression in aggressive and non-aggressive PTCs.
Next, we searched for potential target genes for the downregulated miRNAs using available prediction programs (miRBase, TargetScan and PicTar). Interestingly, two downregulated miRNAs (miR-1 and miR-34b) had MET as a predicted target gene. In the 3′UTR of MET, we identified potential binding sites for miR-1 at nucleotides 811-817 and for miR-34b at nucleotides 2379-2385 (Fig. 3). Moreover, recent reports have demonstrated that MET can be directly regulated by these miRNAs (22, 23). We then evaluated the expression of the MET gene by RT-PCR in PTC and normal thyroid tissue. MET was found to be overexpressed in all PTC however, MET expression was significantly stronger in AG PTC compared to NAG tumors (49.4 and 17.7 correspondingly, p=0.024) (Fig. 4). In addition, MET was expressed more than 3 times higher in aggressive PTC positive for BRAF V600E mutation as compared to non-aggressive BRAF-positive tumors (75.9 and 24.2, p=0.055) (Fig. 4).
Fig. 3.
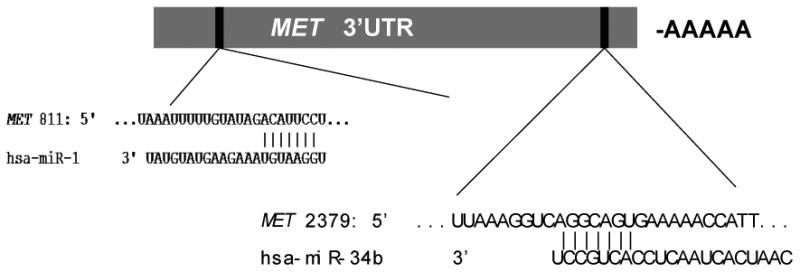
Schematic representation of miR-34b and miR-1 binding sites in the MET 3′UTR.
Fig. 4.
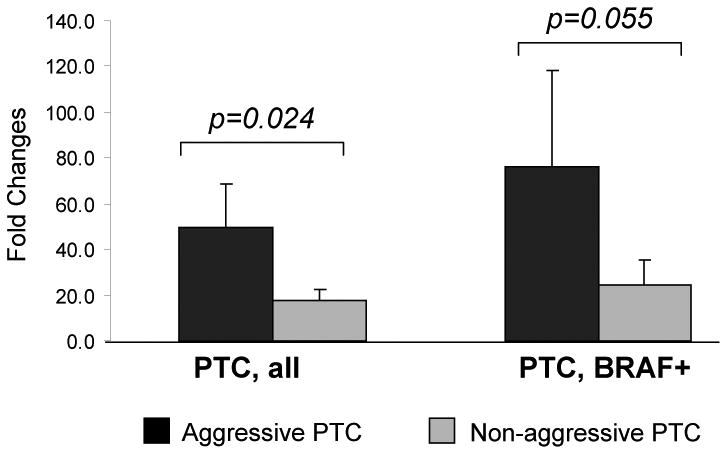
MET expression in aggressive and non-aggressive PTCs.
Discussion
Although PTC has an overall 5-year survival of >97% with current treatment modalities, improved risk stratification at the time of diagnosis can help to tailor subsequent therapy. The AJCC staging system is not as accurate for stratifying recurrence risk which has clinical significance for most PTC patients. This limitation of the staging system is evident in our selected cohorts as we did not observe any significant difference in initial stage between the 2 study groups, even though the aggressive PTC patients eventually developed locoregional recurrence or distant metastatic disease. A number of molecular markers have been studied as candidates for improved tumor prognostication. For example, the BRAF V600E mutation has been associated in a number of studies with aggressive PTC characteristics such as extrathyroidal extension, lymph node metastases, recurrence, decreased survival, and need for cervical reoperation (12-14). Previously, we demonstrated that patterns of miRNA expression correlate with different histopathologic types of thyroid cancer and with different oncogenic mutations (11), suggesting that there could be an association between miRNA expression and biological characteristics of PTC.
Using the miRNA expression assay as an initial screen, we report here that a number of miRNAs are differentially expressed in aggressive PTC, characterized by distant metastasis or recurrent disease after conventional treatment, as compared to non-aggressive PTC. After expression levels were quantified and validated in a separate comparison cohort, we observed that aggressive PTCs were characterized by differential upregulation of miR-146b and miR-222 in addition to downregulation of miR-130b and miR-34b. Although there are several studies describing the use of miRNAs to diagnose thyroid cancer and distinguish between the histopathologic variants, this is the first to identify a subset of upregulated and downregulated miRNAs that could have prognostic utility as well.
We also evaluated the validation cohort for the known somatic mutations commonly associated with PTC. Overall, BRAF V600E was more common in our cohort of aggressive PTC but was also present in non-aggressive tumors suggesting that BRAF status is not the only predictor of aggressive biologic behavior. Within the group of BRAF-positive PTC, we observed differential miRNA expression in the aggressive compared to the non-aggressive tumors. In particular, miR-146b was significantly overexpressed in the BRAF-positive PTC that also had aggressive tumor behavior, suggesting that miR-146b could be an additional prognostic marker. Not all BRAF-positive PTC demonstrate aggressive biologic behavior and identification of a new marker that is associated with BRAF-positive tumors and poor prognosis could be particularly informative.
Chou et al. recently reported an association between BRAF positivity and miR-146b in aggressive PTC (24). The cellular mechanism contributing to the association between BRAF, miR-146b overexpression and aggressive PTC is unclear. In vitro overexpression of BRAF V600E has been shown to upregulate genes in the NF-kappa B pathway resulting in apoptotic resistance (25). In contrast, miR-146b negatively regulates the NF-kappaB pathway and in breast cancer cell lines, miR-146b upregulation has been shown to actually suppress metastases (26, 27). However, miR-146b has never been specifically studied in BRAF positive thyroid cancer cells. It is possible that dysregulation of NF-kappaB is associated with more aggressive tumor variants and in fact constitutively deregulated NF-kappaB has been seen in anaplastic thyroid cancers (25).
We were interested in evaluating other possible miRNA target genes and found that MET has potential binding sites for miR-34b and miR-1, two of the downregulated miRNAs that we identified to be associated with aggressive PTC. Migliore et al. demonstrated that the miRNAs miR-34b, miR-34c, and miR-199a can negatively regulate MET expression (23). Transfection of human carcinoma cell lines with these miRNAs showed significantly reduced levels of MET mRNA and protein. In addition, their inhibition with antagomiRs was associated with increased expression of MET protein suggesting their role in regulation of MET expression. Downregulation of miR-1 has been reported in lung cancer and primary human hepatocellular carcinomas (28, 29). Recently, Duan and colleagues showed that transfection of chordoma cells with miR-1 inhibits cell growth and significantly decreases MET expression (22). Accordingly, we observed downregulation of miR-34b and miR-1 in aggressive PTCs as well as associated MET overexpression providing a possible mechanism for the observed biologic behavior that warrants further study.
MET proto-oncogene encodes the tyrosine kinase receptor for hepatocyte growth factor which is found to be overexpressed in many human cancers. In the thyroid gland, MET has been shown to be expressed in PTC and some studies correlated MET overexpression with aggressive histological features and advanced stage of the disease (30-32). Other studies demonstrated an inverse correlation between MET expression and PTC aggressiveness (33). In this study we report significant overexpression of MET mRNA in aggressive PTCs as compared to non-aggressive tumors. Even among BRAF positive tumors, MET overexpression was associated with aggressive PTC suggesting that this pathway could be independent of BRAF mutational status. Corresponding MET protein overexpression in in vitro thyroid cancer cell lines will be needed to confirm the mechanistic effects of miRNA dysregulation and these studies are in progress. MET expression is of interest for both prognostic as well as therapeutic reasons. Foretinib, a tyrosine kinase inhibitor, has targeted activity for MET and has recently been shown in a phase I trial to be clinically safe (34). This provides a potential additional therapeutic option for patients with aggressive PTC associated with MET overexpression.
In summary, we demonstrate that a subset of miRNAs is differentially expressed in aggressive compared to non-aggressive papillary thyroid carcinomas and may potentially have prognostic utility in papillary thyroid cancer. Moreover, it appears that miR-146b overexpression is associated with aggressive PTC independent of BRAF mutational status, and its use thus may provide further refinement of the risk stratification of patients with BRAF-positive tumors.
Synopsis.
MiRNAs are differentially expressed in aggressive compared to nonaggressive papillary thyroid cancers and can be used to help stratify the risk of recurrence and metastatic disease in PTC patients.
Acknowledgments
Supported in part by the by the NIH grant R01 CA88041 to Y.E.N.
Footnotes
Disclosure statement: The authors have nothing to disclose
References
- 1.Altekruse SFKC, Krapcho M, Neyman N, Aminou R, Waldron W, Ruhl J, Howlader N, Tatalovich Z, Cho H, Mariotto A, Eisner MP, Lewis DR, Cronin K, Chen HS, Feuer EJ, Stinchcomb DG, Edwards BK, editors. SEER Cancer Statistics Review, 1975-2007. National Cancer Institute; Bethesda, MD: 2010. http://seer.cancer.gov/csr/1975_2007/ based on November 2009 SEER data submission, posted to the SEER web site. [Google Scholar]
- 2.Esquela-Kerscher A, Slack FJ. Oncomirs - microRNAs with a role in cancer. Nat Rev Cancer. 2006;6:259–269. doi: 10.1038/nrc1840. [DOI] [PubMed] [Google Scholar]
- 3.Ryan BM, Robles AI, Harris CC. Genetic variation in microRNA networks: the implications for cancer research. Nat Rev Cancer. 10:389–402. doi: 10.1038/nrc2867. [DOI] [PMC free article] [PubMed] [Google Scholar]
- 4.Schwertheim S, Sheu SY, Worm K, Grabellus F, Schmid KW. Analysis of deregulated miRNAs is helpful to distinguish poorly differentiated thyroid carcinoma from papillary thyroid carcinoma. Horm Metab Res. 2009;41:475–481. doi: 10.1055/s-0029-1215593. [DOI] [PubMed] [Google Scholar]
- 5.He H, Jazdzewski K, Li W, Liyanarachchi S, Nagy R, Volinia S, Calin GA, Liu CG, Franssila K, Suster S, Kloos RT, Croce CM, de la Chapelle A. The role of microRNA genes in papillary thyroid carcinoma. Proc Natl Acad Sci U S A. 2005;102:19075–19080. doi: 10.1073/pnas.0509603102. [DOI] [PMC free article] [PubMed] [Google Scholar]
- 6.Chen YT, Kitabayashi N, Zhou XK, Fahey TJ, 3rd, Scognamiglio T. MicroRNA analysis as a potential diagnostic tool for papillary thyroid carcinoma. Mod Pathol. 2008;21:1139–1146. doi: 10.1038/modpathol.2008.105. [DOI] [PubMed] [Google Scholar]
- 7.Pallante P, Visone R, Ferracin M, Ferraro A, Berlingieri MT, Troncone G, Chiappetta G, Liu CG, Santoro M, Negrini M, Croce CM, Fusco A. MicroRNA deregulation in human thyroid papillary carcinomas. Endocr Relat Cancer. 2006;13:497–508. doi: 10.1677/erc.1.01209. [DOI] [PubMed] [Google Scholar]
- 8.Tetzlaff MT, Liu A, Xu X, Master SR, Baldwin DA, Tobias JW, Livolsi VA, Baloch ZW. Differential Expression of miRNAs in Papillary Thyroid Carcinoma Compared to Multinodular Goiter Using Formalin Fixed Paraffin Embedded Tissues. Endocr Pathol. 2007;18:163–173. doi: 10.1007/s12022-007-0023-7. [DOI] [PubMed] [Google Scholar]
- 9.Sheu SY, Grabellus F, Schwertheim S, Worm K, Broecker-Preuss M, Schmid KW. Differential miRNA expression profiles in variants of papillary thyroid carcinoma and encapsulated follicular thyroid tumours. Br J Cancer. 102:376–382. doi: 10.1038/sj.bjc.6605493. [DOI] [PMC free article] [PubMed] [Google Scholar]
- 10.Nikiforova MN, Chiosea SI, Nikiforov YE. MicroRNA expression profiles in thyroid tumors. Endocr Pathol. 2009;20:85–91. doi: 10.1007/s12022-009-9069-z. [DOI] [PubMed] [Google Scholar]
- 11.Nikiforova MN, Tseng GC, Steward D, Diorio D, Nikiforov YE. MicroRNA Expression Profiling of Thyroid Tumors: Biological Significance and Diagnostic Utility. J Clin Endocrinol Metab. 2008;93:1600–1608. doi: 10.1210/jc.2007-2696. [DOI] [PMC free article] [PubMed] [Google Scholar]
- 12.Elisei R, Ugolini C, Viola D, Lupi C, Biagini A, Giannini R, Romei C, Miccoli P, Pinchera A, Basolo F. BRAF(V600E) mutation and outcome of patients with papillary thyroid carcinoma: a 15-year median follow-up study. J Clin Endocrinol Metab. 2008;93:3943–3949. doi: 10.1210/jc.2008-0607. [DOI] [PubMed] [Google Scholar]
- 13.Xing M. BRAF mutation in papillary thyroid cancer: pathogenic role, molecular bases, and clinical implications. Endocr Rev. 2007;28:742–762. doi: 10.1210/er.2007-0007. [DOI] [PubMed] [Google Scholar]
- 14.Yip L, Nikiforova MN, Carty SE, Yim JH, Stang MT, Tublin MJ, Lebeau SO, Hodak SP, Ogilvie JB, Nikiforov YE. Optimizing surgical treatment of papillary thyroid carcinoma associated with BRAF mutation. Surgery. 2009;146:1215–1223. doi: 10.1016/j.surg.2009.09.011. [DOI] [PubMed] [Google Scholar]
- 15.DeLellis RA, Lloyd RV, Heitz PU, Eng C, editors. World Health Organization Classification of Tumours. Lyon: IARC Press; 2004. Pathology and Genetics of Tumours of Endocrine Organs. [Google Scholar]
- 16.Nikiforova MN, Caudill CM, Biddinger P, Nikiforov YE. Prevalence of RET/PTC Rearrangements in Hashimoto's Thyroiditis and Papillary Thyroid Carcinomas. Int J Surg Pathol. 2002;10:15–22. doi: 10.1177/106689690201000104. [DOI] [PubMed] [Google Scholar]
- 17.Livak KJ, Schmittgen TD. Analysis of relative gene expression data using realtime quantitative PCR and the 2(-Delta Delta C(T)) Method. Methods. 2001;25:402–408. doi: 10.1006/meth.2001.1262. [DOI] [PubMed] [Google Scholar]
- 18.Nikiforov YE, Steward DL, Robinson-Smith TM, Haugen BR, Klopper JP, Zhu Z, Fagin JA, Falciglia M, Weber K, Nikiforova MN. Molecular testing for mutations in improving the fine-needle aspiration diagnosis of thyroid nodules. J Clin Endocrinol Metab. 2009;94:2092–2098. doi: 10.1210/jc.2009-0247. [DOI] [PubMed] [Google Scholar]
- 19.Eisen MB, Spellman PT, Brown PO, Botstein D. Cluster analysis and display of genome-wide expression patterns. Proc Natl Acad Sci U S A. 1998;95:14863–14868. doi: 10.1073/pnas.95.25.14863. [DOI] [PMC free article] [PubMed] [Google Scholar]
- 20.Lewis BP, Shih IH, Jones-Rhoades MW, Bartel DP, Burge CB. Prediction of mammalian microRNA targets. Cell. 2003;115:787–798. doi: 10.1016/s0092-8674(03)01018-3. [DOI] [PubMed] [Google Scholar]
- 21.Krek A, Grun D, Poy MN, Wolf R, Rosenberg L, Epstein EJ, MacMenamin P, da Piedade I, Gunsalus KC, Stoffel M, Rajewsky N. Combinatorial microRNA target predictions. Nat Genet. 2005;37:495–500. doi: 10.1038/ng1536. [DOI] [PubMed] [Google Scholar]
- 22.Duan Z, Choy E, Nielsen GP, Rosenberg A, Iafrate J, Yang C, Schwab J, Mankin H, Xavier R, Hornicek FJ. Differential expression of microRNA (miRNA) in chordoma reveals a role for miRNA-1 in Met expression. J Orthop Res. 28:746–752. doi: 10.1002/jor.21055. [DOI] [PubMed] [Google Scholar]
- 23.Migliore C, Petrelli A, Ghiso E, Corso S, Capparuccia L, Eramo A, Comoglio PM, Giordano S. MicroRNAs impair MET-mediated invasive growth. Cancer Res. 2008;68:10128–10136. doi: 10.1158/0008-5472.CAN-08-2148. [DOI] [PubMed] [Google Scholar]
- 24.Chou CK, Chen RF, Chou FF, Chang HW, Chen YJ, Lee YF, Yang KD, Cheng JT, Huang CC, Liu RT. miR-146b is highly expressed in adult papillary thyroid carcinomas with high risk features including extrathyroidal invasion and the BRAF(V600E) mutation. Thyroid. 20:489–494. doi: 10.1089/thy.2009.0027. [DOI] [PubMed] [Google Scholar]
- 25.Pacifico F, Leonardi A. Role of NF-kappaB in thyroid cancer. Mol Cell Endocrinol. 321:29–35. doi: 10.1016/j.mce.2009.10.010. [DOI] [PubMed] [Google Scholar]
- 26.Bhaumik D, Scott GK, Schokrpur S, Patil CK, Campisi J, Benz CC. Expression of microRNA-146 suppresses NF-kappaB activity with reduction of metastatic potential in breast cancer cells. Oncogene. 2008;27:5643–5647. doi: 10.1038/onc.2008.171. [DOI] [PMC free article] [PubMed] [Google Scholar]
- 27.Hurst DR, Mehta A, Moore BP, Phadke PA, Meehan WJ, Accavitti MA, Shevde LA, Hopper JE, Xie Y, Welch DR, Samant RS. Breast cancer metastasis suppressor 1 (BRMS1) is stabilized by the Hsp90 chaperone. Biochem Biophys Res Commun. 2006;348:1429–1435. doi: 10.1016/j.bbrc.2006.08.005. [DOI] [PMC free article] [PubMed] [Google Scholar]
- 28.Nasser MW, Datta J, Nuovo G, Kutay H, Motiwala T, Majumder S, Wang B, Suster S, Jacob ST, Ghoshal K. Down-regulation of micro-RNA-1 (miR-1) in lung cancer. Suppression of tumorigenic property of lung cancer cells and their sensitization to doxorubicin-induced apoptosis by miR-1. J Biol Chem. 2008;283:33394–33405. doi: 10.1074/jbc.M804788200. [DOI] [PMC free article] [PubMed] [Google Scholar] [Retracted]
- 29.Datta J, Kutay H, Nasser MW, Nuovo GJ, Wang B, Majumder S, Liu CG, Volinia S, Croce CM, Schmittgen TD, Ghoshal K, Jacob ST. Methylation mediated silencing of MicroRNA-1 gene and its role in hepatocellular carcinogenesis. Cancer Res. 2008;68:5049–5058. doi: 10.1158/0008-5472.CAN-07-6655. [DOI] [PMC free article] [PubMed] [Google Scholar] [Retracted]
- 30.Nardone HC, Ziober AF, LiVolsi VA, Mandel SJ, Baloch ZW, Weber RS, Mick R, Ziober BL. c-Met expression in tall cell variant papillary carcinoma of the thyroid. Cancer. 2003;98:1386–1393. doi: 10.1002/cncr.11638. [DOI] [PubMed] [Google Scholar]
- 31.Scarpino S, Cancellario d'Alena F, Di Napoli A, Pasquini A, Marzullo A, Ruco LP. Increased expression of Met protein is associated with up-regulation of hypoxia inducible factor-1 (HIF-1) in tumour cells in papillary carcinoma of the thyroid. J Pathol. 2004;202:352–358. doi: 10.1002/path.1522. [DOI] [PubMed] [Google Scholar]
- 32.Ruco LP, Stoppacciaro A, Ballarini F, Prat M, Scarpino S. Met protein and hepatocyte growth factor (HGF) in papillary carcinoma of the thyroid: evidence for a pathogenetic role in tumourigenesis. J Pathol. 2001;194:4–8. doi: 10.1002/path.847. [DOI] [PubMed] [Google Scholar]
- 33.Belfiore A, Gangemi P, Costantino A, Russo G, Santonocito GM, Ippolito O, Di Renzo MF, Comoglio P, Fiumara A, Vigneri R. Negative/low expression of the Met/hepatocyte growth factor receptor identifies papillary thyroid carcinomas with high risk of distant metastases. J Clin Endocrinol Metab. 1997;82:2322–2328. doi: 10.1210/jcem.82.7.4104. [DOI] [PubMed] [Google Scholar]
- 34.Eder JP, Shapiro GI, Appleman LJ, Zhu AX, Miles D, Keer H, Cancilla B, Chu F, Hitchcock-Bryan S, Sherman L, McCallum S, Heath EI, Boerner SA, LoRusso PM. A phase I study of foretinib, a multi-targeted inhibitor of c-Met and vascular endothelial growth factor receptor 2. Clin Cancer Res. 16:3507–3516. doi: 10.1158/1078-0432.CCR-10-0574. [DOI] [PubMed] [Google Scholar]