

Abstract
Recent epidemiological studies have suggested that radiation exposure from pediatric CT scanning is associated with small excess cancer risks. However, the majority of CT scans are performed on adults, and most radiation-induced cancers appear during middle or old age, in the same age range as background cancers. Consequently, a logical next step is to investigate the effects of CT scanning in adulthood on lifetime cancer risks by conducting adult-based, appropriately designed epidemiological studies. Here we estimate the sample size required for such studies to detect CT-associated risks. This was achieved by incorporating different age-, sex-, time- and cancer type-dependent models of radiation carcinogenesis into an in silico simulation of a population-based cohort study. This approach simulated individual histories of chest and abdominal CT exposures, deaths and cancer diagnoses. The resultant sample sizes suggest that epidemiological studies of realistically sized cohorts can detect excess lifetime cancer risks from adult CT exposures. For example, retrospective analysis of CT exposure and cancer incidence data from a population-based cohort of 0.4 to 1.3 million (depending on the carcinogenic model) CT-exposed UK adults, aged 25–65 in 1980 and followed until 2015, provides 80% power for detecting cancer risks from chest and abdominal CT scans.
INTRODUCTION
Because of its wide-ranging utility, the use of computed tomography (CT) scanning is rapidly increasing (1, 2), with patients typically scanned multiple times both during a single series and over their lifetime (3, 4). The cumulative organ doses of ionizing radiation delivered to patients are comparable in magnitude to organ doses experienced by a substantial subset of Japanese atomic bomb survivors, which were sufficient to result in a small, statistically significant excess risk of radiation-induced cancers (5). This suggests that the radiation exposure from CT scans might be associated with small increases in cancer risks (6), and thus impact overall population risks. Of particular note are the estimated 20–30 million CT scans per year in the U.S. that may have limited clinical utility (7).
Using risk predictions derived mainly from atomic bomb survivors’ data (6), several epidemiological studies of individuals who had undergone pediatric CT scans were initiated (8), and the first two studies were recently published by Pearce et al. (9) and by Mathews et al. (10). The overall conclusion for these two large-scale studies of pediatric CT, which directly estimated CT-associated cancer risks in two Western populations, was that CT-induced excess cancer risks were small, but statistically detectable.
A logical next research goal is to quantify the cancer risks associated with lifetime histories of CT scans, including scans performed in adulthood. A primary motivation for this study is that adults receive over 10 times more CT scans than children (4, 11), so it is important to understand the risks associated with adult scans (12, 13).
The goal of this article is to provide a broad outline of the sample size that would be required to perform an epidemiological study of cancer risks related to CT exposures in adulthood. As an example, we consider a hypothetical retrospective population-based cohort study in the UK, which would track CT-exposed individuals and cancer diagnoses between 1980 (when widespread CT usage began) and 2015. We project the excess cancer risks (combined for ten common radiogenic malignancies) potentially induced by chest and abdominal CT scans, and apply three radiation carcinogenesis models described below, to estimate the study sample size which would be needed to detect total cancer risks associated with a lifetime of CT scans with 80% statistical power.
The precise characteristics of the study design would, of course, depend on the location of the study, the available information, records-keeping system, mechanisms for follow-up and outcome ascertainment and other factors. Information on previous medical conditions, reasons for any specific CT, characteristics of individual CTs, timing, machine settings, etc., would be functions of any specific cohort. Describing these attributes, while vital for establishing a cohort, is largely beyond the scope of this article. Here we intend only to offer guidelines regarding the sample size that would be necessary to detect CT-related cancer risks, assuming that the magnitude of these risks per unit of radiation dose is similar to the magnitude found by previous radiation epidemiological studies such as those performed with the atomic bomb survivors.
For studies designed to quantify total cancer risks induced by CT scans, two factors offer potential challenges to using subjects exposed as adults: (1) the somewhat reduced sensitivity of adults (compared with children) to radiation-induced cancer per unit of radiation dose (5, 14, 15), and (2) the difficulties of extracting the signal of CT scan radiation from a complex mixture of potentially carcinogenic exposures that accumulate over the subject's lifetime, although the latter is problematic only insofar as the potential confounding exposure is CT related. However, these disadvantages are balanced by important advantages of adult-based cohorts. First, adults are likely to accumulate larger numbers of CT scans (and therefore CT doses), because CT scanning tends to be used more frequently in adults than in children (4, 16), and since dose for an adult includes the doses from pediatric CT exposures. For example, in the U.S. only 3.5% of abdominal and pelvic CT scans (which provide the greatest contribution to collective population dose among all CT scan types) were performed on patients younger than 18 years of age (16). Second, as shown in Fig. 1, current models of radiation carcinogenesis predict that most radiation-induced solid cancers appear during the same “cancer-prone” age range (roughly ages 50–80) as background cancers (5, 14). Consequently, the expected excess CT-induced cancers are maximized when these “cancer-prone” ages are included in the follow-up period of the cohort study. As we show, the “cancer-prone” ages are included in the study with a follow-up period of 1980–2015 for those individuals who have reached adulthood (ages 20 and older) by 1980. In contrast, a large percentage of members of cohorts whose members were children in 1980 would not yet have reached the “cancer-prone” age range within the study follow-up period.
FIG. 1.
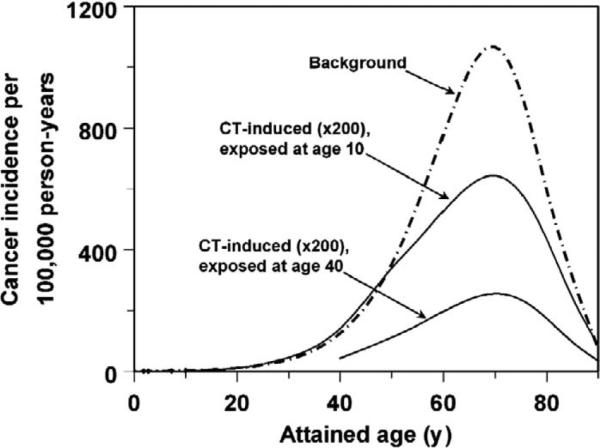
Predicted CT-induced cancer incidence rates peak during the same “cancer-prone” age range as background cancer (roughly 50–80), even if CT exposure occurred much earlier. Here the sex-averaged background cancer incidence rate for the UK population (http://www.cancerresearchuk.org/) is compared with the incidence rates of excess cancers induced by a single chest CT scan administered at ages 10 or 40 [predicted by the BEIR-VII model (5)]. Both CT-induced and background cancer incidence rates were corrected for age-dependent mortality (http://www.statistics.gov.uk/hub/index.html). Qualitatively similar curves were produced if other radiation carcinogenesis models were used instead of the BEIR VII model.
METHODS
The goal of the proposed retrospective population-based cohort study is to estimate the overall cancer risk in adults associated with a typical lifetime of CT scans. We simulated the study using data from countries with centralized health care systems and analyzed the results, as described below.
Quantitative Simulation of a Population-Based Cohort Study
Our calculations were based on life histories of individuals from a hypothetical cohort of UK adults, who were alive, free of cancer and unexposed to CT in 1980. Each simulated individual was tracked until the minimum of 2015, year of death or cancer diagnosis (for any of ten common cancer types: breast, lung, esophageal, stomach, liver, colon, kidney, bladder, ovarian, leukemia).
We used data from published sources. The UK Office for National Statistics website (http://www.statistics.gov.uk/hub/index.html) provided information on age-dependent population structure, age- and sex-dependent mortality rates and calendar year trends in the frequency of CT scanning in the UK over the proposed study period, starting in 1980 and projected until 2015. The Cancer Research UK website (http://www.cancerresearchuk.org/) provided age- and sex-specific background incidence rates for the ten selected cancers. These “background” population-based rates include the potential effects of CT exposures. Because this bias increases the “true” background cancer incidence rate, making the CT-induced increase more difficult to detect, it will tend to inflate our sample size estimates somewhat, making them more conservative. However, since the magnitude of the expected CT-induced cancer incidence is small (<1% over a person's lifetime), this use of “incorrect rates” will have only a small impact on sample size calculations. The age-dependent distribution of CT scanning frequency, and the fraction of diagnostic and therapeutic CT scans performed in cancer patients (who were excluded from the cohort study) were taken from ref. (4). Typical organ doses for adult chest and abdominal CT scans were taken from ref. (17).
We are interested in the effects of a lifetime of CT scans as well as the impact of the age at CT administration. Since cancer sensitivity by age at exposure is not currently well determined (15), we calculated CT-induced cancer risks for the ten cancer types using three different age- and time-dependent models of radiation carcinogenesis: (1) the BEIR-VII model (5); (2) the Preston et al. model (14, 18); and (3) the Shuryak et al. model (15). These three published models are based predominantly on Japanese atomic bomb survivors’ data, but differ mainly in their treatment of the effects of age at exposure on excess relative risks per Gray (ERR/Gy) (Fig. 2). Model 1 predicts a monotonic decrease in the ERR/Gy with age at exposure until the age at exposure of 30, and a constant ERR/Gy at older ages at exposure. Model 2 predicts a monotonic decrease in ERR/Gy over the entire range of ages at exposure, from birth to old age. Model 3 predicts a U-shaped dependence of ERR/Gy on age at exposure, with a minimum in adolescence/early adulthood.
FIG. 2.

The age at exposure dependences of radiation carcinogenesis, predicted by three different models: Model 1, BEIR VII (5); Model 2, Preston et al. (14, 18); and Model 3, Shuryak et al. (15). The y-axis represents sex-averaged excess relative risk per unit dose (ERR/Gy) at an attained age of 70 for all cancers combined.
Models 1 and 2 represent phenomenological fits to the atomic bomb survivors’ cancer incidence data, while model 3 represents a more biologically motivated model, but also fitted to essentially the same data. Model equations are shown in the Appendix. Using each model, CT-induced risks were calculated for each simulated individual, based on the individual's age, sex, date(s) of chest and/or abdominal CT exposures and the typical organ doses from these exposures.
Sample Size Calculations
We performed two in silico simulations for each set of population characteristics (Fig. 3), as described below. The first simulation assumed radiation from CT exposures had no effect on cancer incidence. The sum of all cancer cases in CT-exposed persons divided by the sum of person-years contributed by these same individuals after CT exposure produced an estimate of the “expected” incidence rate (r2) and represents the null hypothesis, i.e., that all cancer cases in CT-exposed persons were due to background processes and unrelated to CT exposure.
FIG. 3.

A schematic diagram of the process used here to estimate the sample size of a population-based cohort study designed to detect CT-induced cancer risks. Details are described in this article.
We then simulated a population with the same initial characteristics, but now allowing for CT exposure effects based on organ doses from CT scans from ref. (17). The “observed” cancer incidence rate (r1) in CT-exposed persons from the simulated population, estimated from these data, represents the alternative hypothesis, i.e., that some cancer cases would be induced by CT exposures. We estimated the sample size needed to detect differences between the “observed” and “expected” cancer incidence rates, as described in the Appendix.
RESULTS
Sample size estimates generated by our calculations vary markedly depending on CT-usage assumptions and on the choice of risk model (Table 1). Nonetheless, the general pattern shows that cancer risks induced by chest and abdominal CT scans are (in principle) detectable by a cohort study enrolling approximately 0.4–1.3 million CT-exposed UK adults who were between the ages of 25 and 65 in 1980. The effects of study duration and age at start of follow-up in 1980 on sample size are shown in Fig. 4. A young cohort, e.g., children aged 5 in 1980, would eventually accumulate the largest number of CT-induced cancers per cohort member (and hence require the smallest study sample size) because children are more sensitive to radiation carcino-genesis than adults (5, 14). However, this potential would be realized only with very long study duration, through 2020 and beyond, because at earlier termination dates cohort members would not reach the “cancer-prone” age range when most CT-induced (and background) cancers appear (see Fig. 1).
TABLE 1.
Estimated Sample Sizes Required for Population-Based Cohort Studies of Cancer Risks Induced by a Lifetime History of Abdominal or Chest CT Scans
| Cohort age in 1980 | Required sample sizes (in millions) predicted using different radiation carcinogenesis modelsa |
||
|---|---|---|---|
| Model 1 (5) | Model 2 (14) | Model 3 (15) | |
| 0–16 | 2.20 | 1.74 | 2.43 |
| 25–45 | 1.70 | 0.89 | 0.86 |
| 25–55 | 1.39 | 0.80 | 0.54 |
| 25–65 | 1.25 | 0.86 | 0.39 |
| 35–65 | 1.44 | 1.22 | 0.38 |
| 45–65 | 1.10 | 1.15 | 0.25 |
| 0–65 | 2.07 | 1.18 | 1.46 |
The sample sizes represent the numbers of CT-exposed individuals needed to satisfy the statistical criteria of 95% significance and 80% power, while assessing combined risks from ten cancer types accumulated within the cohort from 1980 to 2015 in the UK. Results are shown for the three different radiation carcinogenesis models shown in Fig. 2 [Model 1, BEIR-VII (5); Model 2, Preston et al. (14, 18); Model 3, Shuryak et al. (15)].
FIG. 4.
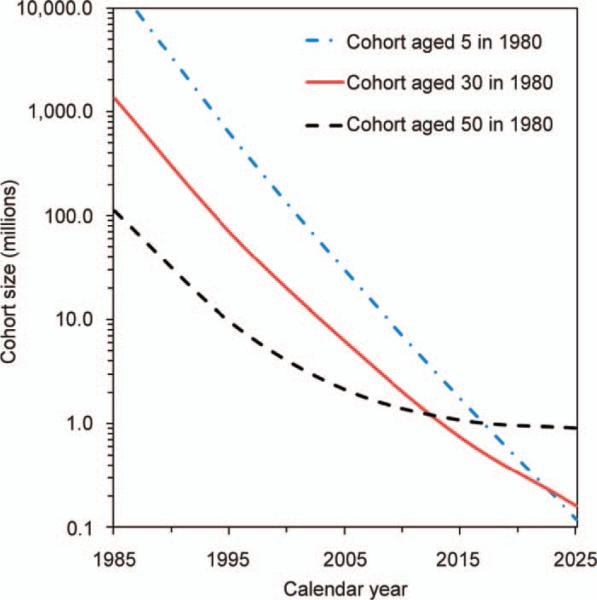
Effects of cohort age and study duration on total numbers of CT-exposed cohort members needed to satisfy the statistical criteria of 95% significance and 80% power for detecting CT-induced cancer risks. The curves were produced from calculations using the Preston et al. model (14, 18) to estimate CT-induced risks from ten cancer types accumulated within a UK cohort beginning in 1980. Qualitatively similar curves were produced if other radiation carcinogenesis models were used.
In contrast, in a cohort of older participants, e.g., members aged 50 in 1980, the “cancer-prone” age range would be reached much earlier. Consequently, the cohort would require the smallest sample size for a study with short duration. Lengthening the study duration would provide only limited additional advantage since a large proportion of the cohort would be deceased by 2010. An intermediate cohort, e.g., members aged 30 in 1980, would require the smallest sample size for a study with an end of follow-up of 2015, because most cohort members would remain alive throughout the follow-up period (1980–2015), while still within the “cancer-prone” age range.
Figure 5 illustrates how cohort members of different ages contribute to the power of a study with a follow-up period of 1980–2015. Older individuals, e.g., those aged >40 in 1980, would provide the greatest contribution to study power per person-year of follow-up. This pattern is again due to the peak of cancer incidence rates in the “cancer-prone” age range. However, many individuals who were aged >40 in 1980 would not survive until 2015, so the average number of person-years contributed by each cohort member would be smaller than for younger individuals.
FIG. 5.
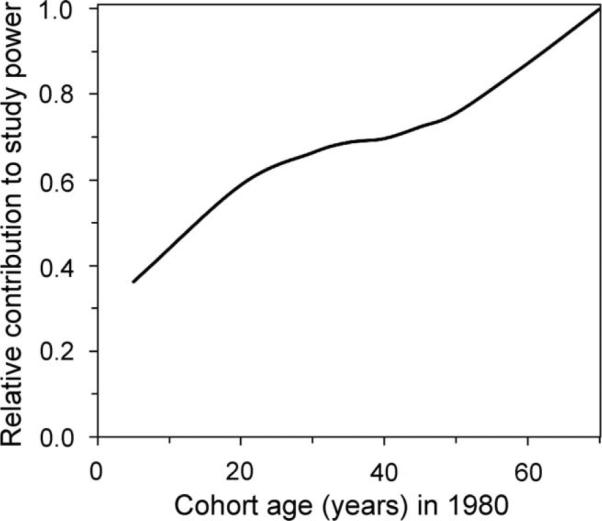
The relative contributions of CT-exposed cohort members of different ages to the power of a hypothetical study designed to measure CT-induced cancer risks. This calculation was based on estimation of combined risks from ten cancer types, which would accumulate (over 10 million person-years of follow-up between 1980 and 2015) within simulated UK cohorts composed of individuals of a specific age in 1980. CT-induced cancer risks were calculated using the Preston et al. model (14, 18), and these risk estimates were used to calculate study power. Qualitatively similar curves were produced if other radiation carcinogenesis models were used.
These calculations suggest that the smallest sample size for a study designed to assess total CT-induced cancer risks with follow-up between 1980 and 2015 would be for a cohort of adults aged roughly 25–65 in 1980 (Table 1, Fig. 6).
FIG. 6.
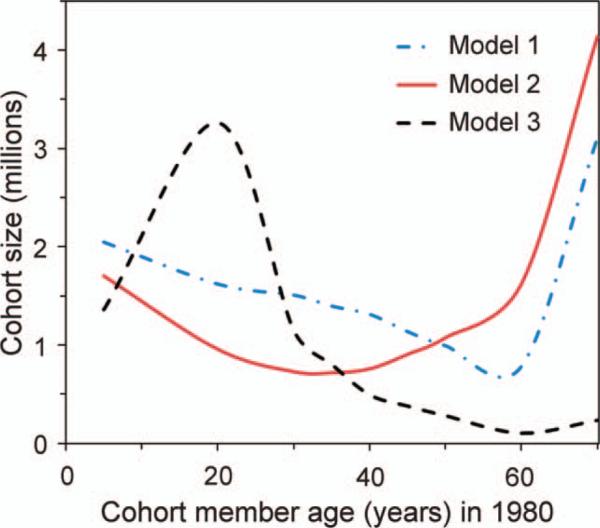
Estimated cohort sizes required for population-based cohort studies of CT-induced cancer risks. The cohort sizes represent the numbers of CT-exposed individuals needed to satisfy the statistical criteria of 95% significance and 80% power for detecting CT-induced cancer risks, while assessing combined risks from ten cancer types accumulated within the cohort from 1980 to 2015 in the UK, calculated using three different radiation carcinogenesis models. Model 1, BEIR-VII (5); Model 2, Preston et al. (14, 18); and Model 3, Shuryak et al. (15). Each cohort was assumed to be composed of individuals of a specific age in 1980.
DISCUSSION
Our results show the statistical feasibility of studying the effects of CT scanning on lifetime cancer risks by tracking CT exposures and cancer incidence rates in a population-based cohort composed largely of adults. For example, if such a study is conducted in the UK using CT exposure and cancer incidence from 1980 until 2015, our calculations suggest that the study would have 80% power to detect an expected CT-induced cancer risk for individuals who were between the ages of 25 and 65 in 1980 (Table 1, Figs. 4–6). The sample size estimates for such adult-based studies depend on the carcinogenesis model (Table 1), but overall they are similar in magnitude to the recent pediatric studies by Pearce et al. (9) and Mathews et al. (10) in the UK and Australia, which used data on approximately 180,000 and 680,000 CT-exposed children, respectively. The required sample sizes are many-fold smaller than the total number of potentially eligible individuals (i.e., those in the selected age range and health status) in the UK, leaving a large margin for sample size inflation caused by loss to follow-up and record incompleteness. This suggests the practicality of conducting a retrospective adult-based cohort study of CT-induced cancer risks in circumstances where accessible health registries exist. Given the dramatic recent increase in radiation exposure associated with CT (16), and given that most CT imaging occurs in adults (11, 16), such a study would have the potential to increase out understanding of the public health significance of this increased usage, in the context of the major clinical gains offered by CT (2)
In the U.S., where CT usage per person-year tends to be higher than in many other developed countries (3, 16), the required sample size for a cohort study of excess cancer risks in CT-exposed adults would be lower than our estimates for the UK. However, the ability to gather required information on CT exposures, cancer diagnoses and deaths from individual patient records may be limited in the U.S.
These calculations are not intended to provide a definitive estimate of CT-induced cancer risks in general. Rather, our results provide an estimate for the magnitude of the sample size which would be needed for an epidemiological study of total cancer risks associated with the radiation exposure from a lifetime of CT scans. Because the comprehensive discussion of the multiple challenges that need to be overcome during the actual design of a cohort study of CT-related cancer risks is beyond the scope of this article, we will focus on a few issues that have particular relevance to the conduct of such a study.
A potentially important problem faced by any cohort study of cancer risks associated with diagnostic radiation is that of reverse causation (19, 20). An example would be a patient that has an undiagnosed cancer or precancerous condition that causes symptoms warranting a CT examination, then the assignment of the relevant dose that may be causally linked to the cancer becomes problematic. A related issue, which can potentially distort CT-associated cancer risks, is when the patient has a medical condition that increases both the probability of having a CT scan and of developing cancer. Such scenarios are potentially relevant in CT scans and brain tumors (19), one possible example might be epilepsy resulting in an increased risk of accidents (21), which in turn is linked with increased numbers of CT scans, while epilepsy itself has been linked with brain tumors (22).
A rigorous method for minimizing the potential impact of reverse causation and related issues on CT-associated cancer risks would be to access patient-specific information on the reasons for particular CT scans (23). However, even in the absence of such information, a number of steps can be taken to minimize their potential influence, in particular:
Exclude from the analysis those CT scans that have been performed in association with cancer (e.g., for diagnostics, treatment planning, treatment control), as we have done in our simulation (see Methods section). This was done in our in silico analysis and can generally be achieved in practice based on information in the analyzed database.
Remove from the analysis those cancer sites that are considered potentially prone to such effects (such as the head, which was excluded from our in silico analysis).
Perform different time lag analyses of, e.g., 1, 5 and 10 years between CT exposure and cancer diagnosis. Considering typical rates of progression for the 10 cancer types we selected, many of which are quite aggressive, a lag of 5 or 10 years will minimize potential effect of reverse causation.
Focus on dose-response relations, which are less likely to be affected by reverse causation. In general, conditions which can increase both CT usage and cancer risk should not impact the radiation dose response. For example, an analysis of the Michael Reese Hospital cohort (24) demonstrated that CT screening increased the number of thyroid cancer cases that were identified, but it had no effect on the dose response. An even clearer picture would be produced by disentangling the correlation between CT scan number and cumulative radiation dose, e.g., by comparing cancer risks in individuals exposed to different numbers of CT scans, but with accumulation of the same total radiation dose. Such an approach should minimize the effect of potential confounding factors, which may be associated with having multiple CT scans.
In conclusion, the study sample sizes produced by our calculations should be regarded only as reasonable approximations. Nevertheless, these numbers provide quantitative support for conducting future epidemiological studies of excess cancer risks in CT-exposed adults. Such studies can potentially provide direct evidence of the public health burden of excess cancer risks in populations exposed to diagnostic CT scanning, and help facilitate benefit-risk analyses for many CT modalities.
ACKNOWLEDGMENTS
Jay H. Lubin was supported by the Intramural Research Program of the National Institutes of Health, National Cancer Institute, Division of Cancer Epidemiology and Genetics. Igor Shuryak and David J. Brenner were supported by the NIAID grant U19-AI67773.
APPENDIX
Following the BEIR-VII methodology (5), cumulative radiation-induced excess risks for each of the ten selected cancers were calculated in terms of both absolute and relative risk functions: EAR(S, Tx, A) and ERR(S, Tx, A), respectively. Here S denotes sex, Tx is age at exposure and A is age. The functions EAR(S, Tx, A) and ERR(S, Tx, A) are derived mainly from data on Japanese atomic bomb survivors, and are the functions that differ between the three radiation carcinogenesis models (5, 14, 15) described in the text (see Fig. 2). They were evaluated using the average organ dose D(Tx) from chest and abdominal CT scans for adults or children (17), divided by a dose/dose-rate effectiveness factor of 1.5 (5), and using sex- and cancer-specific adjustable parameters. The mathematical expressions for these functions are provided in Table A1.
CT-induced risks in a Western population, Rw(S), were calculated according to BEIR-VII methodology, where p is a cancer-specific risk transfer parameter (5):
| (1) |
All of this information was used by the Monte Carlo simulation code to generate a cohort of individuals unexposed to CT and cancer-free within a certain age range (e.g., 25–65) at the start of the study in 1980, and track each individual year-by-year, applying age-, sex- and calendar-year-specific probabilities of chest and abdominal CT exposure, cancer diagnosis and death. The simulation results were used to generate an age-dependent distribution of cancer cases and CT-exposed person-years. This was performed first under the null hypothesis of radiation having no effect on cancer incidence, so that the incidence rate Rw(S) was defined as r2. Then the same calculation was repeated under the alternative hypothesis of radiation affecting cancer incidence so that the incidence rate Rw(S) was defined as r1.To compare these rates, we assumed that the numbers of cancer cases are Poisson-distributed, and applied the square root transformation. Under the null hypothesis, the number of cancer cases is approximately normally distributed with mean (r2 τ N)½ and standard deviation ½, where the parameter τ represents the average number of person-years contributed by each CT-exposed cohort member after the first CT exposure, and N is the study sample size. Under the alternative hypothesis, the mean is (r1 τ N)½, and the standard deviation is ½. The equations specifying Type I and Type II errors (α and β, respectively) are the following:
| (2) |
These equations were solved by specifying α = 0.05 (i.e., 95% significance) and β = 0.2 (i.e., 80% power), and substituting values for r1, r2 and τ from the in silico simulation results. The sample size estimates were similar to those calculated using formula 7.1 in ref. (25).
TABLE A1.
Mathematical Formalisms Used to Quantify CT-Induced Cancer Risks
| Model no. | Cancer | Risk type | Equations for radiation-induced cancer risk |
|---|---|---|---|
| Model 1 | Solid | EAR, ERR | β D(Tx) exp[γ min(0, Tx/10 – 3)] (A/60)n |
| Leukemia | EAR, ERR | β D(Tx)[1 + θ D(Tx)] exp[γ min(0, Tx/10 – 3) – δ ln[(A – Tx)/25] – ϕ ln[(A – Tx)/25] min(0, Tx/10 – 3)] | |
| Model 2 | Solid | EAR, ERR | β D(Tx) exp[γ (Tx/10 – 3)] (A/70)n |
| Leukemia | EAR | (k1 D(Tx) + k2 D(Tx)2)(A/70)k3 (Tx/30)k4 | |
| ERR | (k1 D(Tx) + k2 D(Tx)2)(A/70)k3 ([A – Tx]/40)k4 | ||
| Model 3 | Solid | constants | W1 = a/b (exp[b A] – 1) exp[–c A2], W2 = [1 + Y D(Tx)] [exp[b Tx] – 1 + bX D(Tx)] exp[b (A - Tx)], W3 = 1 + Y D(Tx) (1 – exp[–δ (A – Tx)]) |
| EAR | a/b exp[–c A2](W2/W3 + exp[b (A – Tx)] – 1) – W1 | ||
| ERR | W1 [(W2/W3 + exp[b (A – Tx)] – 1)/(exp[b A] – 1) – 1] |
Notes. The three different radiation carcinogenesis models are: Model 1, BEIR-VII (5); Model 2, Preston et al. (14, 18); Model 3, Shuryak et al. (15). Tx is age at exposure, A is attained age, and D(Tx) is the average organ dose from chest and abdominal CT scans for adults or children. The adjustable parameters in each model are sex- and cancer type-specific. EAR is excess absolute risk and ERR is excess relative risk. Details are described in the Appendix.
REFERENCES
- 1.Brenner DJ, Hall EJ. Computed tomography–an increasing source of radiation exposure. N Engl J Med. 2007;357:2277–84. doi: 10.1056/NEJMra072149. [DOI] [PubMed] [Google Scholar]
- 2.Hricak H, Brenner DJ, Adelstein SJ, Frush DP, Hall EJ, Howell RW, et al. Managing radiation use in medical imaging: a multifaceted challenge. Radiology. 2011;258:889–905. doi: 10.1148/radiol.10101157. [DOI] [PubMed] [Google Scholar]
- 3.Sodickson A, Baeyens PF, Andriole KP, Prevedello LM, Nawfel RD, Hanson R, et al. Recurrent CT, cumulative radiation exposure, and associated radiation-induced cancer risks from CT of adults. Radiology. 2009;251:175–84. doi: 10.1148/radiol.2511081296. [DOI] [PubMed] [Google Scholar]
- 4.Hansen J, Jurik AG. Analysis of current practice of ct examinations. Acta Oncol. 2009;48:295–301. doi: 10.1080/02841860802266714. [DOI] [PubMed] [Google Scholar]
- 5.Health risks from exposure to low levels of ionizing radiation: BEIR VII phase 2. National Academies Press; National Research Council (U.S.); Washington, D.C.: 2006. Committee to Assess Health Risks from Exposure to Low Level of Ionizing Radiation. [PubMed] [Google Scholar]
- 6.Brenner DJ, Elliston CD, Hall EJ, Berdon WE. Estimated risks of radiation-induced fatal cancer from pediatric CT. AJR Am J Roentgenol. 2001;176:289–96. doi: 10.2214/ajr.176.2.1760289. [DOI] [PubMed] [Google Scholar]
- 7.Brenner DJ. Slowing the increase in the population dose resulting from CT scans. Radiat Res. 2010;174:809–15. doi: 10.1667/RR1859.1. [DOI] [PubMed] [Google Scholar]
- 8.Einstein AJ. Beyond the bombs: cancer risks of low-dose medical radiation. Lancet. 2012;380:455–7. doi: 10.1016/S0140-6736(12)60897-6. [DOI] [PMC free article] [PubMed] [Google Scholar]
- 9.Pearce MS, Salotti JA, Little MP, McHugh K, Lee C, Kim KP, et al. Radiation exposure from CT scans in childhood and subsequent risk of leukaemia and brain tumours: a retrospective cohort study. Lancet. 2012;380:499–505. doi: 10.1016/S0140-6736(12)60815-0. [DOI] [PMC free article] [PubMed] [Google Scholar]
- 10.Mathews JD, Forsythe AV, Brady Z, Butler MW, Goergen SK, Byrnes GB, et al. Cancer risk in 680,000 people exposed to computed tomography scans in childhood or adolescence: data linkage study of 11 million Australians. BMJ. 2013;346:f2360. doi: 10.1136/bmj.f2360. [DOI] [PMC free article] [PubMed] [Google Scholar]
- 11.Berrington de Gonzalez A, Mahesh M, Kim KP, Bhargavan M, Lewis R, Mettler F, et al. Projected cancer risks from computed tomographic scans performed in the United States in 2007. Arch Intern Med 2009. 169:2071–7. doi: 10.1001/archinternmed.2009.440. [DOI] [PMC free article] [PubMed] [Google Scholar]
- 12.Berrington de Gonzalez A, Kim KP, Knudsen AB, Lansdorp-Vogelaar I, Rutter CM, Smith-Bindman R, et al. Radiation-related cancer risks from CT colonography screening: a risk-benefit analysis. AJR Am J Roentgenol. 2011;196:816–23. doi: 10.2214/AJR.10.4907. [DOI] [PMC free article] [PubMed] [Google Scholar]
- 13.Woo JK, Chiu RY, Thakur Y, Mayo JR. Risk-benefit analysis of pulmonary CT angiography in patients with suspected pulmonary embolus. AJR Am J Roentgenol. 2012;198:1332–9. doi: 10.2214/AJR.10.6329. [DOI] [PubMed] [Google Scholar]
- 14.Preston DL, Ron E, Tokuoka S, Funamoto S, Nishi N, Soda M, et al. Solid cancer incidence in atomic bomb survivors: 1958–1998. Radiat Res 2007. 168:1–64. doi: 10.1667/RR0763.1. [DOI] [PubMed] [Google Scholar]
- 15.Shuryak I, Sachs RK, Brenner DJ. Cancer risks after radiation exposure in middle age. J Natl Cancer Inst. 2010;102:1628–36. doi: 10.1093/jnci/djq346. [DOI] [PMC free article] [PubMed] [Google Scholar]
- 16.Mettler FA, Jr, Thomadsen BR, Bhargavan M, Gilley DB, Gray JE, Lipoti JA, et al. Medical radiation exposure in the U.S. in 2006: preliminary results. Health Phys 2008. 95:502–7. doi: 10.1097/01.HP.0000326333.42287.a2. [DOI] [PubMed] [Google Scholar]
- 17.Fujii K, Aoyama T, Koyama S, Kawaura C. Comparative evaluation of organ and effective doses for paediatric patients with those for adults in chest and abdominal CT examinations. Br J Radiol. 2007;80:657–67. doi: 10.1259/bjr/97260522. [DOI] [PubMed] [Google Scholar]
- 18.Hsu WL, Preston DL, Soda M, Sugiyama H, Funamoto S, Kodama K, et al. The incidence of leukemia, lymphoma and multiple myeloma among atomic bomb survivors: 1950–2001. Radiat Res 2013. 179:361–82. doi: 10.1667/RR2892.1. [DOI] [PMC free article] [PubMed] [Google Scholar]
- 19.Scientific Annex B. Effects of radiation exposure of children. UNSCEAR; New York: 2013. Sources, effects and risks of ionizing radiation. Vol. II. [Google Scholar]
- 20.Boice Jr JD. Implications of radiation dose and exposed populations on radiation protection in the 21st century. Health Phys. 2014;106:313–28. doi: 10.1097/HP.0000000000000024. [DOI] [PubMed] [Google Scholar]
- 21.Nguyen R, Zenteno JFT. Injuries in epilepsy: a review of its prevalence, risk factors, type of injuries and prevention. Neurol Int. 2009;1:e20. doi: 10.4081/ni.2009.e20. [DOI] [PMC free article] [PubMed] [Google Scholar]
- 22.Olsen JH, Boice JD, Jensen JP, Fraumeni JF. Cancer among epileptic patients exposed to anticonvulsant drugs. J Natl Cancer Inst. 1989;81:803–09. doi: 10.1093/jnci/81.10.803. [DOI] [PubMed] [Google Scholar]
- 23.Berdahl CT, Vermeulen MJ, Larson DB, Schull MJ. Emergency department computed tomography utilization in the United States and Canada. Ann Emerg Med. 2013;62:486–494. doi: 10.1016/j.annemergmed.2013.02.018. [DOI] [PubMed] [Google Scholar]
- 24.Bucci A, Shore-Freedman E, Gierlowski T, Mihailescu D, Ron E, Schneider AB. Behavior of small thyroid cancers found by screening radiation-exposed individuals. J Clin Endocrinol Metab. 2001;86:3711–16. doi: 10.1210/jcem.86.8.7742. [DOI] [PubMed] [Google Scholar]
- 25.Breslow NE, Day NE. Statistical methods in cancer research. IARC Workshop 25–27 May 1983. IARC Sci Publ. 1987:1–406. [PubMed] [Google Scholar]