

Summary
Longevity of a p66Shc knockout strain (ShcP) was previously attributed to increased stress resistance and altered mitochondria. Microarrays of ShcP tissues indicated alterations in insulin signaling. Consistent with this observation, ShcP mice were more insulin sensitive and glucose tolerant at organismal and tissue levels, as was a novel p66Shc knockout (ShcL). Increasing and decreasing Shc expression in cell lines decreased and increased insulin sensitivity, respectively – consistent with p66Shc's function as a repressor of insulin signaling. However, differences between the two p66Shc knockout strains were also observed. ShcL mice were fatter and susceptible to fatty diets, and their fat was more insulin sensitive than controls. On the other hand, ShcP mice were leaner and resisted fatty diets, and their adipose was less insulin sensitive than controls. ShcL and ShcP strains are both highly inbred on the C57Bl/6 background, so we investigated gene expression at the Shc locus, which encodes three isoforms, p66, p52, and p46. Isoform p66 is absent in both strains; thus, the remaining difference to which to attribute the ‘lean’ phenotype is expression of the other two isoforms. ShcL mice have a precise deletion of p66Shc and normal expression of p52 and p46Shc isoforms in all tissues; thus, a simple deletion of p66Shc results in a ‘fat’ phenotype. However, ShcP mice in addition to p66Shc deletion have a fourfold increase in p46Shc expression in white fat. Thus, p46Shc overexpression in fat, rather than p66Shc deletion, is the likely cause of decreased adiposity and reduced insulin sensitivity in the fat of ShcP mice, which has implications for the longevity of the strain.
Keywords: adiposity, insulin/IGF-1, knockout, mouse, p66Shc, signal transduction
Introduction
Insulin signaling and longevity
Genetic studies of lifespan across several species have identified mutations in the insulin/IGF-1 pathway as a common cause of longevity in Mus. musculus, Drosophila melanogaster, and Caenorhabditis elegans (Barbieri et al., 2003; Bluher et al., 2003; Ayyadevara et al., 2008; Bartke, 2008b; Selman et al., 2008). In mice, mutations that occur at several steps of the insulin/IGF-1 pathway increase longevity and usually result in dwarf mice (Bartke & Brown-Borg, 2004). Thus, mutations in long-lived prop-1 and pit-1 mice (Flurkey et al., 2001; Hsieh et al., 2002a) cause defects in the development of hypophysis, leading to defects in the production of GH, prolactin, and TSH in mice, which is responded to by somatotrophs. Lifespan extension occurs in multiple small mice including in Igf1r+/− mice (Holzenberger et al. 2003), GH-deficient ‘Little’ and ‘Midi’, and mice with reduced local (tissue) availability of IGF-1 – PAPP-A−/−. Improvement in insulin sensitivity and glucose tolerance is also a common feature of most of the longevity mutants. For example, mutation in growth hormone receptor extends lifespan, increases body insulin sensitivity, increases food intake, and decreases adiposity in GHR−/− mice (Coschigano et al., 2003), and tissue insulin sensitivity is also improved in Aims and Snell dwarfs, GHRKO, FIRKO, and calorie-restricted mice (Bartke, 2006, 2008a).
The Shc locus and longevity: oxidative stress, mitochondria, and apoptosis
The mammalian Shc locus encodes three adaptor proteins – p66Shc, p46Shc, and p52Shc (Pelicci et al., 1992) – which transmit hormonal signals in cells (Migliaccio et al., 1997). It was reported that cells from long-lived ShcP knockout mice resist oxidative stress (Migliaccio et al., 1999) and that the longevity of ShcP mice has been attributed to oxidative stress resistance and changes in mitochondrial biogenesis (Trinei et al., 2009) and the role of p66Shc in mitochondrial apoptosis process (Giorgio et al., 2005). However,asShc proteins are also implicatedin in sulin/IGF-1 and other receptor tyrosine kinases signaling (Pelicci et al., 1992; Saucier et al., 2004; Laviola et al., 2007; Neumann-Haefelin et al., 2008), mutations at Shc locus could influence the insulin/IGF-1 pathway that has been demonstrated to be critical in longevity. ShcP mice weigh less than littermate controls, and the difference is mainly because of significantly reduced fat mass (current study and Berniakovich et al., 2008).
We undertook a microarray study of ShcP tissues to identify the primary consequences of p66Shc deficiency and identified several alterations in insulin-related transcripts. We functionally characterized insulin signaling in ShcP mice and a novel ShcL knockout line that only recently became available. We also compared body composition, resistance to fatty diets, and insulin signaling in tissues of the two strains. The results support the idea that p66Shc is an inhibitor of insulin signaling at the organismal and cellular level and that p46Shc overexpression in the fat of ShcP mice desensitizes their adipose to insulin. Thus, ShcP mice have increased body insulin sensitivity and increased tissue insulin sensitivity, similar to the long-lived hypopituitary dwarfs and GHRKO, and IGF-1-deficient mice. By contrast, fat tissue of ShcP mice is desensitized to insulin and reduced in size as in the FIRKO model. These results suggest that Shc-dependent longevity is mediated through the role of Shc proteins on insulin/IGF1 signaling.
Methods
Animals
ShcP mice have been described previously by Migliaccio et al. (1999). Pure ShcL mice were generated by the Tomas Prolla group in 2007. Mice were kept pathogen-free throughout the study on barrier facility at UC Davis. All experimental procedures were approved by the Institutional Animal Care and Use Committee (IACUC) and were performed in compliance with local, state, and federal regulations. Mice used for this study were 3–5 months old, unless different age is indicated, and were age matched for each experiment. For all of the studies, the mice were kept on the LM-485 diet (Teklad 7012). The moderate-fat diet was the AIN-93G diet (Teklad TD.94045); the high-fat diet was AIN-93G based, with 60% of fat and 7.3% of carbohydrates. The protein-derived calories in high-fat and moderate-fat diets were the same. The nutrient compositions of the diets were as follows: AIN-93G (protein = 17.7%, carbohydrates = 60.1%, fat = 7.2%), high-fat diet (protein = 17.7%, carbohydrates = 7.3%, fat = 60.0%), and LM-485 (protein = 19.9%, carbohydrates = 53.7%, fat = 5.7%). The primary source of lipid was soybean oil for both diets, the primary protein source was casein for AIN-93G or soybean meal for LM-485, and the primary energy source was corn starch for AIN-93G and ground corn and ground oats for the LM-485 diet. The insulin signaling in tissues was investigated on mice maintained on the LM-485 diet, and the fat tissue insulin sensitivity assay was performed on mice maintained on the AIN-93G diet.
Materials and antibodies
Media DMEM and F12-B, minimal essential medium amino acids, penicillin/streptomycin, and fetal bovine serum were purchased from GIBCO (Grand Island, NY, USA) and Invitrogen Life Technologies (Carlsbad, CA, USA). BSA fraction V, HEPES, and insulin were from Sigma (St Louis, MO, USA). Collagen (Vitrogen 100) was purchased from Cohesion Technologies (Palo Alto, CA, USA). All antibodies were from Cell Signaling Inc. (Danvers, MA, USA) with exceptions: rabbit anti-Shc antibody was from BD Biosciences (San Diego, CA, USA), the rabbit polyclonal anti-phospho(tyr 941)-IRS1, activatory phosphorylation was from Novus Biologicals (Littletown, CO, USA), anti-tubulin from Sigma, the secondary infrared dye 700- and 800-labeled antibody was from Li-Cor Biosciences (Lincoln, NE, USA). The si-RNA for the specific knockdown of p66Shc was described by Kisielow et al. (2002). The si-RNA for silencing of all Shc isoforms and control siRNA (AllStar) was purchased from Qiagen (Valencia, CA, USA). The plasmids p66Shc::GFP and p46Shc::GFP fusions were pcDNA based and were constructed in our laboratory by standard procedures. Insulin was from bovine pancreases and was purchased from Sigma.
Microarray
Muscles, liver, spleen, lungs, fat, and peritoneal macrophages of 3-month-old males and 12-month-old males and females of ShcP and control mice were microarrayed using Affymetrix platform. Total RNA was extracted from individual age- and sex-matched mouse using TRIzol reagent according to the manufacturer's instructions (Invitrogen) and purified using RNeasy mini kit (Qiagen). Muscles, liver, spleen, lungs, epididymal fat, and peritoneal macrophages were microarrayed at 3 months of age, and liver, retroperitoneal fat, and spleen at 12 months of age. Two mutants and two control mice were used for each experiment; for muscle tissue, three mutants and three controls were used. Totally, 22 samples from mutant mice and 22 samples from control mice tissues were used. First and second strand of cDNA were generated using One-Cycle cDNA Synthesis kit (Affymetrix, Santa Clara, CA, USA), labeled cRNAs were synthesized using Gene Chip IVT Labeling System (Affymetrix), fragmented and hybridized to the Mouse Genome 430 2.0 Arrays (Affymetrix) according to manufacturer's instructions. Resulted CEL files were analyzed for each group of tissue individually using dChip (DNA chip analyzer) software (Schadt et al., 2001). Top 1000 up regulated and top 1000 downregulated transcripts generated from each tissue dataset were organized into a megatable that includes all tissues (p-value < 0.05). Lists of top 500 upregulated and 500 downregulated through genes of different tissues were analyzed using Onto-Tool: Pathway Express (Draghici et al., 2007). Updated annotations were obtained from the NetAffx database and multi-sample analysis performed by combining the dChip lists using Excel. Probesets with a pCall > 20% and p < 0.05 were considered significantly altered.
Western blotting
Total protein was isolated using cell lysis buffer (Cell Signaling Technologies), containing 20 mM Tris–HCl (pH 7.5), 150 mM NaCl, 1 mM Na2EDTA, 1 mM EGTA, 1% Triton, 2.5 mM sodium pyrophosphate, 1 mM β-glycerophosphate, 1 mM Na3VO4, 1 μg mL−1 leupeptin, 1 mM phenylmethanesulfonyl fluoride and additionally supplemented with Complete Mini Protease Inhibitor Cocktail and PhosStop Phosphatase Inhibitor Cocktail (Roche, ndianapolis, IN, USA). Forty micrograms of protein per line, as determined by Bradford assay (BioRad Laboratories, Hercules, CA, USA) was resolved by SDS–PAGE, transferred to nitrocellulose membrane, blocked with Odyssey Blocking Buffer (Li-Cor Bio-sciences, Lincoln, NE) and hybridized with indicated primary antibody followed by development with infrared IR-dye 700CW-and/or 800CW-labeled secondary antibodies (Li-Cor Biosciences). Blots were scanned on Li-cor Odyssey infrared imaging instrument and quantified using Odyssey 2.1 software (Li-Cor Biosciences). Use of different IR-dyes-labeled secondary antibodies allowed the measurement of the level of housekeeping proteins at the same time as the proteins of interest on the same membrane and improved the accuracy of quantification and normalization.
Tissue insulin sensitivity assays
Mice were fasted for 6 h and after anesthesia with 100 mg kg−1 of pentobarbital, insulin (3 mU g−1 of body weight) was injected through the inferior vena cava. Biopsies of muscles, liver and fat were collected at different time points as indicated, and proteins were analyzed using Western blotting with phospho-specific and total protein-specific antibody against different members of nsulin-signaling cascade.
Glucose uptake by cultured adipocytes
Assays were performed similarly as described (Mueller et al., 1998; Perez-Matute et al., 2005). Briefly, mice were sacrificed by cervical dislocation and epididymal fat was extracted, minced with sterile scalpel to 1-mm2 pieces and treated with 5 mL of collagenase (0.63 mg mL−1) per 1 g of fat tissue for 30 min at 37°C with gentle agitation. At the end of collagenase digestion, suspensions were diluted with 15 mL of DMEM, strained through 250-μm mesh, and centrifuged at 600 g for 10 min. Precipitate and the liquid were removed from under the fat layer, cells were diluted once again with 15 mL of DMEM, and centrifugation repeated. Liquid from under the fat cells was removed, and cells were diluted with 10 mL of fresh DMEM and allowed to stand for 15 min in 5% CO2 incubator at 37°C. After centrifugation at 600 g and removal of all of the media from under the fat cells, 100 μL of adipocyte suspension was mixed with 150 μL of collagen/50 μL DMEM mixture and was allowed to set for 15 min on six-well plates in the tissue culture incubator. Three-dimensional collagen cultures of adipocytes were overlaid with 3 mL of fresh DMEM supplemented with indicated amounts of glucose and growth-factors-free serum. Cells were induced with insulin at indicated concentration, PBS served as mock induction, aliquots of media were collected every 24 h and glucose concentration determined. Glucose consumption over the period of 96 h was calculated. The three-dimensional collaged cultures were pictured after staining with Oil-Red-O and cell numbers/cell densities compared. ShcP and ControlP adipocyte cultures have similar number of cells (data not shown).
Insulin signaling in FL83B cells
Mouse liver cells FL83B were transfected using Lipofectamine 2000 (Invitrogen) according to manufacturer's instructions. For the insulin-signaling cascade activation, 48 h after transfection, serum was depleted, and after 24 h, cells were induced with indicated concentration of insulin for 10 min. Blots were probed with indicated antibody.
Glucose production by FL83B mouse liver cell line
Cells were transfected as described previously, 48 h after transfection media was replaced with serum-free, glucose-free media supplemented with 20 mM lactate. Insulin-inhibitable glucose release was assayed similarly as described (Yoon et al., 2001; Li et al., 2007). Efficiency of knockdown was assayed by Western blots with anti-Shc antibody.
Insulin and glucose tolerance tests
Mice were fasted for 6 h and given intraperitoneal injection of insulin: 0.2 U kg−1 of body weight for the 3-month-old mice and 0.5 U kg−1 of body weight for 12-month-old mice. Blood samples were analyzed on glucose concentration. Each group includes 10 male animals. The same groups of animals were used in the glucose tolerance test where mice were given the intraperitoneal injection of glucose (2 g kg−1 of body weight) after 16 h of fasting. Analogously, the blood glucose was measured. Euglycemic–hyperinsulinemic clamps were performed according to standard procedures. Insulin was infused at the rate 2 mU kg−1 per min, and glycemia was maintained at 200 mg dL−1. Number of ControlP animals was five males and ShcP – six males.
Glycogen content of muscles
From ShcP and ControlP mice measured enzymatically as described in Glycogen Keppler & Decker (1984). Briefly, muscle samples were homogenized in cold perchloric acid, and part of this homogenate was used for glycogen hydrolysis and the other part for glucose concentration. The glycogen hydrolysis part gave total glucose content (free glucose in the tissue and that coming from glycogen hydrolysis) while the glucose assay gave the free glucose in the tissue. The total glucose minus the free glucose gave the amount of glycogen in the tissue, which is expressed as umol glycosyl units per gram wet weight.
Results
ShcP mice have alterations in the expression of insulin-related transcripts
To identify mechanisms of p66Shc-dependent longevity, we microarrayed RNA from muscles, liver, spleen, lungs, fat, and peritoneal macrophages of 3-month-old males and 12-month-old males and females of ShcP and control mice. The microarray of different tissues was performed essentially as described by Tomilov et al. (2009), but in the current study, the number of analyzed animals was increased to 22 mutants and 22 age- and sex-matched controls. Microarray was performed using Affymetrix platform followed by the analysis of gene expression data using dChip (Schadt et al., 2001). The top five pathways altered in all tissues were identified using Onto-Tool: Pathway Express (Draghici et al., 2007), filtered at p-value of 0.005 and impact factor more than 14, and shown in Fig. 1. The goal of this microarray study was not to dissect the age-related changes in the mice but to identify the most consistently changed pathways through all of the analyzed tissues and in both ages used. PI3K and insulin signaling were among the top five of the list of significantly altered pathways. This result was not completely surprising because Shc proteins are adaptors, which directly interact with receptor tyrosine kinases (RTK), activating Shc/Ras/ERK pathway, such as IGF-1 receptor (Laviola et al., 2007), insulin receptor (IR), and EGF receptor (Pelicci et al., 1992; Lotti et al., 1996; Migliaccio et al., 1997; Laviola et al., 2006).
Fig. 1.

ShcP mice have altered insulin-signaling pathways and increased insulin and glucose tolerance. (a) Five hundred top upregulated and five hundred top downregulated genes in different tissues of ShcP KO strain were compared by Onto-Express versus GO database. Resulted list of altered pathways was sorted by ‘Impact Factor’ and the top five presented. (b) For the insulin tolerance test (ITT), ShcP KO mice were challenged with IP injection of insulin at indicated concentration and age of mice. Glucose was measured in blood samples at indicated time points. (c) For the glucose tolerance test (GTT), mice were challenged with injections of glucose. Analogously, concentration of glucose was measured in blood. Ten ControlP and ten ShcP males were used for ITT/GTT experiments. *significant difference, which is p < 0.05 and F > F crit. as obtained by repeated-measurements ANOVA. (d, e) Hyperinsulinemic–euglycemic clamp test on five 3-month-old ControlP and six ShcP male mice. In d, *means p < 0.01, and in e, *means p < 0.05.
ShcP mice are more insulin sensitive and glucose tolerant at the organismal level
Given the alterations observed in insulin-related transcripts, insulin tolerance and glucose tolerance were analyzed. In vivo, ShcP were more insulin-sensitive and glucose tolerant than wild-type controls (Fig. 1b,c). Baseline blood glucose concentration was similar in ShcP and control animals. After insulin injection, the concentration of blood glucose in ShcP mice decreased faster and to lower levels than in control mice given the same dose of insulin. As analyzed by repeated-measurements ANOVA, the p-value at basal (0 min) was 5.8E–01, and p-values at 15, 30, 60, and 120 min after insulin injection were 2.7E–07, 9.0E–15, 4.5E–22, 1.3E–21, respectively. In older animals, the trend was similar, but the difference was not statistically significant. Also, after equal doses of glucose injection, young and old ShcP mice were more glucose tolerant. Statistical analysis was carried out using repeated-measurements ANOVA. For young animals, p-values were 2.7E–01 at the basal level (0 min) and 1.9E–15, 6.8E–25, 2.2E–14, and 3.0E–02 at 15, 30, 60, and 120 min after glucose injection, respectively [*significant difference, which is p < 0.05 and F > F crit]. The increased glucose tolerance and insulin sensitivity could result from increased peripheral tissue sensitivity to insulin or increased pancreatic insulin production. To further address this question, we performed a hyperinsulinemic–euglycemic clamp study. The increase in glycemia upon systemic glucose administration was significantly lower in the ShcP mice during euglycemic– hyperinsulinemic clamps. The glucose uptake needed to maintain a constant glycemia (approximately 200 mg dL−1) after continuous infusion of insulin (2 mU kg−1 per min) was higher in the ShcP mice (Fig. 1d,e) [*significant difference as determined by repeated-measurements ANOVA (p-value < 0.05)]. These data indicated that glucose tolerance and insulin sensitization of ShcP mice were the result of increased peripheral insulin sensitivity and not insulin synthesis. Increased insulin sensitivity and glucose tolerance of ShcP mice were also demonstrated recently when ShcP mice were put on the Ob/Ob background (Ranieri et al., 2010).
ShcP and ShcL mice have increased insulin sensitivity in muscle and liver tissues
Muscle and liver are the two most important insulin-sensitive tissues, and insulin sensitivity of muscle and liver was investigated in two independently constructed knockout lines, ShcP and ShcL. Mice were injected with insulin via inferior vena cava, and biopsies of different tissues were collected as described in Methods section. Western blots were performed using antibodies to total and phosphoproteins in the insulin-signaling pathways, as indicated. Tissues from both mutant strains were more insulin-sensitive in vivo, and both had stronger insulin-dependent activation of the insulin receptor substrate (IRS1), PI3-K, Akt, and ERK than controls with the identical dose of insulin at multiple time points (Fig. 2a,b,d). Increased activation of glycogen synthase in muscles of ShcP was also observed (data not shown). The densitometries of multiple time-course Western blots performed on ShcP mice are presented in Fig. 2b,d. Repeated-measurements one-way ANOVA was used to analyze the differences in the activation of Akt in muscles and liver of ShcP mice. At 40 and 90 s after insulin injection, in muscles, pAkt levels were not different between ShcP and ControlP mice; however, at 200 and 300 s time points, pAkt levels become significantly higher in ShcP mice muscles (p-value 2.0E–3 and 7.8E–5, respectively). In the liver of ShcP mice, pAkt levels were higher at 90 and 200 s with p-values 1.9E–1 and 8.9E–3, respectively. Consistent with increased insulin sensitivity, muscle tissue of the ShcP mice had higher glycogen content (Fig. 2c). In fasted state, ShcP mice had higher glycogen content in the muscles when compared to ControlP mice, p < 0.003; under feed conditions, the trend was the same, but the difference was not significant. ShcP mice tissues were more sensitized to insulin toward P-Akt and less toward P-ERK, whereas ShcL mice demonstrated less sensitization of P-Akt and more toward ERK activation by insulin (Fig. 2a). The results suggest that p66Shc inhibits the insulin pathway. An inhibitory effect of p66Shc on glucose uptake and activation of ERK by insulin has been recently shown in vitro for L6 myoblasts (Natalicchio et al., 2009), for smooth muscle cells (Xi et al., 2008), and in fat (Ranieri et al., 2010).
Fig. 2.

Tissue insulin sensitivity is increased in ShcP and ShcL mice. (a) Biopsies of muscle tissue were collected within time-course starting at 0 and ending at 300 s from ShcP, ShcL, and wild-type mice as described after insulin injection via inferior vena cava. Proteins were extracted and analyzed using Western blot with indicated antibody. At least ten animals of each ControlP, ControlL, ShcP, and ShcL genotype were used for similar Western blots, which were technically repeated at least two times. (b) Graph shows densitometry results of Western blots for dynamic insulin-induced Akt phosphorylation in the muscles of ShcP mice. In that particular experiment, from which the graphs were generated, blots at 200-s time point were technically reproduced twice; at 40, 90, and 300 s, once. Error bars are standard deviations of six ControlP and six ShcP mice. The p-values of comparisons of Akt activation in ShcP and ControlP mice were generated by repeated-measurements one-way ANOVA and indicated in the graph. (c) Glycogen content of muscles from ShcP and ControlP mice measured enzymatically. Three ControlP and three ShcP mice per group were used, error bars are standard deviations, and p-values are indicated. (d) Densitometry results of insulin-induced Akt activation in the liver of ShcP mice, carried out analogously as described for muscle tissue. (e) Western blot analysis of protein extracts from FL83B cells transfected with indicated si-RNA. (f) Serum was overnight deprived from transfected cells and then media was supplemented with indicated concentrations of insulin. Ten minutes later, the cells were washed with ice-cold PBS and lysed. Cell lysates were analyzed using Western blot with indicated antibody. Two independent transfection experiments were performed for each transfection, and the blots were reproduced twice. (g) Densitometry results of Western blots are presented in f. Statistical analysis was performed by one-way ANOVA with replication followed by Scheffe's post hoc analysis; p-values are indicated. (h) Barograph shows glucose release by the transfected cells, as shown in e, f, and g, into glucose-free media supplemented with lactate and insulin at 0 (mock treatment) and 10 nM concentrations. Error bars are standard deviations. Statistical comparison between differently transfected groups of cells induced with insulin and non-induced by one-factor glucose release was carried out using ANOVA followed by Scheffe's post hoc analysis; p-values are indicated. (i) non-66-kDa Shc isoform alterations in multiple tissues of ShcP knockout mice. Liver, spleen, lungs, kidneys, epididymal fat, macrophages, testicles, muscles, gastrocnemius and femur, brain, heart, and MEFs were analyzed using Western blot with antibodies against total ShcA, which recognizes all three Shc isoforms. Isoform expression was considered to be changed if p-value < 0.05, and the fold change was > in either direction. Al least two animals for control and two animals for ShcP mice were used. For some of the tissues, to verify Shc isoforms alterations, the number of animals exceeds 30. All blots gave consistent results.
Knockdown of p66Shc in vitro increases insulin sensitivity
The increased insulin sensitivity in Shc mice could be the direct consequence of Shc mutations or a result of changes throughout mouse development. To clarify whether alterations in Shc expression directly affect insulin signaling, we performed p66Shc-specific, p66/52/46Shc-all isoforms knockdown and p66Shc or p46Shc overexpression in liver cell line FL83B, HEK, and C2C12 muscle cells. As seen in Fig. 2e, mouse liver cells FL83B transfected with si-p66Shc si-RNA had significantly reduced expression of p66Shc with no decrease in p52/46Shc, whereas si-ShcTotal si-RNA decreased levels of all Shc isoforms. si-ShcTotal si-RNA mostly affected the expression of p46Shc and had less effect on p66Shc than si-p66Shc si-RNA. In vitro knockdown of p66Shc and all Shc isoforms increased insulin-dependent Akt signaling (Fig. 2f,g). p-values after oneway ANOVA with replication are indicated in the figure. Furthermore, Shc knockdown decreased insulin-dependent glucose release by liver cells (Fig. 2h). Inhibition of all Shc isoforms had slightly bigger effect on insulin-suppressed glucose release, than just si-p66Shc si-RNA. The p-values are generated using one-way ANOVA followed by Scheffe's post hoc tests and are shown in the graph. Consistently, Shc overexpression decreased signaling of insulin toward P-Akt (Fig. S1). Thus, at the organismal, tissue, and cellular levels, p66Shc depletion sensitizes to insulin, and Shc isoforms opposes insulin signaling through PI3K.
ShcL mice have modest changes in body composition, whereas ShcP have major changes
Insulin sensitivity is known to affect body composition, and so this was investigated in ShcL and ShcP mice (Fig. 3a). ShcL mice were recently constructed by the Prolla group and have a precise deletion of p66Shc isoform and no other changes. ShcL mice had a total white fat mass similar to controls, and anecdotal but nonsignificant trends for increases in epididymal, perirenal, intrascapular white, intramuscular, and intrahepatic fat. Thus, a simple deletion of p66Shc causes a ‘fat’ tendency. By contrast, there were major changes in body composition in the ShcP strain originally generated in 1999 (Migliaccio et al., 1999). Whereas all other body components were similar, several white fat depots of the ShcP mice were significantly decreased relative to controls (Fig. 3a) [*p-values obtained by one way ANOVA < 0.05% and fold change > 1.2]. Total white fat mass of ShcP mice was significantly lower than that of ControlP, ControlL, ShcL and lower than the means of both control strains. Thus, when maintained on normal diet, the ShcP mice have great reduction in white fat mass, whereas ShcL mice, with a simple deletion of p66Shc, do not.
Fig. 3.
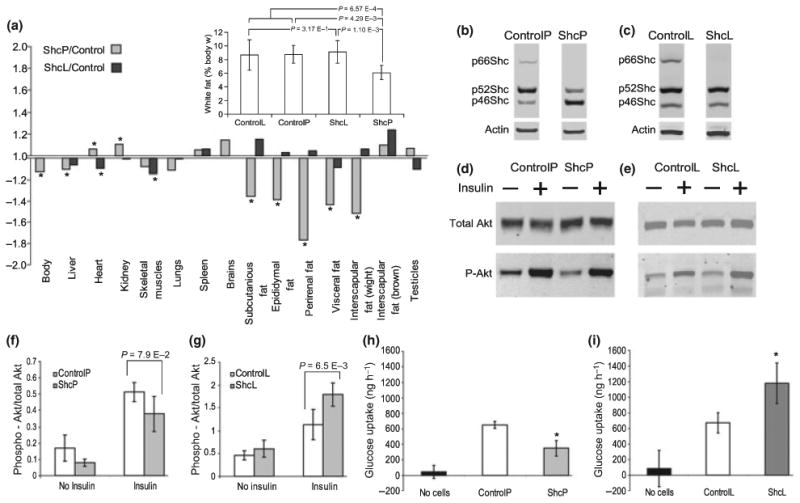
ShcP mice have reduced fat mass and fat insulin sensitivity but ShcL mice have increased body fat mass and increased adipose insulin sensitivity. (a) Body composition of ShcP and ShcL mice expressed as weight fold changes of KO over wild-type. Six ShcP mice, six ControlP, eight ShcL and six ControlL mice were used in the experiment. *significant difference, which means that the p-value > 0.05. The additional graph shows calculated total white fat mass expressed as percentage of body weight. Groups were compared using ANOVA single factor with replication followed by Scheffe's post hoc test, and p-values of Scheffe's comparisons are indicated. Results were reproduced at least twice in independent experiments. (b, c) Proteins from epididymal fat tissue of ShcP and ShcL strains, as indicated, were analyzed using Western blot with anti-Shc and anti-actin beta antibodies. (d, e) ShcP (d) and ShcL (e) KO mice were fasted for 6 h, anesthesia was initiated by pentobarbital, and insulin was injected via inferior vena cava as described. Biopsies of epididymal fat tissue were collected. Western blots were probed with indicated antibody. (f, g) Densitometry of the blots is shown in d and e accordingly. In this experiment, three ControlP, two ShcP, two ControlL, and two ShcL mice were used, and p-values are indicated. Results were consistent with several independent similar experiments. (h, i) Adipocytes were isolated from fat tissue of ShcP (h) and ShcL (i) strains and cultivated in three-dimensional collagen culture as described in Methods section. Media were supplemented with glucose and insulin at 0.16 nM concentration. Aliquots of media were collected from 0 to 96 h, and glucose concentrations were measured. Insulin-induced glucose consumption was calculated. Error bars are standard deviations; three ControlL and three ShcL mice, and two ControlP and two ShcP mice were used in technical replication of two. Two additional independent similar experiments have shown similar results. *means p-value, generated from two-tailed t-test < 0.05.
A gene expression difference at the Shc locus between ShcP and ShcL mice
The differences in fat content between the two mutant strains were striking because both mice were highly inbred on the C57Bl/6 background, with the only difference between them at the Shc locus, so we investigated the structure of both loci. We cloned and re-sequenced the Shc loci of both ShcL and ShcP strains. The Shc locus encodes three isoforms: p66Shc, p52Shc, and p46Shc. Whereas ShcL mice have a deletion of p66Shc with precise excision of neomycin phosphotransferase gene (Neo), the Neo gene in ShcP mice is still present in first intron of Shc locus, which could change the expression of other Shc isoforms in the locus. We investigated the expression of all Shc isoforms in multiple tissues of both ShcL and ShcP strains (Fig. 2i). ShcL mice had a simple deletion of p66Shc and no changes in other isoforms across tissues. By contrast, in ShcP mice, p52Shc was downregulated in all tissues examined, whereas p46Shc isoform was significantly upregulated only in white fat and in macrophages. The p66Shc gene is simply deleted in ShcL mice, and this simple deletion results in a ‘fat’ phenotype. ShcP mice, by contrast, in addition to p66Shc deletion have altered the expression of non-66-kDa isoforms. Thus, the ‘lean’ phenotype of ShcP cannot be attributed to the simple deletion of p66Shc, but must be attributed to something else – most likely the alterations of p46 and p52 isoforms at the coisogenic locus.
Although p52Shc was decreased in all tissues of the ShcP mice, we only observed differences in body composition in adipose. By contrast, p46Shc was specifically increased in adipose, and we observed a tissue-specific decrease in adipose in ShcP mice. Similarly, p46Shc is also increased in macrophages, and these macrophages have a defect in superoxide production (Tomilov et al., 2009), whereas ShcL mice did not have the defect (data not shown). Thus, morphological (inhibition of adiposity) and biochemical (inhibition of superoxide production) changes in ShcP mice are correlated with the upregulation of p46Shc, and we suggest that p46Shc upregulation in white fat decreases adiposity in ShcP mice.
Increased p46Shc and decreased insulin signaling in the fat of ShcP mice
The Western blot of Shc isoforms expression in the fat of the two p66Shc KO strains is presented in Fig. 3b,c. In contrast to the fat of the ShcL mice, which have deletion of p66Shc and no change in other isoforms, the previously reported ShcP mice, as seen on the Western blot 3b, have in addition to p66Shc deletion a fourfold increase in p46Shc. As our in vitro studies (Fig. 2e–h) have shown that Shc inhibition stimulates Akt signaling, we compared insulin sensitivity of fat in the two strains. It was clear that ShcL knockouts had the same sensitization to insulin in fat tissue (Fig. 3e,g) as they did in liver and muscle, and consistent with this, an increased insulin-induced glucose uptake by cultured adipocytes was observed (Fig. 3i). By contrast, there was reduced insulin sensitivity of fat from ShcP mice (Fig. 3d,f), and cultured adipocytes from ShcP mice exhibited decreased insulin-induced glucose uptake (Fig. 3h). In these presented experiments, three ControlP, two ShcP, two ControlL, and two ShcL mice were used (p-values are indicated in the figure). Results were consistent with several independent similar experiments. Error bars are standard deviations [*means p-value, two-tailed t-test < 0.05]. Thus, an accidental upregulation of 46Shc in the fat of ShcP mice as a result of the knockout construct appears to desensitize the adipose tissue to insulin, causing decreased fat mass. These results are consistent with the view that Shc antagonizes insulin signaling through the PI-3Kinase pathway, as has recently been reported for IGF-1 signaling (Xi et al., 2008) and for insulin signaling (Berniakovich et al., 2008). Moreover, overexpression of p46Shc in mouse liver cell line FL83B reduced Akt activation by insulin (Fig. S1). Thus, because ShcL mice with a simple deletion of p66Shc are fat and because ShcP mice with a deletion of p66Shc and an increase in p46Shc in fat are lean, the decrease in fat mass in ShcP mice appears to be the result of increased p46Shc in adipose rather than p66Shc deletion.
ShcL mice are sensitized to fatty diets, whereas ShcP mice resist them
Given the difference in body composition of ShcP and ShcL mice, we investigated the sensitivity of both strains to fatty diets. At 2 months of age, the mice were put on moderate-fat, high-sugar diet (MFD) and high-fat diets (HFD). The body weight increase is presented in Fig. 4. MFD results are presented in Fig. 4a and HFD results in Fig. 4b. ShcL, i.e. ‘fat’ mice, with a simple deletion of p66Shc and no other change, were quite sensitive to MFD and HFD, gaining significantly more weight than controls (Fig. 4b). Extensive increase in fat mass and infiltration of fat into muscles and liver were observed in ShcL mice on both MFD and HFD. By contrast, ShcP, i.e. ‘lean’, mice were resistant to weight gain on fatty diets when compared to controls (Fig. 4a) [*means p < 0.05, repeated-measurements one-way ANOVA]. Moreover, even on HFD, ShcP mice resisted fatty-diet-induced insulin resistance in liver and muscles, whereas ShcL mice were more susceptible and lost insulin-induced Akt activation in liver faster than controls (data not shown). Thus, whereas ShcL ‘fat’ mice, with a simple deletion of p66Shc, gained weight readily and became sufficiently heavier than controls, ShcP ‘lean’ mice resisted fatty diets. The increased intrahepatic and intramuscular fat observed in ShcL mice on normal diets became even more obvious on HFD. Thus, ShcL mice with a simple deletion of p66Shc were ‘fat’, whereas ShcP mice with overexpression of p46Shc in adipose were ‘lean’, even though they share the same deletion of the p66Shc locus.
Fig. 4.
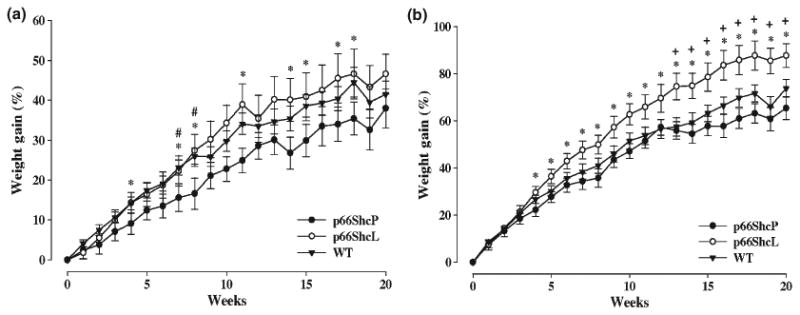
p66ShvP mice are resistant to fat feeding, but ShcL mice are prone to fatty diets. Weight gain in ShcP, ShcL, and wild-type mice fed either a moderate-fat (a) or high-fat (b) diet. Weight gain was calculated as percentage increase in weight over baseline (time zero). All mice started on the moderate- or high-fat diets at 2 months of age. *a difference (p < 0.05) between the ShcP and ShcL mice; #a difference (p < 0.05) between the ShcP and WT mice; +a difference (p < 0.05) between the ShcL and WT mice. Twelve male mice were used in each group.
Discussion
P66Shc deletion sensitizes to insulin at the tissue and cellular level
We carried out microarray analysis that supported alteration in insulin signaling in ShcP mice. Both ShcP and ShcL strains were demonstrated to be sensitized to insulin at the tissue level, in liver and in muscle. As p66Shc deletion sensitizes to insulin at the tissue level, p66Shc is functionally a repressor of insulin signaling. This in vivo result was further confirmed in vitro by knockdown and overexpression of Shc isoforms. An inhibitory effect of p66Shc on glucose uptake and activation of ERK by insulin was recently shown in vitro for L6 myoblasts (Natalicchio et al., 2009) and smooth muscle cells (Xi et al., 2008). p66Shc was also reported to oppose EGFR-MAP kinase and other signaling pathways through p52/46Shc (Migliaccio et al., 1997). Shc deletion has been shown to oppose obesity through alteration of insulin signaling in ob/ob mice (Ranieri et al., 2010). Thus, our results at the organismal, tissue and cellular levels are consistent with the studies of others, which conclude that Shc proteins inhibit signaling through IRS-1/PI3-K.
p66Shc deletion alone results in a ‘fat’ phenotype, i.e. increased adiposity and susceptibility to a high-fat diet
The ShcL mice, constructed 11 years after the first p66Shc model (ShcP), have a simple deletion of the p66Shc locus and no alteration of other Shc isoforms and are coisogenic with ShcP mice on the C57Bl6 background. These mice are susceptible to high-fat diets and have fatty inclusions in liver and muscle. Thus, the simple deletion of only p66Shc causes a ‘fatty’ phenotype, not consistent with ‘healthy aging’.
ShcP mice are lean and resist fatty diets
In contrast to the ShcL mice, ShcP mice are lean and resist fatty diets, even though ShcP mice share the deletion of the p66Shc locus with the ShcL mice. Thus, there must be an additional change in ShcP mice that does not happen in ShcL mice. Expression of Shc isoforms was compared. ShcP mice underexpress p52Shc in all tissues relative to controls. ShcP mice over-express p46Shc in their fat and macrophages, and we observed the inhibition of adipose growth (this work) and macrophage superoxide production (Tomilov et al., 2009). Thus, we demonstrated that although p66Shc inhibits insulin signaling, deletion of p66Shc alone is insufficient to explain the leanness and resistance to fatty diets observed in the ShcP mice. We suggest that this part of the phenotype is the result of p46Shc overexpression in fat, and we showed by ex vivo experiments that insulin-dependent glucose uptake is decreased in ShcP fat, but increased in ShcL fat. p46Shc has been previously reported to reside in mitochondria (Ventura et al., 2004). Thus, overexpression of mitochondrial p46Shc in fat is the likeliest explanation of the lean and insulin-sensitive phenotype of ShcP mice.
Insulin signaling in fat and longevity
These results highlight the importance of insulin signaling in adipose as a determinant of longevity and are consistent with the FIRKO mice in which insulin receptor deletion in fat decreased fat mass and caused increased longevity (Bluher et al., 2003; Kloting & Bluher, 2005). The results of our study are also consistent with the observation that surgical deletion or transplantation of visceral fat is an important determinant of longevity in rodents (Muzumdar et al., 2008).
Counterexamples and trade-offs
However, there are counterexamples. Mice with the complete deletion of fat are diabetic and short-lived (Moitra et al., 1998). Also, some long-lived rodents, such as Ames, Snell and little mice, and GHRKO mice (Hsieh et al., 2002b; Amador-Noguez et al., 2004; Bartke & Brown-Borg, 2004), have more fat than controls at the end of life. However, these mice also appear to have functional trade-offs for their longevity, including reduced reproductive capacity, reduced body temperature, obesity, and dwarfism (Hunter et al., 1999; Van Voorhies et al., 2006). Thus, some longevity models with relatively few functional trade-offs support the view that fat mass is an important determinant of rodent lifespan (e.g. this study, Bluher et al., 2003; Muzumdar et al., 2008). However, there are other models with more fat (e.g. Ames, Snell, GHRKO) that definitely have much longer (if perhaps less functional) lives.
Data presented here support the view that the increased life-span in ShcP mice involves a decrease in multiple fat depots including visceral fat, and desensitization of fat to insulin signaling, resulting in decreased fat mass. The consistency of the ShcP results with the FIRKO mouse model suggests that a reduction in fat-specific insulin signaling results in increased longevity with few functional trade-offs. Obesity in rodents and humans is a very important contributor to ‘unhealthy aging’ conditions, including diabetes and inflammatory diseases, which shorten lifespan (Barzilai & Gabriely, 2001; Gabriely & Barzilai, 2001; Atzmon et al., 2008). Thus, a better understanding of p46Shc's role in inhibiting insulin signaling could help in further understanding healthy aging and lifespan.
The insulin/GF axis in longevity
A growing body of literature supports the claim that reductions in the insulin/IGF axis extend rodent lifespan (Richardson et al., 2004; Selman et al., 2008). For example, in the long-lived Ames and Snell dwarfs, GHRKO, FIRKO, and calorie-restricted mice, there are reductions in circulating insulin/IGF and increase in tissue insulin sensitivity (Bartke & Brown-Borg, 2004). Long-lived insulin-resistant counterexamples also exist, e.g. Klotho mice, Irs1−/− mice, and bIrs2+/−, −/− (brain-specific IRS2 deletion) mice (Kurosu et al., 2005; Taguchi et al., 2007; Selman et al., 2008). One possible explanation is that it is a reduced overall intracellular response through the insulin-IGF-1 pathway that is important for longevity, and this can be achieved through lower levels of circulating insulin/IGF-1 or through decreased insulin/IGF-1 receptor responsiveness or both.
The FIRKO model also suggests a special role for the insulin-signaling pathway in the murine longevity process specifically in adipose tissue. Fat-specific disruption of the insulin receptor gene is sufficient to increase lifespan in FIRKO mice, suggesting that reduced adiposity, even in the presence of normal or increased food intake, can extend lifespan (Bluher et al., 2003; Bluher, 2008). ShcP mice share several characteristics with the FIRKO mice, including reduced adipose, resistance to HFD, and a blunted insulin response of adipocytes. Moreover, surgical deletion or fat mass improves insulin signaling and promotes longevity in rodents (Muzumdar et al., 2008).
Summary
There are three main conclusions of this study. The first is that p66Shc is a functional inhibitor of the insulin-signaling pathway at the organismal, tissue, and cellular level. The second is that the simple deletion of p66Shc produces a ‘fatty’ phenotype. The third is that the lean, HFD-resistant phenotype of coisogenic ShcP mice cannot be solely the result of p66Shc deletion, but is most likely explained by a parallel increase in p46Shc expression in adipose. Because Shcs are directly involved in insulin signaling, we suggest that changes in Shc isoforms expression may be more important than redox properties of p66Shc for longevity and healthy aging in ShcP mice.
Supplementary Material
Fig. S1 Overexpression of Shc proteins decreases insulin signaling through IRS1/PI3K/Akt pathway. FL83B cells were transfected with indicated plasmids. Serum was overnight deprived from transfected cells and then media were supplemented with indicated concentrations of insulin. Ten minutes later, the cells were washed with ice-cold PBS and lysed. Cell lysates were Western analyzed with indicated antibody. Two independent transfection experiments were performed. Densitometry results of Western blots are presented in the graph, error bars are standard deviations of two experiments.
As a service to our authors and readers, this journal provides supporting information supplied by the authors. Such materials are peer-reviewed and may be re-organized for online delivery, but are not copy-edited or typeset. Technical support issues arising from supporting information (other than missing files) should be addressed to the authors.
Acknowledgments
We thank Khalida Sabeur for performing IVF and rederivation on C57BL/6 background of both ShcP and ShcL mice strains, Polly Pearce for the managing all mice colonies, Peter Havel and Kimber Stanhope for the help with three-dimensional cultures of adipocytes for the insulin-induced glucose uptake experiments, Robert Schoenfeld for advising with microarray experiments. This work was supported by USPHS AG025532, AG16719, EY12245.
Footnotes
Author contributions: A. A. Tomilov was responsible for the discovery of tissue-specific alterations in the expression of non-66-kDa isoforms of Shc in ShcP mice, generation of the hypothesis of tissue-specific alterations in insulin sensitivity of Shc mice, in vivo and in vitro testing of the insulin-signaling cascades in specific mouse tissues and cells with silenced/overexpressed p66Shc, p46Shc, or all three Shc isoforms, microarray experiments, in vitro insulin-induced glucose uptake/release experiments by cells, isolated from mouse ex vivo, and using cell lines. M. Giorgio, E. Migliaccio, and I. Berniakovich were responsible for the insulin and glucose tolerance and the clamp studies. T. A. Prolla generated ShcL mice. J. J. Ramsey and K. Hagopian were responsible for the body composition studies, moderate- and high-fat diet studies of both ShcP and ShcL strains and muscle glycogen content measurements. K. Kim conducted statistical analysis of micro-array. P. G. Pelicci generated the ShcP mice and directed studies involving ShcP mice. G. A. Cortopassi generally directed all of the studies of both ShcP and ShcL mice, generated the hypothesis that decreased fat mass increases lifespan of ShcP mice, and prepared the manuscript.
Supporting Information: Additional supporting information may be found in the online version of this article:
References
- Amador-Noguez D, Yagi K, Venable S, Darlington G. Gene expression profile of long-lived Ames dwarf mice and Little mice. Aging cell. 2004;3:423–441. doi: 10.1111/j.1474-9728.2004.00125.x. [DOI] [PubMed] [Google Scholar]
- Atzmon G, Pollin TI, Crandall J, Tanner K, Schechter CB, Scherer PE, Rincon M, Siegel G, Katz M, Lipton RB, Shuldiner AR, Barzilai N. Adiponectin levels and genotype: a potential regulator of life span in humans. J Gerontol. 2008;63:447–453. doi: 10.1093/gerona/63.5.447. [DOI] [PMC free article] [PubMed] [Google Scholar]
- Ayyadevara S, Alla R, Thaden JJ, Shmookler Reis RJ. Remarkable longevity and stress resistance of nematode PI3K-null mutants. Aging cell. 2008;7:13–22. doi: 10.1111/j.1474-9726.2007.00348.x. [DOI] [PubMed] [Google Scholar]
- Barbieri M, Bonafe M, Franceschi C, Paolisso G. Insulin/IGF-I-signaling pathway: an evolutionarily conserved mechanism of longevity from yeast to humans. Am J Physiol Endocrinol Metab. 2003;285:E1064–E1071. doi: 10.1152/ajpendo.00296.2003. [DOI] [PubMed] [Google Scholar]
- Bartke A. Long-lived Klotho mice: new insights into the roles of IGF-1 and insulin in aging. Trends Endocrinol Metab. 2006;17:33–35. doi: 10.1016/j.tem.2006.01.002. [DOI] [PubMed] [Google Scholar]
- Bartke A. Impact of reduced insulin-like growth factor-1/insulin signaling on aging in mammals: novel findings. Aging cell. 2008a;7:285–290. doi: 10.1111/j.1474-9726.2008.00387.x. [DOI] [PubMed] [Google Scholar]
- Bartke A. New findings in gene knockout, mutant and transgenic mice. Exp Gerontol. 2008b;43:11–14. doi: 10.1016/j.exger.2007.10.009. [DOI] [PubMed] [Google Scholar]
- Bartke A, Brown-Borg H. Life extension in the dwarf mouse. Curr Top Dev Biol. 2004;63:189–225. doi: 10.1016/S0070-2153(04)63006-7. [DOI] [PubMed] [Google Scholar]
- Barzilai N, Gabriely I. The role of fat depletion in the biological benefits of caloric restriction. J Nutr. 2001;131:903S–906S. doi: 10.1093/jn/131.3.903S. [DOI] [PubMed] [Google Scholar]
- Berniakovich I, Trinei M, Stendardo M, Migliaccio E, Minucci S, Bernardi P, Pelicci PG, Giorgio M. p66Shc-generated oxidative signal promotes fat accumulation. J Biol Chem. 2008:M804362200. doi: 10.1074/jbc.M804362200. [DOI] [PMC free article] [PubMed] [Google Scholar]
- Bluher M. Fat tissue and long life. Obes Facts. 2008;1:176–182. doi: 10.1159/000145930. [DOI] [PMC free article] [PubMed] [Google Scholar]
- Bluher M, Kahn BB, Kahn CR. Extended longevity in mice lacking the insulin receptor in adipose tissue. Science. 2003;299:572–574. doi: 10.1126/science.1078223. [DOI] [PubMed] [Google Scholar]
- Coschigano KT, Holland AN, Riders ME, List EO, Flyvbjerg A, Kopchick JJ. Deletion, but not antagonism, of the mouse growth hormone receptor results in severely decreased body weights, insulin, and insulin-like growth factor I levels and increased life span. Endocrinology. 2003;144:3799–3810. doi: 10.1210/en.2003-0374. [DOI] [PubMed] [Google Scholar]
- Draghici S, Khatri P, Tarca AL, Amin K, Done A, Voichita C, Georgescu C, Romero R. A systems biology approach for pathway level analysis. Genome Res. 2007;17:1537–1545. doi: 10.1101/gr.6202607. [DOI] [PMC free article] [PubMed] [Google Scholar]
- Flurkey K, Papaconstantinou J, Miller RA, Harrison DE. Lifespan extension and delayed immune and collagen aging in mutant mice with defects in growth hormone production. Proc Natl Acad Sci USA. 2001;98:6736–6741. doi: 10.1073/pnas.111158898. [DOI] [PMC free article] [PubMed] [Google Scholar]
- Gabriely I, Barzilai N. The role of fat cell derived peptides in age-related metabolic alterations. Mech Ageing Dev. 2001;122:1565–1576. doi: 10.1016/s0047-6374(01)00287-1. [DOI] [PubMed] [Google Scholar]
- Giorgio M, Migliaccio E, Orsini F, Paolucci D, Moroni M, Contursi C, Pelliccia G, Luzi L, Minucci S, Marcaccio M, Pinton P, Rizzuto R, Bernardi P, Paolucci F, Pelicci PG. Electron transfer between cytochrome c and p66Shc generates reactive oxygen species that trigger mitochondrial apoptosis. Cell. 2005;122:221–233. doi: 10.1016/j.cell.2005.05.011. [DOI] [PubMed] [Google Scholar]
- Glycogen Keppler D, Decker K. In: Methods of Enzymatic Analysis. 3rd. Bergmeyer HU, editor. Vol. 6. Verlag Chemie GmbH; Weinheim, Germany: 1984. [Google Scholar]
- Holzenberger M, Dupont J, Ducos B, Leneuve P, Geloen A, Even PC, Cervera P, Le Bouc Y. IGF-1 receptor regulates lifespan and resistance to oxidative stress in mice. Nature. 2003;421:182–187. doi: 10.1038/nature01298. [DOI] [PubMed] [Google Scholar]
- Hsieh CC, DeFord JH, Flurkey K, Harrison DE, Papaconstantinou J. Effects of the Pit1 mutation on the insulin signaling pathway: implications on the longevity of the long-lived Snell dwarf mouse. Mech Ageing Dev. 2002a;123:1245–1255. doi: 10.1016/s0047-6374(02)00037-4. [DOI] [PubMed] [Google Scholar]
- Hsieh CC, DeFord JH, Flurkey K, Harrison DE, Papaconstantinou J. Implications for the insulin signaling pathway in Snell dwarf mouse longevity: a similarity with the C. elegans longevity paradigm. Mech Ageing Dev. 2002b;123:1229–1244. doi: 10.1016/s0047-6374(02)00036-2. [DOI] [PubMed] [Google Scholar]
- Hunter WS, Croson WB, Bartke A, Gentry MV, Meliska CJ. Low body temperature in long-lived Ames dwarf mice at rest and during stress. Physiol Behav. 1999;67:433–437. doi: 10.1016/s0031-9384(99)00098-0. [DOI] [PubMed] [Google Scholar]
- Kisielow M, Kleiner S, Nagasawa M, Faisal A, Nagamine Y. Isoform-specific knockdown and expression of adaptor protein ShcA using small interfering RNA. Biochem J. 2002;363:1–5. doi: 10.1042/0264-6021:3630001. [DOI] [PMC free article] [PubMed] [Google Scholar]
- Kloting N, Bluher M. Extended longevity and insulin signaling in adipose tissue. Exp Gerontol. 2005;40:878–883. doi: 10.1016/j.exger.2005.07.004. [DOI] [PubMed] [Google Scholar]
- Kurosu H, Yamamoto M, Clark JD, Pastor JV, Nandi A, Gurnani P, McGuinness OP, Chikuda H, Yamaguchi M, Kawaguchi H, Shimomura I, Takayama Y, Herz J, Kahn CR, Rosenblatt KP, Kuro-o M. Suppression of aging in mice by the hormone Klotho. Science. 2005;309:1829–1833. doi: 10.1126/science.1112766. [DOI] [PMC free article] [PubMed] [Google Scholar]
- Laviola L, Perrini S, Cignarelli A, Natalicchio A, Leonardini A, De Stefano F, Cuscito M, De Fazio M, Memeo V, Neri V, Cignarelli M, Giorgino R, Giorgino F. Insulin signaling in human visceral and subcutaneous adipose tissue in vivo. Diabetes. 2006;55:952–961. doi: 10.2337/diabetes.55.04.06.db05-1414. [DOI] [PubMed] [Google Scholar]
- Laviola L, Natalicchio A, Giorgino F. The IGF-I signaling pathway. Curr Pharm Des. 2007;13:663–669. doi: 10.2174/138161207780249146. [DOI] [PubMed] [Google Scholar]
- Li X, Monks B, Ge Q, Birnbaum MJ. Akt/PKB regulates hepatic metabolism by directly inhibiting PGC-1alpha transcription coactivator. Nature. 2007;447:1012–1016. doi: 10.1038/nature05861. [DOI] [PubMed] [Google Scholar]
- Lotti LV, Lanfrancone L, Migliaccio E, Zompetta C, Pelicci G, Salcini AE, Falini B, Pelicci PG, Torrisi MR. Sch proteins are localized on endoplasmic reticulum membranes and are redistributed after tyrosine kinase receptor activation. Mol Cell Biol. 1996;16:1946–1954. doi: 10.1128/mcb.16.5.1946. [DOI] [PMC free article] [PubMed] [Google Scholar]
- Migliaccio E, Mele S, Salcini AE, Pelicci G, Lai KM, Superti-Furga G, Pawson T, Di Fiore PP, Lanfrancone L, Pelicci PG. Opposite effects of the p52shc/p46shc and p66shc splicing isoforms on the EGF receptor-MAP kinase-fos signalling pathway. EMBO J. 1997;16:706–716. doi: 10.1093/emboj/16.4.706. [DOI] [PMC free article] [PubMed] [Google Scholar]
- Migliaccio E, Giorgio M, Mele S, Pelicci G, Reboldi P, Pandolfi PP, Lanfrancone L, Pelicci PG. The p66shc adaptor protein controls oxidative stress response and life span in mammals. Nature. 1999;402:309–313. doi: 10.1038/46311. [DOI] [PubMed] [Google Scholar]
- Moitra J, Mason MM, Olive M, Krylov D, Gavrilova O, Marcus-Samuels B, Feigenbaum L, Lee E, Aoyama T, Eckhaus M, Reitman ML, Vinson C. Life without white fat: a transgenic mouse. Genes Dev. 1998;12:3168–3181. doi: 10.1101/gad.12.20.3168. [DOI] [PMC free article] [PubMed] [Google Scholar]
- Mueller WM, Gregoire FM, Stanhope KL, Mobbs CV, Mizuno TM, Warden CH, Stern JS, Havel PJ. Evidence that glucose metabolism regulates leptin secretion from cultured rat adipocytes. Endocrinology. 1998;139:551–558. doi: 10.1210/endo.139.2.5716. [DOI] [PubMed] [Google Scholar]
- Muzumdar R, Allison DB, Huffman DM, Ma X, Atzmon G, Einstein FH, Fishman S, Poduval AD, McVei T, Keith SW, Barzilai N. Visceral adipose tissue modulates mammalian longevity. Aging cell. 2008;7:438–440. doi: 10.1111/j.1474-9726.2008.00391.x. [DOI] [PMC free article] [PubMed] [Google Scholar]
- Natalicchio A, De Stefano F, Perrini S, Laviola L, Cignarelli A, Caccioppoli C, Quagliara A, Melchiorre M, Leonardini A, Conserva A, Giorgino F. Involvement of the p66Shc protein in glucose transport regulation in skeletal muscle. Am J Physiol Endocrinol Metab. 2009;296:228–237. doi: 10.1152/ajpendo.90347.2008. [DOI] [PubMed] [Google Scholar]
- Neumann-Haefelin E, Qi W, Finkbeiner E, Walz G, Baumeister R, Hertweck M. SHC-1/p52Shc targets the insulin/IGF-1 and JNK signaling pathways to modulate life span and stress response in C. elegans. Genes Dev. 2008;22:2721–2735. doi: 10.1101/gad.478408. [DOI] [PMC free article] [PubMed] [Google Scholar]
- Pelicci G, Lanfrancone L, Grignani F, McGlade J, Cavallo F, Forni G, Nicoletti I, Grignani F, Pawson T, Pelicci PG. A novel transforming protein (SHC) with an SH2 domain is implicated in mitogenic signal transduction. Cell. 1992;70:93–104. doi: 10.1016/0092-8674(92)90536-l. [DOI] [PubMed] [Google Scholar]
- Perez-Matute P, Marti A, Martinez JA, Fernandez-Otero MP, Stanhope KL, Havel PJ, Moreno-Aliaga MJ. Eicosapentaenoic fatty acid increases leptin secretion from primary cultured rat adipocytes: role of glucose metabolism. Am J Physiol Regulatory Integrative Comp Physiol. 2005;288:1682–1688. doi: 10.1152/ajpregu.00727.2004. [DOI] [PubMed] [Google Scholar]
- Ranieri SC, Fusco S, Panieri E, Labate V, Mele M, Tesori V, Ferrara AM, Maulucci G, De Spirito M, Martorana GE, Galeotti T, Pani G. Mammalian life-span determinant p66shcA mediates obesity-induced insulin resistance. Proc Natl Acad Sci USA. 2010;107:13420–13425. doi: 10.1073/pnas.1008647107. [DOI] [PMC free article] [PubMed] [Google Scholar]
- Richardson A, Liu F, Adamo ML, Van Remmen H, Nelson JF. The role of insulin and insulin-like growth factor-I in mammalian ageing. Best Pract Res. 2004;18:393–406. doi: 10.1016/j.beem.2004.02.002. [DOI] [PubMed] [Google Scholar]
- Saucier C, Khoury H, Lai KM, Peschard P, Dankort D, Naujokas MA, Holash J, Yancopoulos GD, Muller WJ, Pawson T, Park M. The Shc adaptor protein is critical for VEGF induction by Met/HGF and ErbB2 receptors and for early onset of tumor angiogenesis. Proc Natl Acad Sci USA. 2004;101:2345–2350. doi: 10.1073/pnas.0308065101. [DOI] [PMC free article] [PubMed] [Google Scholar]
- Schadt EE, Li C, Ellis B, Wong WH. Feature extraction and normalization algorithms for high-density oligonucleotide gene expression array data. J Cell Biochem. 2001;37(Suppl):120–125. doi: 10.1002/jcb.10073. [DOI] [PubMed] [Google Scholar]
- Selman C, Lingard S, Choudhury AI, Batterham RL, Claret M, Clements M, Ramadani F, Okkenhaug K, Schuster E, Blanc E, Piper MD, Al-Qassab H, Speakman JR, Carmignac D, Robinson IC, Thornton JM, Gems D, Partridge L, Withers DJ. Evidence for life-span extension and delayed age-related biomarkers in insulin receptor substrate 1 null mice. FASEB J. 2008;22:807–818. doi: 10.1096/fj.07-9261com. [DOI] [PubMed] [Google Scholar]
- Taguchi A, Wartschow LM, White MF. Brain IRS2 signaling coordinates life span and nutrient homeostasis. Science. 2007;317:369–372. doi: 10.1126/science.1142179. [DOI] [PubMed] [Google Scholar]
- Tomilov AA, Bicocca V, Schoenfeld RA, Giorgio M, Migliaccio E, Ramsey JJ, Hagopian K, Pelicci PG, Cortopassi GA. Decreased superoxide production in macrophages of long-lived p66Shc knockout mice. J Biol Chem. 2009;285:1153–1165. doi: 10.1074/jbc.M109.017491. [DOI] [PMC free article] [PubMed] [Google Scholar]
- Trinei M, Berniakovich I, Beltrami E, Migliaccio E, Fassina A, Pelicci P, Giorgio M. P66Shc signals to age. Aging. 2009;1:503–510. doi: 10.18632/aging.100057. [DOI] [PMC free article] [PubMed] [Google Scholar]
- Van Voorhies WA, Curtsinger JW, Rose MR. Do longevity mutants always show trade-offs? Exp Gerontol. 2006;41:1055–1058. doi: 10.1016/j.exger.2006.05.006. [DOI] [PubMed] [Google Scholar]
- Ventura A, Maccarana M, Raker VA, Pelicci PG. A cryptic targeting signal induces isoform-specific localization of p46Shc to mitochondria. J Biol Chem. 2004;279:2299–2306. doi: 10.1074/jbc.M307655200. [DOI] [PubMed] [Google Scholar]
- Xi G, Shen X, Clemmons DR. p66shc negatively regulates insulin-like growth factor I signal transduction via inhibition of p52shc binding to Src homology 2 domain-containing protein tyrosine phosphatase substrate-1 leading to impaired growth factor receptor-bound protein-2 membrane recruitment. Mol Endocrinol. 2008;22:2162–2175. doi: 10.1210/me.2008-0079. [DOI] [PMC free article] [PubMed] [Google Scholar]
- Yoon JC, Puigserver P, Chen G, Donovan J, Wu Z, Rhee J, Adelmant G, Stafford J, Kahn CR, Granner DK, Newgard CB, Spiegelman BM. Control of hepatic gluconeogenesis through the transcriptional coactivator PGC-1. Nature. 2001;413:131–138. doi: 10.1038/35093050. [DOI] [PubMed] [Google Scholar]
Associated Data
This section collects any data citations, data availability statements, or supplementary materials included in this article.
Supplementary Materials
Fig. S1 Overexpression of Shc proteins decreases insulin signaling through IRS1/PI3K/Akt pathway. FL83B cells were transfected with indicated plasmids. Serum was overnight deprived from transfected cells and then media were supplemented with indicated concentrations of insulin. Ten minutes later, the cells were washed with ice-cold PBS and lysed. Cell lysates were Western analyzed with indicated antibody. Two independent transfection experiments were performed. Densitometry results of Western blots are presented in the graph, error bars are standard deviations of two experiments.
As a service to our authors and readers, this journal provides supporting information supplied by the authors. Such materials are peer-reviewed and may be re-organized for online delivery, but are not copy-edited or typeset. Technical support issues arising from supporting information (other than missing files) should be addressed to the authors.