

Cysteine desulfurases (CDs) are enzymes that provide sulfur for several biological processes, including the synthesis of iron–sulfur clusters. The difference in the capacity of the two existing groups of CDs to interact with various partners seems to depend on the flexibility of an extended lobe that harbours the catalytic cysteine.
Keywords: cysteine desulfurase, iron–sulfur cluster, Arabidopsis thaliana, SUF machinery
Abstract
The chloroplastic Arabidopsis thaliana Nfs2 (AtNfs2) is a group II pyridoxal 5′-phosphate-dependent cysteine desulfurase that is involved in the initial steps of iron–sulfur cluster biogenesis. The group II cysteine desulfurases require the presence of sulfurtransferases such as SufE proteins for optimal activity. Compared with group I cysteine desulfurases, proteins of this group contains a smaller extended lobe harbouring the catalytic cysteine and have a β-hairpin constraining the active site. Here, two crystal structures of AtNfs2 are reported: a wild-type form with the catalytic cysteine in a persulfide-intermediate state and a C384S variant mimicking the resting state of the enzyme. In both structures the well conserved Lys241 covalently binds pyridoxal 5′-phosphate, forming an internal aldimine. Based on available homologous bacterial complexes, a model of a complex between AtNfs2 and the SufE domain of its biological partner AtSufE1 is proposed, revealing the nature of the binding sites.
1. Introduction
Cysteine desulfurases (CDs) are pyridoxal 5′-phosphate (PLP)-dependent enzymes that catalyze the desulfuration of l-cysteine to l-alanine (Zheng et al., 1993 ▶). Their physiological function is to provide the elemental sulfur required for the synthesis of diverse molecules such as thiamine and RNA thionucleosides or for the formation of iron–sulfur [Fe–S] clusters (Mihara et al., 2002 ▶; Mühlenhoff et al., 2004 ▶; Johnson et al., 2005 ▶). There are several [Fe–S] cluster-assembly machineries, namely NIF (nitrogen fixation), ISC (iron–sulfur cluster), SUF (sulfur mobilization) and CSD (cysteine sulfinate decarboxylase), all of which require the activity of a CD (Mueller, 2006 ▶). CDs have been classified into two groups: group I with NifS and IscS as prototypes and group II with SufS and CsdA as prototypes (Mueller, 2006 ▶). Although the group I and II CDs share a similar fold and dimeric assembly, they exhibit structural differences in the loop containing the catalytic cysteine residue (Mihara & Esaki, 2002 ▶). The desulfuration reaction leads to the formation of a persulfide intermediate (Cys-S-SH) before sulfur transfer to an acceptor protein, with the latter being either a [Fe–S] cluster scaffold protein or a sulfurtransferase (Shi et al., 2010 ▶). The characterized sulfurtransferases (TusA, SufE and CsdE from Escherichia coli) have been shown to increase the activity of their associated CDs (Outten et al., 2003 ▶; Loiseau et al., 2005 ▶; Ikeuchi et al., 2006 ▶; Layer et al., 2007 ▶).
In Arabidopsis thaliana there are two CDs: the mitochondrial Nfs1 and the chloroplastic Nfs2 (Léon et al., 2002 ▶; Couturier et al., 2013 ▶). Their activity is significantly enhanced upon interaction with the sulfurtransferase AtSufE1 (Xu & Møller, 2006 ▶; Ye et al., 2006 ▶; Couturier et al., 2014 ▶). The activity of AtNfs2 may also be increased by interaction with two other chloroplastic SufE-type proteins: AtSufE2 and AtSufE3 (Narayana Murthy et al., 2007 ▶). In contrast to nonplant SufE counterparts, plant SufE1s contain an additional C-terminal BolA domain, the function of which remains to be determined (Ye et al., 2006 ▶). In the absence of AtSufE1, AtNfs2 exhibits an efficient in vitro selenocysteine lyase activity that is 300-fold higher than the CD activity (Pilon-Smits et al., 2002 ▶).
In this study, we report the first X-ray crystal structures of a eukaryotic SufS-like protein, AtNfs2. Our data allowed a comparative analysis with other CD structures and in silico modelling of an A. thaliana Nfs2–SufE1 complex.
2. Materials and methods
2.1. Cloning, expression and purification
The open reading frame sequence encoding AtNfs2 (At1g08490) was amplified from A. thaliana leaf cDNA using AtNfs2 forward and reverse primers and was cloned into the NdeI and BamHI restriction sites of pET-15b vector to yield an N-terminally His-tagged protein (AtNfs2-Fw, 5′-CCCCCCCCCATATGGCCGCCGCCGCTTCCTCCGCCACC-3′; AtNfs2-Rv, 5′-CCCCGGATCCTTATTTGAAAGAGTGAAGAAGCTCACAGTGTC-3′). The amplified sequence encodes a protein deprived of the first 35 amino acids corresponding to the putative targeting sequence (Pilon-Smits et al., 2002 ▶). Using site-directed mutagenesis, the catalytic cysteine at position 384 was substituted with a serine using two complementary primers (AtNfs2_C384S-Fw, 5′-AGGTCAGGACACCACAGCGCACAGCCACTCCAC-3′; AtNfs2_C384S-Rv, 5′-GTGGAGTGGCTGTGCGCTGTGGTGTCCTGACCT-3′). For protein expression, the E. coli BL21 (DE3) strain containing the pSBET plasmid bearing the sequence coding for the tRNA recognizing the AGA and AGG codons poorly used in E. coli was transformed with each recombinant plasmid. Cultures were successively amplified to 2.4 l in Luria–Bertani medium at 37°C supplemented with 50 µg ml−1 ampicillin or kanamycin (added for the pET-15b construct and pSBET plasmid). Protein expression was induced at the exponential phase by the addition of 100 µM isopropyl β-d-1-thiogalactopyranoside and incubation for 4 h at 37°C. Cells were harvested by centrifugation at 4 400g for 15 min. The pellets were resuspended in 20 ml 50 mM Tris–HCl pH 8.0, 300 mM NaCl, 10 mM imidazole and the resuspended cells were stored at −20°C. Cell lysis was performed by sonication (3 × 1 min with intervals of 1 min) and the soluble and insoluble fractions were separated by centrifugation at 27 000g for 30 min. The lysate was loaded onto Ni2+ HiTrap chelating resin (Sigma–Aldrich, St Louis, Missouri, USA) for metal-affinity chromatography. After extensive washing, the proteins were eluted with a buffer consisting of 50 mM Tris–HCl pH 8.0, 300 mM NaCl, 250 mM imidazole. The recombinant proteins were dialyzed against 50 mM Tris–HCl pH 8.0 buffer and concentrated by ultrafiltration under nitrogen pressure (Amicon YM10 membrane). Protein purity was checked by SDS–PAGE and protein concentrations were determined spectrophotometrically using a molar extinction coefficient at 280 nm of 40 590 M −1 cm−1 for AtNfs2 WT and AtNfs2_C384S as determined from the primary sequences using the ProtParam tool (http://web.expasy.org/protparam/).
2.2. Crystallization
AtNfs2 and AtNfs2_C384S were crystallized using the microbatch-under-oil method at 278 K. AtNfs2 (11.7 mg ml−1) was crystallized by mixing 2 µl protein solution and 2 µl crystallization solution (Wizard I condition No. 28 consisting of 20% PEG 3000, 0.2 M sodium chloride, 0.1 M HEPES pH 7.5; Rigaku Reagents). AtNfs2_C384S (12.5 mg ml−1) was crystallized by mixing 1 µl protein solution and 2 µl of the same crystallization solution.
2.3. X-ray data collection, processing, structure determination and refinement
Crystals were flash-cooled in liquid nitrogen after a quick soak in crystallization solution premixed with 20% glycerol as the cryoprotectant. X-ray diffraction experiments were performed at 100 K on beamline FIP-BM30A at ESRF for AtNfs2 and on beamline PROXIMA1 at SOLEIL for AtNfs2_C384S (Table 1 ▶). Data sets extending to 1.7 and 1.9 Å resolution, respectively, were indexed and processed using XDS (Kabsch, 2010 ▶) and scaled and merged with SCALA (Evans, 2006 ▶) from the CCP4 program package (Winn et al., 2011 ▶). The AtNfs2 structure was solved by molecular replacement with MOLREP (Vagin & Teplyakov, 2010 ▶) using the coordinates of Synechocystis sp. SufS (PDB entry 1t3i) as a search model (Tirupati et al., 2004 ▶). Structures were refined (Table 1 ▶) with PHENIX (Adams et al., 2010 ▶) with visual inspection and manual correction in Coot (Emsley et al., 2010 ▶). Validation of both crystal structures was performed using MolProbity (Chen et al., 2010 ▶).
Table 1. Data collection and processing.
Values in parentheses are for the highest resolution shell.
| AtNfs2 | AtNfs2_C384S | |
|---|---|---|
| Diffraction data | ||
| Diffraction source | FIP-BM30A, ESRF | PROXIMA1, SOLEIL |
| Detector | ADSC Q315r CCD | PILATUS |
| Wavelength (Å) | 0.978542 | 0.980111 |
| Unit-cell parameters (Å, °) | a = 81.57, b = 68.21, c = 87.07, β = 94.8 | a = 81.72, b = 68.39, c = 87.58, β = 94.8 |
| Space group | P21 | P21 |
| Resolution range (Å) | 45.85–1.70 (1.80–1.70) | 46.02–1.90 (2.00–1.90) |
| Total No. of reflections | 336324 (28871) | 284408 (40116) |
| No. of unique reflections | 97828 (11087) | 75742 (10920) |
| Average multiplicity | 3.4 (2.6) | 3.8 (3.7) |
| Mean I/σ(I) | 13.8 (3.5) | 7.2 (3.1) |
| Completeness (%) | 95.0 (75.0) | 99.7 (99.4) |
| R merge † | 0.054 (0.187) | 0.103 (0.374) |
| R meas ‡ | 0.064 (0.227) | 0.120 (0.439) |
| R p.i.m. § | 0.033 (0.127) | 0.061 (0.226) |
| CC1/2 ¶ | 0.997 (0.940) | 0.989 (0.818) |
| Wilson B factor (Å2) | 17.7 | 21.8 |
| Refinement | ||
| Resolution range (Å) | 45.85–1.70 (1.73–1.70) | 46.02–1.90 (1.93–1.90) |
| R work †† | 0.202 (0.297) | 0.233 (0.328) |
| R free †† | 0.233 (0.341) | 0.262 (0.362) |
| No. of protein atoms | 6494 | 6453 |
| No. of waters | 854 | 678 |
| R.m.s.d.‡‡, bond lengths (Å) | 0.007 | 0.004 |
| R.m.s.d.‡‡, bond angles (°) | 1.13 | 0.85 |
| Ramachandran favoured (%) | 97.95 | 97.08 |
| Ramachandran outliers (%) | 0.24 | 0.12 |
| Average B factor (Å2) | ||
| Protein | 21.1 | 25.6 |
| Solvent | 33.5 | 30.0 |
| MolProbity rotamer outliers (%) | 1.15 | 1.57 |
| MolProbity clashscore§§ | 3.41 | 3.67 |
| MolProbity score¶¶ | 1.29 | 1.37 |
| PDB entry | 4q75 | 4q76 |
R
merge = 
 .
.
R
meas =  .
.
R
p.i.m. =  .
.
CC1/2 is the correlation coefficient of the mean intensities between two random half-sets of data (Karplus & Diederichs, 2012 ▶).
R
work = 
 . 5% of the reflections were selected for R
free calculation.
. 5% of the reflections were selected for R
free calculation.
Root-mean-square deviation from ideal values (Engh & Huber, 1991 ▶).
The MolProbity clashscore is the number of serious clashes per 1000 atoms (Chen et al., 2010 ▶).
The MolProbity score is a log-weighted combination of the clashscore, percentage Ramachandran not favoured and percentage bad side-chain rotamers (Chen et al., 2010 ▶).
2.4. AtNfs2–SufE1 modelling
The SufE domain sequence of AtSufE1 (Q84W65; residues 86–215; SufEAtSufE1) was extracted from the UniProt database and structurally modelled based on the structure of CsdE (PDB entry 4lw4) using the I-TASSER server (Zhang, 2008 ▶; Kim & Park, 2013 ▶). The in silico structure of SufEAtSufE1 was similar to CsdE, with a C-score of 0.89 and a root-mean-square deviation (r.m.s.d.) of 0.39 Å over 101 structurally equivalent Cα atoms. A biological AtNfs2–SufEAtSufE1 complex was obtained using the ClusPro protein–protein docking server (Comeau et al., 2004a ▶,b ▶; Kozakov et al., 2006 ▶, 2013 ▶). An AtNfs2 dimer was used as the receptor and SufEAtSufE1 was used as the ligand. ClusPro includes a fast Fourier transform-based rigid docking program that provides 1000 low-energy ligand positions. The 1000 positions are clustered with a 9 Å Cα r.m.s.d. radius and ranked according to their cluster sizes. The ClusPro models were visualized using PyMOL (Schrödinger). Finally, an energy refinement using the YAMBER force field from YASARA (Krieger et al., 2009 ▶) was applied to the best ClusPro AtNfs2–SufEAtSufE1 model. This energy-refinement procedure imposed only small conformational changes.
3. Results and discussion
3.1. Overall fold
AtNfs2 and its C384S variant crystallized in space group P21 with one homodimer (429 residues per monomer) per asymmetric unit (PDB entries 4q75 and 4q76, respectively). Their high-resolution structures (1.7 and 1.9 Å, respectively) are quite similar with an r.m.s.d. of 0.11 Å over 754 Cα atoms. The first 16 N-terminal residues were not visible in the electron-density maps.
As shown in Fig. 1 ▶(a), AtNfs2 exhibits the canonical dimeric organization of CDs (Pilon-Smits et al., 2002 ▶). Upon dimer formation, 21% of the surface area of each monomer is buried in the dimer interface (3600 Å2) through several hydrophobic and hydrophilic interactions involving 101 residues per monomer. A protomer is composed of 18 helices and 13 β-strands (Fig. 1 ▶ b). Each subunit folds into two parts corresponding to two conserved β-sheets with additional helices located at the N-terminal and C-terminal ends. The first is a seven-stranded β-sheet scaffold with β7 antiparallel to the others and surrounded by nine helices (E–M; residues 100–288). This part contains the PLP-binding site, in which the cofactor is covalently bound to Lys241 (helix K). This part also includes an additional β-hairpin loop (β8–β9) specific to group II which is in the neighbourhood of the active site of the other monomer. The second part is composed of a four-stranded β-sheet flanked by two helices (P–Q; residues 337–401). It contains the conserved catalytic residue (Cys384) located in an extended lobe between β12 and β13 that includes a short helix Q (Fig. 1 ▶ c).
Figure 1.

Structure of AtNfs2. (a) Ribbon representation of AtNfs2. Protomers A and B are coloured green and blue, respectively. (b) Topology diagram of secondary structures. Helices (letters) are shown in red and β-strands (numbers) are shown in blue. The N-terminal and C-terminal extremities are shown in orange. (c) AtNfs2 monomer. The seven-stranded β-sheet, the four-stranded β-sheet and the β-hairpin are shown in yellow, red and purple, respectively. The extended lobe between β12 and β13 is in cyan. The PLP cofactor covalently bound to the Lys241 and the catalytic site Cys384 are shown as sticks.
3.2. Comparison between group I and group II CDs
Currently, six crystal structures of CDs from group I and four from group II (AtNfs2, CsdA and CsdB from E. coli and slr0077 from Synechocystis sp.) are known (Table 2 ▶). In each group, the structures are very similar to each other, as shown by mean r.m.s.d.s of 1.03 and 0.77 Å for the group I and II CDs, respectively. Despite a relatively small r.m.s.d. for the group II CDs, a structural difference may however be noticed near the active site. In AtNfs2, CsdB and slr0077 helix D is straight with its N-terminal end near to the active site. The loop between helices B and C in CsdA is shorter by five residues and helix D has a different conformation. This modification kinks its N-terminal end (Kim & Park, 2013 ▶) and makes the active site more exposed to the solvent.
Table 2. List of cysteine desulfurase crystal structures available in the PDB (April 2014).
| Group | PDB code | Organism | Sequence identity to AtNfs2 (%) | UniProtKB accession No. | R.m.s.d. on Cα atoms | No. of equivalent residues to AtNfs2 |
|---|---|---|---|---|---|---|
| CsdA–SufS group II | 4q75 | Arabidopsis thaliana | Q93WX6 | |||
| 4q76 | ||||||
| 1t3i | Synechococcus sp. | 59.9 | Q55793 | 0.467 | 343 | |
| 1c0n | Escherichia coli | 44.8 | P77444 | 0.590 | 340 | |
| 1i29 | ||||||
| 1jf9 | ||||||
| 1kmj | ||||||
| 1kmk | ||||||
| 4lw2 | Escherichia coli | 37.4 | Q46925 | 0.736 | 306 | |
| 4lw4 | ||||||
| IscS–NifS group I | 1ecx | Thermotoga maritima | 20.7 | Q9X218 | 1.446 | 239 |
| 1eg5 | ||||||
| 1p3w | Escherichia coli | 20.0 | P0A6B7 | 1.500 | 252 | |
| 3lvj | ||||||
| 3lvk | ||||||
| 3lvl | ||||||
| 3lvm | ||||||
| 3gzc | Homo sapiens | 20.6 | Q96115 | 1.618 | 247 | |
| 3gzd | ||||||
| 4eb5 | Archaeoglobus fulgidus | 20.7 | O29689 | 1.627 | 250 | |
| 4eb7 | ||||||
| 4hvk | ||||||
| 4ixo | Rickettsia africae | 20.7 | C3PNQ7 | 1.687 | 218 | |
| 3a9x | Rattus norvegicus | 20.1 | Q68FT9 | 2.159 | 263 | |
| 3a9y | ||||||
| 3aqz |
A structural comparison between members of groups I and II revealed a mean r.m.s.d. of 1.81 Å. The main differences lie at the active site, as described previously (Mihara et al., 2002 ▶). For group II enzymes, the β-hairpin β8–β9 between helices L and M of monomer B partly covers the active site of monomer A, stabilizing the extended lobe between β12 and β13 containing the catalytic cysteine residue (Fig. 2 ▶ a). In the group I enzymes the area between helices L and M is shorter (the mean number of residues between helices L and M is eight in group I CDs and 24 in group II CDs) and does not interact with the extended lobe (Fig. 2 ▶ b). Hence, in most crystal structures of group I CDs parts of the lobe are not modelled and are therefore highly disordered. When modelled, it folds into three helices (the mean number of residues in the lobe is 26 in group I enzymes and 17 in group II enzymes).
Figure 2.
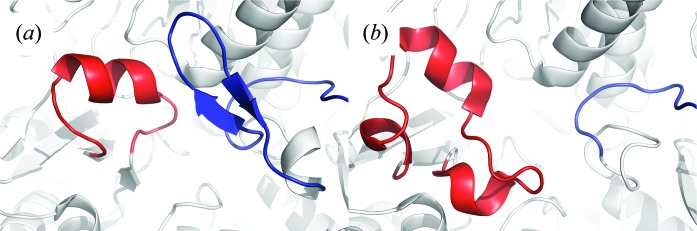
Comparison between group I and group II cysteine desulfurases. (a) Active site of AtNfs2, a SufS-like group II CD. (b) Active site of IscS from A. fulgidus (PDB entry 4eb7), a group I CD. Monomers A and B are coloured white. The loop corresponding to a β-hairpin (in group II CDs) is coloured blue and the region containing the conserved cysteine residue (referred to as the ‘extended loop’) is coloured red.
3.3. Active site
As in other CDs, the AtNfs2 homodimer has one active site per monomer. In each subunit, the extended lobe between β12 and β13 allows the active-site Cys384 to be in the proximity of the PLP cofactor. The electron density close to the S atom of Cys384 (Fig. 3 ▶ a) suggests a modification of the cysteine side chain by an additional atom. This additional electron-density cloud is not present in the C384S variant (Fig. 3 ▶ b) mimicking the resting state of the enzyme. Similar densities attached to the S atom have previously been reported in group I and II CDs and were interpreted as a cysteine-persulfide (Lima, 2002 ▶; Collins et al., 2012 ▶). The refinement of our high-resolution structure of AtNfs2 clearly favours the presence of a persulfide with full occupancy (Fig. 3 ▶ a). The catalytic cysteine is buried in all SufSs except CsdA, in which the environment of this residue is more open and solvent-exposed (see above).
Figure 3.

Active site of AtNfs2. (a) Electron density around the catalytic residue (Cys384) in wild-type AtNfs2. The map shown is a σA-weighted 2mF o − DF c map contoured at 1.2σ (0.44 e Å−3). (b) Electron density around Ser384 in the C384S variant. The map shown is a σA-weighted 2mF o − DF c map contoured at 1.2σ (0.42 e Å−3). (c) Representation of the PLP-binding site with 2mF o − DF c electron density (1.2σ and 0.44 e Å−3) around the cofactor and side chain of Lys241A. The PLP cofactor is covalently bound to Lys241A. Numerous residues are involved in the stabilization of the PLP cofactor, i.e. Thr110A, Ser238A, His240A and Thr292B for the phosphate group and Asp215A and Gln218A for the pyridine ring.
In both the AtNfs2 and the AtNfs2_C384S structures the PLP cofactor (C4′ atom) is linked to the side chain of Lys241A (Nζ atom), forming an internal aldimine. It is stabilized by residues interacting with the pyridine ring (Fig. 3 ▶ c) such as His138A, which uses π-stacking interactions with its imidazole ring. Furthermore, Asp215A and Gln218A form hydrogen bonds to the pyridine N1 and O3 atoms of PLP. Other contacts are made by the main chain and side chain of Thr110A and Thr292B, and the side-chain atoms of Ser238A and His240A involved in the stabilization of the PLP phosphate group (Fig. 3 ▶ c). Asp215 is an invariant residue, whereas Lys241, His138, Gln218, Thr110, Thr292, Ser238 and His240 are well conserved (62–90% conservation) and serve to stabilize PLP as observed in known CD structures.
3.4. AtNfs2–SufEAtSufE1 model
Complexes between prokaryotic group I CDs and their biological partners have been characterized previously: for example, the IscS–IscU complex from Archaeoglobus fulgidus (Marinoni et al., 2012 ▶) and the IscS–IscU and IscS–TusA complexes from E. coli (Shi et al., 2010 ▶). The comparison of group I CD structures alone (Kaiser et al., 2000 ▶; Cupp-Vickery et al., 2003 ▶; Omi et al., 2010 ▶; Collins et al., 2012 ▶; Yamanaka et al., 2013 ▶) and in complex revealed that the catalytic cysteine does not occupy the same position during the different steps of the catalysis, i.e. cysteine desulfuration and sulfur transfer (Shi et al., 2010 ▶; Marinoni et al., 2012 ▶). The flexible extended loop between β12 and β13 can promote conformational changes, positioning the cysteine in an suitable position to deliver the S atom of the persulfide intermediate to the corresponding biological partners. Moreover, analysis of the IscS–TusA and IscS–IscU complexes indicated that sulfur-acceptor proteins (IscU or TusA) do not need flexibility to receive the sulfur element. Notably, IscS uses different binding surfaces for interaction with these two acceptors (Fig. 4 ▶).
Figure 4.

Cysteine desulfurase and sulfur-acceptor complexes. The CD–sulfurtransferase (SufE, CsdE and TusA) complexes and the CD–scaffold protein (IscU) complex are represented as ribbons. CDs are coloured red, yellow and green, and CD partners are coloured cyan, purple and pink. (a) Model of the Nfs2–SufEAtSufE1 complex from A. thaliana and the X-ray crystal structures of (b) CsdA–CsdE from E. coli, (c) Fe2S2 coordinated by three sulfurtransferase residues (Cys33, Cys58 and Cys102) and by one cysteine desulfurase residue (Cys321) in the IscS–IscU complex from A. fulgidus, (d) IscS–IscU from E. coli and (e) IscS–TusA from E. coli (PDB entries 4lw4, 4eb5, 3lvl and 3lvj, respectively).
Recently, complexes involving E. coli group II CDs were studied by X-ray crystallography for the CsdA–CsdE complex (Fig. 4 ▶; Kim & Park, 2013 ▶) and by deuterium-exchange experiments for SufS–SufE (Singh et al., 2013 ▶). These studies revealed that the conformation of the CD alone and in complex with the sulfurtransferase was similar. In contrast, the sulfur-accepting cysteine of CsdE (or SufE) was buried in a hydrophobic cavity in the free enzyme and was out of the groove in an exposed conformation suitable for sulfur capture (Kim & Park, 2013 ▶; Singh et al., 2013 ▶). We attempted to build a model of AtNfs2–SufEAtSufE1 (Fig. 4 ▶) using the ClusPro docking server (Comeau et al., 2004a ▶,b ▶; Kozakov et al., 2006 ▶, 2013 ▶). An atomic model of AtSufE1 was derived by a homology-modelling approach. A notable feature of plant SufE1 is the presence of a C-terminal BolA domain linked by 61 residues to the N-terminal SufE domain (Ye et al., 2006 ▶). Assuming that the BolA domain of AtSufE1 does not interact with AtNfs2 and considering that this long linker will provide too much flexibility to obtain a reliable model, only the SufEAtSufE1 domain was used in modelling. The docking procedure was initially performed with the AtNfs2 dimer and one SufEAtSufE1 model by using the default ClusPro parameters. Whereas in models of the first six ranked clusters the AtNfs2 and SufEAtSufE1 catalytic cysteine residues were at a distance of more than 37 Å, the seventh model corresponded to a model superimposable on the CsdA–CsdE crystal structure. The docking process was reiterated by imposing attraction of AtNfs2 and SufEAtSufE1 catalytic residues. In this case, the best ClusPro AtNfs2–SufEAtSufE1 model was similar to that of CsdA–CsdE. Thus, despite the unique conformation of helix D (and the loop between helices C and D; see above) in CsdA, the modes of interaction should be very similar in AtNfs2–SufEAtSufE1 and CsdA–CsdE. The positions of the putative hydrogen bonds between the two partners are retained, although the residues involved in the interactions are not strictly conserved.
4. Conclusion
AtNfs2 has the canonical dimeric structure of group II CDs, with the catalytic cysteine residue located in an extended lobe stabilized by a β-hairpin from the other monomer. While CDs from group I and II share similar catalytic properties (Kessler, 2006 ▶), the sulfur-transfer step is nevertheless very distinct. In group I, the long extended lobe is sufficiently flexible to transfer the sulfur moiety to the biological partner, which does not need flexibility. Recent studies show that this is opposite to the case in group II CDs (Kim & Park, 2013 ▶; Singh et al., 2013 ▶). Indeed, in the latter a β-hairpin constrains the enzyme active site in a ‘closed conformation’. For this reason, the biological partner (SufE) needs flexibility to acquire the S atom. Likewise, AtNfs2 needs AtSufE1 to enhance its activity and to efficiently deliver S atoms to scaffold proteins.
Supplementary Material
PDB reference: AtNfs2_C384S, 4q76
PDB reference: AtNfs2, 4q75
Acknowledgments
Access to the X-ray diffraction facilities of the Université de Lorraine is appreciated. We are grateful to the staff members of the PROXIMA1 beamline at the SOLEIL synchrotron (Saint-Aubin, France) and of the BM30A beamline at ESRF (Grenoble, France). The authors thank Dr C. S. Koh for helpful suggestions.
References
- Adams, P. D. et al. (2010). Acta Cryst. D66, 213–221.
- Chen, V. B., Arendall, W. B., Headd, J. J., Keedy, D. A., Immormino, R. M., Kapral, G. J., Murray, L. W., Richardson, J. S. & Richardson, D. C. (2010). Acta Cryst. D66, 12–21. [DOI] [PMC free article] [PubMed]
- Collins, R., Johansson, A. L., Karlberg, T., Markova, N., van den Berg, S., Olesen, K., Hammarström, M., Flores, A., Schüler, H., Schiavone, L. H., Brzezinski, P., Arnér, E. S. & Högbom, M. (2012). PLoS One, 7, e30581. [DOI] [PMC free article] [PubMed]
- Comeau, S. R., Gatchell, D. W., Vajda, S. & Camacho, C. J. (2004a). Bioinformatics, 20, 45–50. [DOI] [PubMed]
- Comeau, S. R., Gatchell, D. W., Vajda, S. & Camacho, C. J. (2004b). Nucleic Acids Res. 32, 96–99. [DOI] [PMC free article] [PubMed]
- Couturier, J., Touraine, B., Briat, J., Gaymard, F. & Rouhier, N. (2013). Front. Plant Sci. 4, 259. [DOI] [PMC free article] [PubMed]
- Couturier, J., Wu, H.-C., Dhalleine, T., Pégeot, H., Sudre, D., Gualberto, J. M., Jacquot, J.-P., Gaymard, F., Vignols, F. & Rouhier, N. (2014). Mol. Plant, 7, 187–205. [DOI] [PubMed]
- Cupp-Vickery, J. R., Urbina, H. & Vickery, L. E. (2003). J. Mol. Biol. 330, 1049–1059. [DOI] [PubMed]
- Emsley, P., Lohkamp, B., Scott, W. G. & Cowtan, K. (2010). Acta Cryst. D66, 486–501. [DOI] [PMC free article] [PubMed]
- Engh, R. A. & Huber, R. (1991). Acta Cryst. A47, 392–400.
- Evans, P. (2006). Acta Cryst. D62, 72–82. [DOI] [PubMed]
- Ikeuchi, Y., Shigi, N., Kato, J., Nishimura, A. & Suzuki, T. (2006). Mol. Cell, 21, 97–108. [DOI] [PubMed]
- Johnson, D. C., Dean, D. R., Smith, A. D. & Johnson, M. K. (2005). Annu. Rev. Biochem. 74, 247–281. [DOI] [PubMed]
- Kabsch, W. (2010). Acta Cryst. D66, 125–132. [DOI] [PMC free article] [PubMed]
- Kaiser, J. T., Clausen, T., Bourenkow, G. P., Bartunik, H. D., Steinbacher, S. & Huber, R. (2000). J. Mol. Biol. 297, 451–464. [DOI] [PubMed]
- Karplus, P. A. & Diederichs, K. (2012). Science, 336, 1030–1033. [DOI] [PMC free article] [PubMed]
- Kessler, D. (2006). FEMS Microbiol. Rev. 30, 825–840. [DOI] [PubMed]
- Kim, S. & Park, S. (2013). J. Biol. Chem. 288, 27172–27180. [DOI] [PMC free article] [PubMed]
- Kozakov, D., Beglov, D., Bohnuud, T., Mottarella, S. E., Xia, B., Hall, D. R. & Vajda, S. (2013). Proteins, 81, 2159–2166. [DOI] [PMC free article] [PubMed]
- Kozakov, D., Brenke, R., Comeau, S. R. & Vajda, S. (2006). Proteins, 65, 392–406. [DOI] [PubMed]
- Krieger, E., Joo, K., Lee, J., Lee, J., Raman, S., Thompson, J., Tyka, M., Baker, D. & Karplus, K. (2009). Proteins, 77, 114–122. [DOI] [PMC free article] [PubMed]
- Layer, G., Gaddam, S. A., Ayala-Castro, C. N., Ollagnier-de Choudens, S., Lascoux, D., Fontecave, M. & Outten, F. W. (2007). J. Biol. Chem. 282, 13342–13350. [DOI] [PubMed]
- Léon, S., Touraine, B., Briat, J.-F. & Lobréaux, S. (2002). Biochem. J. 366, 557–564. [DOI] [PMC free article] [PubMed]
- Lima, C. D. (2002). J. Mol. Biol. 315, 1199–1208. [DOI] [PubMed]
- Loiseau, L., Ollagnier-de Choudens, S., Lascoux, D., Forest, E., Fontecave, M. & Barras, F. (2005). J. Biol. Chem. 280, 26760–26769. [DOI] [PubMed]
- Marinoni, E. N., de Oliveira, J. S., Nicolet, Y., Raulfs, E. C., Amara, P., Dean, D. R. & Fontecilla-Camps, J. C. (2012). Angew. Chem. 51, 5439–5442. [DOI] [PubMed]
- Mihara, H. & Esaki, N. (2002). Appl. Microbiol. Biotechnol. 60, 12–23. [DOI] [PubMed]
- Mihara, H., Fujii, T., Kato, S., Kurihara, T., Hata, Y. & Esaki, N. (2002). J. Biochem. 131, 679–685. [DOI] [PubMed]
- Mueller, E. G. (2006). Nature Chem. Biol. 2, 185–194. [DOI] [PubMed]
- Mühlenhoff, U., Balk, J., Richhardt, N., Kaiser, J. T., Sipos, K., Kispal, G. & Lill, R. (2004). J. Biol. Chem. 279, 36906–36915. [DOI] [PubMed]
- Narayana Murthy, U., Ollagnier-de-Choudens, S., Sanakis, Y., Abdel-Ghany, S., Rousset, C., Ye, H., Fontecave, M., Pilon-Smits, E. & Pilon, M. (2007). J. Biol. Chem. 282, 18254–18264. [DOI] [PubMed]
- Omi, R., Kurokawa, S., Mihara, H., Hayashi, H., Goto, M., Miyahara, I., Kurihara, T., Hirotsu, K. & Esaki, N. (2010). J. Biol. Chem. 285, 12133–12139. [DOI] [PMC free article] [PubMed]
- Outten, F. W., Wood, M. J., Munoz, F. M. & Storz, G. (2003). J. Biol. Chem. 278, 45713–45719. [DOI] [PubMed]
- Pilon-Smits, E. A., Garifullina, G. F., Abdel-Ghany, S., Kato, S., Mihara, H., Hale, K. L., Burkhead, J. L., Esaki, N., Kurihara, T. & Pilon, M. (2002). Plant Physiol. 130, 1309–1318. [DOI] [PMC free article] [PubMed]
- Shi, R., Proteau, A., Villarroya, M., Moukadiri, I., Zhang, L., Trempe, J., Matte, A., Armengod, M. & Cygler, M. (2010). PLoS Biol. 8, 1–18. [DOI] [PMC free article] [PubMed]
- Singh, H., Dai, Y., Outten, F. W. & Busenlehner, L. S. (2013). J. Biol. Chem. 288, 36189–36200. [DOI] [PMC free article] [PubMed]
- Tirupati, B., Vey, J. L., Drennan, C. L. & Bollinger, J. M. (2004). Biochemistry, 43, 12210–12219. [DOI] [PubMed]
- Vagin, A. & Teplyakov, A. (2010). Acta Cryst. D66, 22–25. [DOI] [PubMed]
- Winn, M. D. et al. (2011). Acta Cryst. D67, 235–242.
- Xu, X. M. & Møller, S. G. (2006). EMBO J. 25, 900–909.
- Yamanaka, Y., Zeppieri, L., Nicolet, Y., Marinoni, E. N., de Oliveira, J. S., Odaka, M., Dean, D. R. & Fontecilla-Camps, J. C. (2013). Dalton Trans. 42, 3092–3099. [DOI] [PubMed]
- Ye, H., Abdel-Ghany, S. E., Anderson, T. D., Pilon-Smits, E. A. & Pilon, M. (2006). J. Biol. Chem. 281, 8958–8969. [DOI] [PubMed]
- Zhang, Y. (2008). BMC Bioinformatics, 9, 40. [DOI] [PMC free article] [PubMed]
- Zheng, L., White, R. H., Cash, V. L., Jack, R. F. & Dean, D. R. (1993). Proc. Natl Acad. Sci. USA, 90, 2754–2758. [DOI] [PMC free article] [PubMed]
Associated Data
This section collects any data citations, data availability statements, or supplementary materials included in this article.
Supplementary Materials
PDB reference: AtNfs2_C384S, 4q76
PDB reference: AtNfs2, 4q75