

SUMMARY
In auditory research, hearing function of mouse mutants is assessed in vivo by evoked potential recording. Evaluation of the response parameters should be performed with reference to the evoked responses recorded from wild-type mice. This study reports normative data calculated on auditory brainstem responses (ABRs) obtained from 20 wild-type C57 BL/6J mice at a postnatal age between 21 and 45 days. Acoustic stimuli consisted tone bursts at 8, 14, 20, 26, 32 kHz, and clicks. Each stimulus was delivered in free field at stimulation intensity starting from a maximum of 100 dB peak equivalent SPL (dB peSPL) at decreasing steps of 10 dB with a repetition rate of 13/sec. Evoked responses were recorded by needle electrodes inserted subcutaneously. At high intensity stimulation, five response waveforms, each consisting of a positive peak and a subsequent negative valley, were identified within 7 msec, and were labelled with sequential capital Roman numerals from I to V. Peak IV was the most robust and stable at low intensities for both tone burst and click stimuli, and was therefore utilized to estimate hearing thresholds. Both latencies and amplitudes of ABR peaks showed good reproducibility with acceptable standard deviations. Mean wave IV thresholds measured across all animals ranged from a maximum of 23 dB peSPL for clicks to a minimum of 7 dB peSPL for 20 kHz-tone burst stimuli. Statistical analysis of the distribution of latencies and amplitudes of peaks from I to V performed for each stimulus type yielded a normative data set which was utilised to obtain the most consistent fitting-curve model. This could serve as a reference for further studies on murine models of hearing loss.
KEY WORDS: Auditory brainstem responses, Mouse, Hearing threshold, Fitting curve, Confidence interval
RIASSUNTO
Nella ricerca di base sul sistema uditivo, la misura in vivo della sensibilità uditiva di un topo geneticamente mutato è determinata mediante la registrazione dei potenziali evocati uditivi e deve essere messa a confronto con i valori di riferimento ottenuti da topi di ceppo selvatico. Questo lavoro riporta i risultati della registrazione dei potenziali evocati uditivi del tronco encefalico (ABRs) in risposta a tone bursts (8, 14, 20, 26, 32 kHz) e a clicks su venti topi C57 BL/6J di età compresa tra 21 e 45 giorni. Gli stimoli acustici sono stati inviati in campo libero mediante un diffusore elettrostatico posizionato davanti all'orecchio dell'animale, a intensità decrescenti di 10 dB a partire da 100 dB peSPL, con una frequenza di ripetizione di 13/s. La risposta evocata è stata registrata mediante tre elettrodi ad ago inseriti sottocute. Ad elevate intensità di stimolazione, sono state identificate cinque onde nei primi 7 ms dalla presentazione dello stimolo, ciascuna costituita da un picco positivo e una successiva valle negativa, e sono state nominate con i numeri romani da I a V. La IV onda è risultata la più robusta e stabile, sia per il click che per i tone bursts, ed è stata quindi utilizzata per la stima di soglia uditiva. Per ciascun tipo di stimolo, i valori di latenza e ampiezza delle onde I-V sono risultati ben ripetibili, con deviazione standard accettabile. Il valore medio di soglia della IV onda è risultato pari a 23 dB peSPL per il click, mentre per i tone bursts si sono ottenute soglie inferiori, con valori compresi tra 22 e 7 dB peSPL, rispettivamente per gli stimoli a 8 e 20 kHz. È stata effettuata l'analisi statistica della distribuzione dei valori di latenza e di ampiezza delle onde I-V per ciascuno stimolo, allo scopo di ottenere gli intervalli di confidenza e creare modelli di previsione. I risultati di questo studio possono essere utilizzati come riferimento in successivi studi su modelli murini di sordità.
Introduction
Mice are broadly utilised in auditory research as a model to study any type of hearing loss. In the last decades, mouse genetics has made crucial contributions to the understanding of the molecular mechanisms of hearing in humans, since ~99% of murine genes have a human orthologue 1. The similarities in both anatomy and physiology of the auditory system between mice and humans, as well as many hereditary abnormalities of the inner ear, are indeed noteworthy 2 3.
Several studies on assessment of hearing function in humans and other animal species have been carried out with ABR recording because it is an easy-to-perform, low-cost and minimally-invasive technique that provides reliable estimation of the sensitivity of the auditory periphery. Auditory evoked potentials originating from the brainstem in mice are similar to those of humans 4, reflecting the synchronous short-latency synaptic activity of successive nuclei along the peripheral afferent auditory neural pathway. In the mouse, the normal response to supra-threshold stimuli appears as a series of four to five consecutive robust potentials, labelled with Roman numerals I-V. The first peak occurs approximately 1 msec after the stimulus onset while the fifth appears approximately 5 msec after stimulus onset. Wave I voltage arises from the cochlea and/or compound action potential of auditory nerve. Waves from II to V reflect the evoked activity at ascending generators in the auditory midbrain and are known to originate from cochlear nuclei, contralateral superior olivary complex, lateral lemniscus and contralateral lateral inferior colliculus 4 5.
Whereas in humans stimulation and recording parameters have been standardised for clinical purposes, thus providing reliable hearing threshold estimation 6, observations with regard to the mouse vary across laboratories or testing conditions, as standardisation of stimulation and recording parameters has not been achieved for non-human species. In humans, wave V occurs most consistently and is therefore used to assess hearing threshold 7, whereas in mice wave IV represents the most stable component of the ABR recordings. Besides species differences, other factors can influence both morphology and threshold levels in ABR recordings, such as electrode configuration, stimulation and recording parameters, as well as calibration of the acoustic stimulus 8.
The purpose of this study was to characterise auditory function and hearing sensitivity in mice through ABR recordings to obtain standardised values of latency, amplitude and hearing threshold. We used the C57 BL/6J strain because it is has a long lifespan, resistant to audiogenic seizures and develops age-related hearing loss. This strain has been extensively studied as a model of early onset and progressive human sensory presbycusis since mice show significant hearing loss for high frequencies at six months of age, and at 15 months they show no brainstem evoked responses for any type of stimulus at 80 dB SPL 9. Indeed, recent studies have shown that hearing loss is associated with reduced vascularisation and endothelial dysfunction, and therefore the strain apparently does not represent a strial presbycusis model 10. Furthermore, the C57 BL/6J strain has been utilised to study the relationship between periphery and central auditory cortex effects of ageing. Lastly, the C57 BL/6 strain is commonly used in the production of transgenic mice, as it is one of the most permissive backgrounds for maximal expression of most mutations. Therefore, the normative data reported in this study can be used as a reference for further investigations on murine models of hearing loss.
Materials and methods
Animals
Twenty C57 BL/6J mice (16 females, 4 males), obtained within the production facilities of the Charles River Laboratories in Italy, were subjected to monaural recording of ABR under anaesthesia. Recordings were performed in the laboratory of the animal house of the Venetian Institute of Molecular Medicine (VIMM) in Padua, Italy, in accordance with the "Principles of laboratory animal care" (NIH publication No. 86-23, revised 1985) and the criteria for prioritisation on validation studies were accepted by the European Partnership for alternative approaches to animal testing (EPAA). At recording time, their age range was 21-45 days and their weight was between 30 and 45 gm. The procedure lasted up to 60 min. No (apparent) signs of distress, such as weight loss, stereotypical behaviour, squeaking, scratching or eye-blinking, were observed in mice during and after recordings.
ABR procedure
Mice were anesthetised with zolazepam (40 mg/kg) together with xylazine (5 mg/kg) by intraperitoneal injection. The drugs used in this study had already been employed in earlier investigations and different animal species, and did not show any influence on latencies or amplitudes of responses 11. Only animals with otoscopic evidence of normal bilateral external and middle ear were used in this study. Mice were tested in a grounded Faraday cage (25x18x10 cm) contained in a light-proof sound isolation box (inner dimensions: 60x40x20 cm). Body temperature was kept at 37.5°C by a feedback-controlled heating pad.
Acoustic stimuli were generated by an arbitrary wave-form synthesiser (EM139B - UnaOhm) controlled by a personal computer, and consisted in click (100 μsec duration) and tone bursts (1 msec rise–fall time with 3 msec plateau) of 8, 16, 20, 26 and 32 kHz, with alternating polarity obtained with a real time phase inverter. Stimuli were delivered in the free field by an electrostatic speaker (Tucker Davis ES1, piloted by ED1 driver), positioned 4 cm from the mouse's ear. Since a previous study demonstrated no consistent left-right ear ABR asymmetry 12, we recorded auditory potentials from the left ear only, to increase the efficiency of data acquisition. Output stimuli were calibrated with a Behringer ECM8000 measurement microphone (mounted on the 800B Larson-Davis sound level meter), placed at the same distance of the mouse's ear. A maximum peSPL (re: 20 μPa) of 100 dB was employed for clicks and for 8, 14, 20, 26 kHz tone bursts, and 95 dB was employed for 32 kHz tone burst because of limited output of the speaker for this frequency. In order to avoid contralateral acoustic stimulation, the outer ear canal of the right ear was filled with condensation-vulcanising silicone mixed with hardener paste (Dreve Otoplastik Otoform A flex in double cartridges) delivered through a mixing cannulas (diameter 5.4 mm) and dispensed by one injector (Dreve Otoplastik DS50), as arranged in ear mould fitting. Four hundred stimuli, presented at the rate of 13 per sec, were recorded for each type of waveform and intensity level. For clicks and for 8, 14, 20, 26 kHz tone bursts, decreasing sound pressure levels of 10 dB were employed, starting from a maximum of 100 dB; for 32 kHz tone burst, the maximum intensity was 95 dB peSPL and the first decreasing step was 5 dB. Minimum intensity stimulation was reached at 10 dB peSPL for click and 8 kHz tone burst; for tone bursts at higher frequency (14, 20, 26 and 32 kHz), a further decreasing step of 9 dB could be delivered because of more favourable conditions of signal to noise ratio, up to a minimum level of 1 dB peSPL.
Responses were recorded through subcutaneous needle electrodes placed at the vertex (active), ventrolateral to the left ear (reference) and above the tail (ground). Biological signals were amplified (x 50,000), band pass filtered below 100 Hz and above 8000 Hz, and sent to a computer for analogue-to-digital conversion, which was performed at a sampling rate of 40,000 samples per sec. Responses were averaged and analysed within a post-stimulus window of 12 msec.
ABR waveform detection and analysis
LabWIEW software (National Instruments, ver. 8.0.1) was utilised for measurements and analysis of amplitude and latency of auditory evoked responses. In order to assist the observer in subjective ABR waves detection and analysis, two digital automatic algorithms were utilised 13-17:
Smoothing algorithm, consisted of a digital low-pass finite impulse response (FIR) filtering with equi-ripple characteristics based on the Parks-McClellan algorithm. The aim was to reduce noise and abrupt transitions in the temporal domain. Low-pass frequency was fixed at two octaves below the maximum frequency of the original signal. The smoothed trace obtained could be superimposed to the original trace on the computer display.
Peaks and valleys detector, based on an algorithm that fits a quadratic polynomial curve to sequential groups of data points; the number of data points used in the fit was 3.
Peak latencies were determined relative to the onset of the acoustic stimulus. Wave amplitudes were calculated by the peak detector algorithm as the difference between the two values represented by response maxima (peak) and subsequent minima (valley). Threshold was defined as the lowest sound pressure level at which any peak can be recognised. The detection of peaks was confirmed by comparing the ABR patterns with two or three suprathreshold ABR waveforms displayed on the computer screen. Final judgment of threshold was made from records off-line by two experimentally experienced observers.
If no ABR wave was detected at maximum intensity stimulation, a nominal threshold of 110 dB peSPL was assigned. If an ABR wave was detected at minimum peSPL of 1 or 10 dB, a nominal threshold at the same level was assigned.
Statistical analysis
SPSS statistics software (version 17 for Windows) was utilised for statistical analysis. All data obtained from the peak detection procedure were analysed for group arithmetic means and standard deviations. T-tests were used for comparing means of ABR thresholds.
For each acoustic stimulus, slope functions of both latency and amplitude of ABR peaks versus stimulus intensity level were calculated using five different fitting curve procedures of regression analysis:
- linear
- quadratic (second order polynomial)
- power
- growth
- exponential
where y is the dependent variable (latency or amplitude of ABR peak), a0 is a numeric constant, a1 and a2 are regression coefficients, and x is the independent variable (acoustic stimulus intensity).
In order to select the most reliable model in predicting fitting curve, the values of the coefficient of determination, R2, were compared between the five fitting procedures. Once the best procedure was identified, prediction limits were calculated for individual additional observations and drawn at the default level of 95% confidence.
Results
ABR waveforms recorded from all mice were similar regardless of the type of acoustic stimulus utilised. Representative recordings to clicks and to 20 kHz tone bursts obtained from one representative mouse are reported in Figure 1. At maximum stimulation intensities, 100 and 95 dB peSPL, five distinct vertex-positive waveforms (waves I–V) were identifiable within the first 7 msec after stimulus onset. Two further waves following wave V, waves VI and VII, were detectable in less than 50% of the recordings and were therefore not considered; no other subsequent waves were detected within 12 msec after the delivery of the acoustic stimulus. Peak latencies increased and amplitudes decreased with decreasing stimulus level, but the different components of ABR are affected differently. The decrease in stimulus intensity caused the amplitude of peaks I and III to decrease more than that of peaks II and IV. This means that at very low stimulus intensities only peaks II and IV were discernible.
Fig. 1.
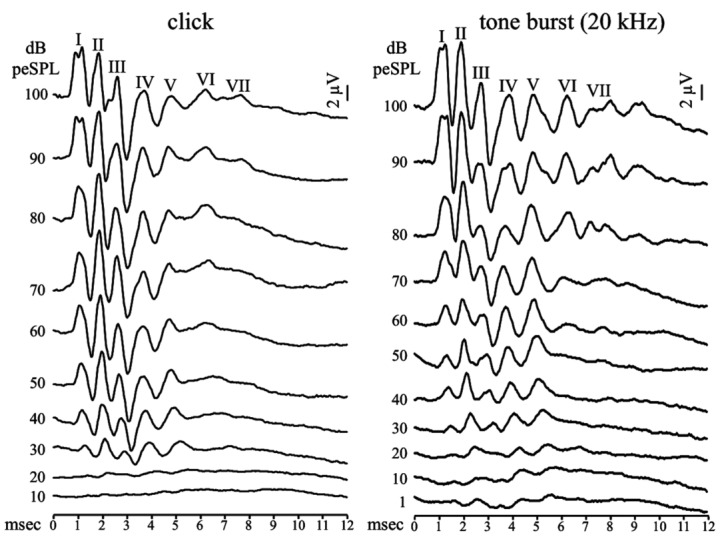
ABR recordings in response to click (left panel) and 20 kHz tone burst (right panel) stimuli at decreasing intensity levels from one representative C57 BL/6J mouse at postnatal age of 21 days. The first seven positive peaks of the response identified after the onset of the acoustic stimulus delivered at maximum intensity stimulation of 100 dB peSPL are labelled with sequential Roman numerals I-VII. In this mouse an evoked response is clearly identifiable as low as 20 dB peSPL for click stimuli and 1 dB peSPL for 20 kHz tone bursts.
Figure 2 shows the percentage of wave occurrence at decreasing stimulation intensity for both clicks and tone bursts. Waves II and IV were present in most cases, followed by waves I, III and V. Wave IV was the most stable evoked response at all intensity levels for all types of stimuli, as it was identifiable in 100% of animals at intensities higher than 30 dB peSPL. At intensity of 1 dB peSPL delivered for 14, 20 and 26 kHz tone burst stimuli, peak IV was still present in 20%, 30% and 55% of animals respectively. Waves I, II and III were not as robust as wave IV, although they showed high amplitude for all types of stimuli. Wave V was recorded less frequently; in addition, in some cases it could not be reliably identified. Since wave IV appeared as the most robust ABR component, it was used to estimate the hearing threshold. Mean wave IV thresholds (with standard deviation, ±SD) in response to clicks and 8, 14, 20, 26 and 32 kHz tone bursts were, respectively, 23 (± 8.4) and 22 (± 8.8), 11 (± 7.6), 7 (± 6.0), 8 (± 8.8) and 19 (± 7.5) dB peSPL.
Fig. 2.

Percentage of ABR peak occurrence (waves I to V) at decreasing intensity levels for clicks and tone bursts. Peak IV is the most stable response at all intensity levels and for all types of stimulus, being identifiable in 100% of animals at intensities as low as 40 dB peSPL. At minimum intensity of 1 dB peSPL delivered for 14, 20 and 26 kHz tone burst stimuli, peak IV was still detected in 20%, 30% and 55% of animals, respectively.
Table I reports means and standard deviations (in brackets) of latency and amplitude values of ABR peaks I–V calculated across animals for all stimulus types at intensities of 90, 60 and 30 dB peSPL. At high intensity (90 dB SPL), latencies of all waves progressively increased at decreasing tone-burst frequency. When considering wave IV peak latency, mean values rose from 4.18 msec as measured at 32 kHz, to 4.27 and 4.47 msec as measured at 20 kHz and 8 kHz, respectively. For click stimulation, wave latencies are even shorter than those obtained during 32 kHz tone burst stimulation, because of the synchronous activation of the whole cochlear partition induced by the broadband stimulus.
Table I.
Mean values with standard deviation (in brackets) of latencies and amplitudes together with the percentage of occurrence of ABR peaks I–V obtained across animals in response to clicks and tone bursts delivered at intensities of 90, 60 and 30 dB peSPL. Standard deviations calculated for latencies are lower than the corresponding values calculated for amplitudes.
| I | II | III | IV | V | |||||||||||||
|---|---|---|---|---|---|---|---|---|---|---|---|---|---|---|---|---|---|
| dB SPL | occurence | lat | amp | occurence | lat | amp | occurence | lat | amp | occurence | lat | amp | occurence | lat | amp | ||
| click | 90 | 100% | 1.19 (0.11) |
3.86 (2.83) |
100% | 2.02 (0.25) |
5.61 (2.78) |
100% | 2.97 (0.31) |
5.18 (2.06) |
100% | 4.16 (0.50) |
2.14 (1.75) |
85% | 5.21 (0.47) |
1.58 (1.05) |
|
| 60 | 95% | 1.33 (0.14) |
2.64 (1.61) |
100% | 2.22 (0.24) |
3.67 (1.47) |
95% | 3.16 (0.29) |
2.90 (1.19) |
100% | 4.31 (0.46) |
1.33 (0.80) |
80% | 5.48 (0.57) |
1.58 (0.69) |
||
| 30 | 20% | 1.72 (0.16) |
0.16 (0.11) |
65% | 2.67 (0.36) |
0.27 (0.14) |
20% | 3.42 (0.08) |
0.21 (0.09) |
100% | 5.08 (0.58) |
0.19 (0.08) |
40% | 5.96 (0.48) |
0.23 (0.13) |
||
| tone bursts | 8 kHz | 90 | 80% | 1.63 (0.13) |
1.67 (1.26) |
100% | 2.34 (0.27) |
2.40 (1.26) |
100% | 3.19 (0.36) |
2.16 (0.95) |
100% | 4.47 (0.50) |
1.32 (0.61) |
75% | 5.63 (0.69) |
1.06 (0.69) |
| 60 | 80% | 1.88 (0.14) |
0.59 (0.32) |
95% | 2.68 (0.31) |
0.71 (0.30) |
100% | 3.44 (0.32) |
0.66 (0.30) |
100% | 4.75 (0.52) |
0.69 (0.33) |
80% | 6.15 (0.70) |
0.61 (0.27) |
||
| 30 | 10% | 2.50 (0.18) |
0.22 (0.07) |
55% | 3.83 (0.50) |
0.22 (0.13) |
20% | 4.28 (0.32) |
0.13 (0.08) |
90% | 5.81 (0.71) |
0.25 (0.13) |
20% | 6.77 (0.27) |
0.18 (0.08) |
||
| 14 kHz | 90 | 85% | 1.43 (0.11) |
3.01 (1.75) |
100% | 2.18 (0.26) |
3.83 (1.71) |
100% | 3.10 (0.33) |
3.69 (1.71) |
100% | 4.36 (0.49) |
1.78 (1.27) |
90% | 5.33 (0.53) |
1.44 (1.14) |
|
| 60 | 90% | 1.63 (0.13) |
0.85 (0.45) |
100% | 2.42 (0.28) |
1.47 (0.65) |
100% | 3.34 (0.36) |
1.07 (0.49) |
100% | 4.64 (0.50) |
0.67 (0.34) |
70% | 5.79 (0.50) |
0.79 (0.33) |
||
| 30 | 45% | 2.03 (0.19) |
0.20 (0.06) |
85% | 3.01 (0.39) |
0.27 (0.13) |
65% | 3.97 (0.42) |
0.27 (0.15) |
100% | 5.31 (0.66) |
0.30 (0.11) |
65% | 6.75 (0.67) |
0.31 (0.15) |
||
| 20 kHz | 90 | 95% | 1.29 (0.12) |
2.71 (1.82) |
100% | 2.08 (0.26) |
3.48 (1.65) |
95% | 3.00 (0.31) |
3.58 (1.65) |
100% | 4.27 (0.50) |
1.67 (1.34) |
85% | 5.17 (0.50) |
1.64 (1.09) |
|
| 60 | 95% | 1.46 (0.15) |
0.89 (0.63) |
100% | 2.26 (0.29) |
1.70 (0.59) |
100% | 3.23 (0.37) |
1.19 (0.60) |
100% | 4.43 (0.51) |
0.60 (0.43) |
75% | 5.46 (0.53) |
0.94 (0.53) |
||
| 30 | 65% | 1.75 (0.12) |
0.26 (0.13) |
95% | 2.71 (0.40) |
0.47 (0.19) |
65% | 3.67 (0.49) |
0.31 (0.16) |
100% | 5.06 (0.56) |
0.28 (0.17) |
65% | 6.47 (0.70) |
0.31 (0.14) |
||
| 26 kHz | 90 | 95% | 1.21 (011) |
3.49 (1.55) |
100% | 2.03 (0.27) |
3.60 (1.16) |
100% | 2.96 (0.34) |
2.85 (1.64) |
100% | 4.23 (0.41) |
1.19 (0.89) |
70% | 5.16 (0.43) |
1.19 (0.90) |
|
| 60 | 95% | 1.39 (0.19) |
1.25 (0.66) |
100% | 2.16 (0.31) |
1.85 (0.54) |
100% | 3.20 (0.39) |
1.20 (0.73) |
100% | 4.39 (0.44) |
0.59 (0.36) |
70% | 5.44 (0.63) |
0.98 (0.59) |
||
| 30 | 55% | 1.74 (0.25) |
0.28 (0.13) |
95% | 2.62 (0.33) |
0.40 (0.14) |
85% | 3.73 (0.49) |
0.23 (0.12) |
100% | 5.00 (0.59) |
0.31 (0.17) |
50% | 6.03 (0.73) |
0.39 (0.15) |
||
| 32 kHz | 90 | 95% | 1.21 (0.15) |
3.53 (1.45) |
100% | 2.01 (0.31) |
3.66 (1.18) |
100% | 2.98 (0.38) |
2.47 (1.57) |
100% | 4.18 (0.45) |
1.31 (0.86) |
70% | 4.97 (0.61) |
1.09 (0.87) |
|
| 60 | 80% | 1.42 (0.23) |
0.93 (0.61) |
95% | 2.17 (0.30) |
1.24 (0.68) |
95% | 3.26 (0.44) |
0.91 (0.62) |
100% | 4.57 (0.63) |
0.31 (0.15) |
60% | 5.67 (0.88) |
0.67 (0.38) |
||
| 30 | 20% | 1.83 (0.18) |
0.13 (0.10) |
85% | 3.01 (0.52) |
0.32 (0.15) |
45% | 4.15 (0.56) |
0.17 (0.10) |
100% | 5.55 (0.88) |
0.25 (0.15) |
45% | 6.58 (0.87) |
0.37 (0.22) |
||
In contrast, when considering low stimulus intensity (30 dB peSPL), wave latencies were shorter for the tone-burst frequencies yielding the lowest thresholds. Thus, the shortest latencies were observed at tone-burst frequencies from 20 to 26 kHz (5.0 msec), while they were longer at higher and lower frequencies latencies. For click stimulation, wave latency were similar to that observed at frequencies of 20 and 26 kHz.
With regard to amplitudes, our results show an extremely high variability for all types of stimuli and were thus not considered for statistical analysis.
Fitting curve procedures were utilised to predict the behaviour of peak latency. Several regression models were tested (see Methods). For each model, regression coefficients and R2 values are shown in Table II. Although all fitting procedures yielded high R2 values, the quadratic model was the most reliable in predicting wave latencies. Therefore, it was utilised to estimate confidence prediction limits for means. Figure 3 reports individual latency values together with binomial second-order fitting curves calculated for all ABR waves as a function of click intensity; confidence limits indicate the latency range in which any additional observation is expected to fall.
Table II.
Fitting curve analysis of ABR latencies (peaks I-V) across all stimulus intensities. Five models of fitting curves are utilised, where y is the dependent variable (latency of ABR peak), a0 is a numeric constant, a1 and a2 are regression coefficients, and x is the independent variable (acoustic stimulus intensity). Bold font refers to the highest R2 value within the five procedures used.
| click | 8 kHz | 14 kHz | 20 kHz | 26 kHz | 32 kHz | |||||||||||||||||||||
|---|---|---|---|---|---|---|---|---|---|---|---|---|---|---|---|---|---|---|---|---|---|---|---|---|---|---|
| LATENCIES | fitting | R2 | a0 | a1 | a2 | R2 | a0 | a1 | a2 | R2 | a0 | a1 | a2 | R2 | a0 | a1 | a2 | R2 | a0 | a1 | a2 | R2 | a0 | a1 | a2 | |
| I | linear | 0.453 | 1.709 | -0.006 | --- | 0.709 | 2.704 | -0.012 | --- | 0.641 | 2.135 | -0.008 | --- | 0.571 | 1.933 | -0.007 | --- | 0.572 | -2.026 | 0.061 | --- | 0.437 | 2.018 | -0.009 | --- | |
| quadratic | 0.469 | 1.956 | -0.014 | 0 | 0.746 | 3.404 | -0.034 | 0 | 0.669 | 2.425 | -0.018 | 0 | 0.586 | 2.109 | -0.014 | 0 | 0,582 | -0.535 | 0.010 | 0 | 0.451 | 2.358 | 0.000 | -0.02 | ||
| power | 0.464 | 4.299 | -0.288 | --- | 0.739 | 11.118 | -0.429 | --- | 0.668 | 5.148 | -0.283 | --- | 0.574 | 4.159 | -0.258 | --- | 0,711 | 0.000 | 2.372 | --- | 0.476 | 6.829 | -0.385 | --- | ||
| growth | 0.457 | 0.564 | -0.004 | --- | 0.720 | 1.055 | -0.006 | --- | 0.655 | 0.787 | -0.005 | --- | 0.592 | 0.683 | -0.005 | --- | 0.709 | -2.409 | 0.040 | --- | 0.467 | 0.747 | -0.006 | --- | ||
| exponential | 0.457 | 1.757 | -0.004 | --- | 0.720 | 2.873 | -0.006 | --- | 0.655 | 2.196 | -0.005 | --- | 0.592 | 1.979 | -0.005 | --- | 0.709 | 0.90 | 0.040 | --- | 0.467 | 2.111 | -0.006 | --- | ||
| II | linear | 0.288 | 2.713 | -0.008 | --- | 0.587 | 3.706 | -0.014 | --- | 0.471 | 3.113 | -0.010 | --- | 0.416 | 2.906 | -0.009 | --- | 0.677 | -1.487 | 0.059 | --- | 0.221 | 2.815 | -0.009 | --- | |
| quadratic | 0.302 | 3.099 | -0.020 | 0 | 0.613 | 4.460 | -0.038 | 0 | 0.513 | 3.634 | -0.027 | 0 | 0.454 | 3.316 | -0.024 | 0 | 0.678 | -0.965 | 0.041 | 0 | 0.259 | 3.571 | -0.034 | 0 | ||
| power | 0.290 | 5.711 | -0.232 | --- | 0.608 | 11.589 | -0.349 | --- | 0.491 | 6.360 | -0.231 | --- | 0.435 | 5.474 | -0.212 | --- | 0.778 | 0.001 | 1.891 | --- | 0.255 | 5.923 | -0.238 | --- | ||
| growth | 0.280 | 1.018 | -0.004 | --- | 0.594 | 1.350 | -0.005 | --- | 0.464 | 1.150 | -0.004 | --- | 0.410 | 1.079 | -0.004 | --- | 0.729 | -1.418 | 0.031 | --- | 0.227 | 1.039 | -0.004 | --- | ||
| exponential | 0.280 | 2.767 | -0.004 | --- | 0.594 | 3.858 | -0.005 | --- | 0.464 | 3.158 | -0.004 | --- | 0.410 | 2.941 | -0.004 | --- | 0.729 | 0.242 | 0.031 | --- | 0.227 | 2.827 | -0.004 | --- | ||
| III | linear | 0.262 | 3.713 | -0.008 | --- | 0.367 | 4.365 | -0.012 | --- | 0.383 | 3.925 | -0.008 | --- | 0.409 | 4.041 | -0.011 | --- | 0.472 | -1.581 | 0.050 | --- | 0.331 | 4.218 | -0.013 | --- | |
| quadratic | 0.273 | 4.095 | -0.020 | 0 | 0.445 | 5.742 | -0.055 | 0 | 0.428 | 4.447 | -0.026 | 0 | 0.461 | 4.630 | -0.032 | 0 | 0.488 | 0.077 | -0.007 | 0 | 0.350 | 4.900 | -0.036 | 0 | ||
| power | 0.263 | 6.453 | -0.173 | --- | 0.399 | 9.050 | -0.225 | --- | 0.410 | 6.282 | -0.152 | --- | 0.439 | 6.929 | -0.182 | --- | 0.531 | 0.000 | 2.190 | --- | 0.321 | 9.100 | -0.246 | --- | ||
| growth | 0.256 | 1.324 | -0.003 | --- | 0.362 | 1.484 | -0.003 | --- | 0.376 | 1.373 | -0.002 | --- | 0.402 | 1.401 | -0.003 | --- | 0.528 | -2.389 | 0.037 | --- | 0.306 | 1.455 | -0.004 | --- | ||
| exponential | 0.256 | 3.760 | -0.003 | --- | 0.362 | 4.412 | -0.003 | --- | 0.376 | 3.947 | -0.002 | --- | 0.402 | 4.058 | -0.003 | --- | 0.528 | 0.092 | 0.037 | --- | 0.306 | 4.285 | -0.004 | --- | ||
| IV | linear | 0.141 | 4.958 | -0.009 | --- | 0.244 | 5.732 | -0.012 | --- | 0.253 | 5.303 | -0.009 | --- | 0.204 | 5.146 | -0.009 | --- | 0.298 | -0.440 | 0.018 | --- | 0.184 | 5.189 | -0.011 | --- | |
| quadratic | 0.149 | 5.425 | -0.023 | 0 | 0.269 | 6.727 | -0.043 | 0 | 0.276 | 5.808 | -0.027 | 0 | 0.258 | 5.835 | -0.034 | 0 | 0.342 | 0.844 | -0.026 | 0 | 0.198 | 5.801 | -0.031 | 0 | ||
| power | 0.151 | 7.556 | -0.133 | --- | 0.251 | 9.837 | -0.160 | --- | 0.276 | 7.664 | -0.120 | --- | 0.231 | 7.202 | -0.113 | --- | 0.180 | 0.005 | 1.132 | --- | 0.190 | 8.246 | -0.149 | --- | ||
| growth | 0.145 | 1.608 | -0.002 | --- | 0.238 | 1.751 | -0.003 | --- | 0.256 | 1.672 | -0.002 | --- | 0.194 | 1.636 | -0.002 | --- | 0.185 | -1.959 | 0.019 | --- | 0.175 | 1.650 | -0.002 | --- | ||
| exponential | 0.145 | 4.992 | -0.002 | --- | 0.238 | 5.761 | -0.003 | --- | 0.256 | 5.323 | -0.002 | --- | 0.194 | 5.135 | -0.002 | --- | 0.185 | 0.141 | 0.019 | --- | 0.175 | 5.205 | -0.002 | --- | ||
| V | linear | 0.196 | 6.567 | 0.015 | --- | 0.056 | 6.655 | -0.009 | --- | 0.409 | 7.054 | -0.018 | --- | 0.115 | 6.138 | -0.009 | --- | 0.046 | 0.494 | 0.006 | --- | 0.107 | 6.514 | -0.014 | --- | |
| quadratic | 0.196 | 6.438 | 0.011 | 0 | 0.061 | 7.309 | -0.029 | 0 | 0.432 | 7.819 | -0.044 | 0 | 0.115 | 6.201 | -0.012 | 0 | 0.046 | 0.486 | 0.006 | 0 | 0.118 | 7.421 | -0.044 | 0 | ||
| power | 0.194 | 11.094 | -0.167 | --- | 0.051 | 9.012 | -0.098 | --- | 0.423 | 12.345 | -0.182 | --- | 0.077 | 7.423 | -0.074 | --- | 0.016 | 0.204 | 0.291 | --- | 0.124 | 10.633 | -0.157 | --- | ||
| growth | 0.206 | 1.893 | -0.003 | --- | 0.048 | 1.889 | -0.001 | --- | 0.407 | 1.964 | -0.003 | --- | 0.105 | 1.806 | -0.002 | --- | 0.015 | -0.701 | 0.005 | --- | 0.114 | 1.880 | -0.002 | --- | ||
| exponential | 0.206 | 6.639 | -0.003 | --- | 0.048 | 6.610 | -0.001 | --- | 0.407 | 7.129 | -0.003 | --- | 0.105 | 6.087 | -0.002 | --- | 0.015 | 0.496 | 0.005 | --- | 0.114 | 6.553 | -0.002 | --- | ||
Fig. 3.
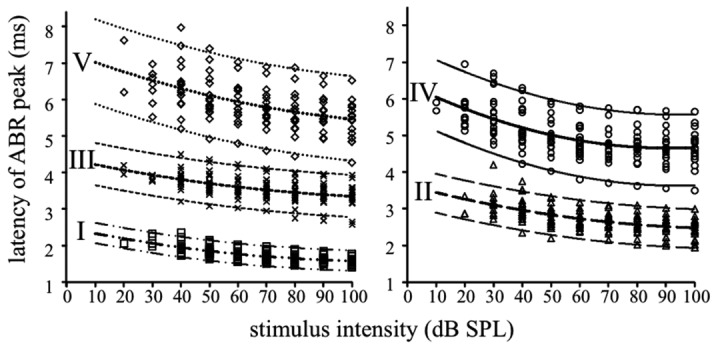
Individual latency values calculated for all ABR waves (wave I, diamonds; wave II, triangles; wave III, crosses; wave IV, circles; wave V, squares) are plotted as a function of click intensity. Lines represent the quadratic (binomial second order) fitting curves for the latencies of each peak, with the 95% confidence prediction limit for mean, that indicates the region in which 95% of any additional observations are expected to lie.
Discussion
The recordings obtained in our investigation are similar to those described in the literature in terms of number of waves (I–VII) 18. With regard to the response thresholds, the intensity levels obtained in our study indicated that the most sensitive frequency range for the mouse C57 BL/6 was between 20 and 26 kHz. Therefore, our values are lower compared to the thresholds reported by other authors in the same strain of mouse at the age between three 19 and 33 12 weeks. We have no explanation for these differences; one possible reason may be related to differences in the noise of the biological amplifier 11 20 21.
With regard to amplitudes, our results showed an extremely high variability of ABR waves for all types of stimuli and intensities. This is in agreement with other studies 22-24 and has been explained on the basis of the non-stationary nature of background noise 24. In contrast, latency values appeared to be much more reliable and were therefore used for obtaining prediction models. Fitting curve procedures utilised to predict the behaviour of peak latencies yielded high R2 values, particularly when using binomial second order fitting. This was similar to the results obtained by Arslan et al. 25 for ABR recordings obtained from human ears.
Conclusion
Compared to previous studies, normative ABR data obtained in our laboratory indicate higher sensitivity of the auditory system of the C57 BL/6 mice since ABR thresholds resulted to be lower than previously reported. Mean threshold levels of the ABR responses establish a reliable reference for hearing sensitivity in young C57BL6/J mice and the wave IV appears to be the most consistent indicator. The quadratic regression model is the most effective in predicting the behaviour of peak latencies across different stimulation levels, and could be used as a reference for comparing ABR latencies values obtained from mutant mouse strains. In conclusion, this study provides normative data for further studies on murine models of hearing loss.
References
- 1.Brown SD, Hardisty-Hughes RE, Mburu P. Quiet as a mouse: dissecting the molecular and genetic basis of hearing. Nat Rev Genet. 2008;9:277–290. doi: 10.1038/nrg2309. [DOI] [PubMed] [Google Scholar]
- 2.Steel KP, Bock GR. Hereditary inner-ear abnormalities in animals. Relationships with human abnormalities. Arch Otolaryngol. 1983;109:22–29. doi: 10.1001/archotol.1983.00800150026005. [DOI] [PubMed] [Google Scholar]
- 3.Brown SD, Steel KP. Genetic deafness - progress with mouse models. Hum Mol Genet. 1994;3(suppl 1):1453–1456. doi: 10.1093/hmg/3.suppl_1.1453. [DOI] [PubMed] [Google Scholar]
- 4.Parham K, Sun X-M, Kim DO. Noninvasive assessment of auditory function: distortion product otoacoustic emissions and auditory brainstem responses exposure to an augmented acoustic environment ameliorates age-related auditory changes. In: Willot JF, editor. Handbook of mouse auditory research: from behavior to molecular biology. Boca Raton, Fla: CRC Press; 2001. pp. 37–58. [Google Scholar]
- 5.Henry KR. Auditory brainstem volume-conducted responses: origins in the laboratory mouse. J Am Aud Soc. 1979;4:173–178. [PubMed] [Google Scholar]
- 6.Sininger YS, Cone-Wesson B. Threshold prediction using auditory brainstem response and steady-state evoked potentials with infants and young children. In: Katz J, editor. Handbook of Clinical Audiology. Fifth edition. Baltimore, MD: Lippincott, Williams and Wilkins; 2002. pp. 306–307. [Google Scholar]
- 7.Arslan E, Prosser S, Conti G, et al. Electrocochleography and brainstem potentials in the diagnosis of the deaf child. Int J Pediatr Otorhinolaryngol. 1983;5:251–259. doi: 10.1016/s0165-5876(83)80037-8. [DOI] [PubMed] [Google Scholar]
- 8.Braun V, Richter HP. Influence of blood supply, thermal and mechanical traumata on hearing function in an animal model. Acta Neurochir (Wien) 1996;138:977–982. doi: 10.1007/BF01411288. [DOI] [PubMed] [Google Scholar]
- 9.Ohlemiller KK. Mechanisms and genes in human strial presbycusis from animal models. Brain Research. 2009;1277:70–83. doi: 10.1016/j.brainres.2009.02.079. [DOI] [PMC free article] [PubMed] [Google Scholar]
- 10.Fetoni AR, Picciotti PM, Paludetti G, et al. Pathogenesis of presbycusis in animal models: A review. Exp Gerontol. 2011;46:413–425. doi: 10.1016/j.exger.2010.12.003. [DOI] [PubMed] [Google Scholar]
- 11.Looij MAJ, Liem S-S, Burg H, et al. Impact of conventional anesthesia on auditory brainstem responses in mice. Hear Res. 2004;193:75–82. doi: 10.1016/j.heares.2004.02.009. [DOI] [PubMed] [Google Scholar]
- 12.Zheng QY, Johnson KR, Erway LC. Assessment of hearing in 80 inbred strains of mice by ABR threshold analyses. Hear Res. 1999;130:94–107. doi: 10.1016/s0378-5955(99)00003-9. [DOI] [PMC free article] [PubMed] [Google Scholar]
- 13.Baher H. Analog & digital signal processing. Second ed. New York: Wiley; 2001. [Google Scholar]
- 14.Burden RL, Faires JD. Numerical analysis. Eighth ed. Belmont, CA, USA: Thomson Brooks/Cole Ed.; 2005. [Google Scholar]
- 15.Chen CH. Signal processing handbook. New York: Marcel Dekker; 1988. [Google Scholar]
- 16.Parks TW, Burrus CS. Digital filter design. New York: Wiley; 1987. [Google Scholar]
- 17.Pearson CE. Numerical Methods in Engineering and Science. Sixth Ed. NewYork: Van Nostrand Reinhold Co.; 1986. [Google Scholar]
- 18.Shvarev YN. Brainstem auditory evoked potentials characteristics in mice: the effect of genotype. Hear Res. 1994;81:189–198. doi: 10.1016/0378-5955(94)90164-3. [DOI] [PubMed] [Google Scholar]
- 19.Song L, McGee J, Walsh EJ. Frequency- and level-dependent changes in auditory brainstem responses (ABRS) in developing mice. J Acoust Soc Am. 2006;119:2242–2257. doi: 10.1121/1.2180533. [DOI] [PubMed] [Google Scholar]
- 20.Willott JF, Erway LC. Genetics of age-related hearing loss in mice. IV. Cochlear pathology and hearing loss in 25 BXD recombinant inbred mouse strains. Hear Res. 1998;119:27–36. doi: 10.1016/s0378-5955(98)00029-x. [DOI] [PubMed] [Google Scholar]
- 21.Lang H, Schulte BA, Schmiedt RA. Endocochlear potentials and compound action potential recovery: functions in the C57BL/6J mouse. Hear Res. 2002;172:118–126. doi: 10.1016/s0378-5955(02)00552-x. [DOI] [PubMed] [Google Scholar]
- 22.Elberling C, Don M. Quality estimation of averaged auditory brainstem responses. Scand Audiol. 1984;13:187–197. doi: 10.3109/01050398409043059. [DOI] [PubMed] [Google Scholar]
- 23.Don M, Ponton CW, Eggermont JJ, et al. Auditory brainstem response (ABR) peak amplitude variability reflects individual differences in cochlear response times. J Acoust Soc Am. 1994;96:3476–3491. doi: 10.1121/1.410608. [DOI] [PubMed] [Google Scholar]
- 24.Don M, Elberling C. Use of quantitative measures of auditory brain-stem response peak amplitude and residual background noise in the decision to stop averaging. J Acoust Soc Am. 1996;99:491–499. doi: 10.1121/1.414560. [DOI] [PubMed] [Google Scholar]
- 25.Arslan E, Prosser S, Rosignoli M. The behaviour of wave V latency in cochlear hearing loss. Acta Otolaryngol. 1988;105:467–472. doi: 10.3109/00016488809119503. [DOI] [PubMed] [Google Scholar]