

Abstract
We mapped the cytokine response to hematopoietic stem cell transplantation (HSCT) by assaying 51 cytokines and chemokines each week for 100 days in 51 children receiving allogeneic (n = 44) or autologous HSCT (n = 7). Assay values were reported as mean fluorescence intensity (MFI). Log transformation converted MFI to clinically relevant measures (ie, pg/mL). We searched for potential markers of transplant complications by using mixed treatment by subject analysis of variance. Global cytokine secretion in HSCT recipients was significantly lower than in concurrent control patients (n = 11). Coincident with the nadir in WBC count, the concentration of many cytokines declined further by the second and third week. All analytes (except monokine induced by gamma interferon [MIG]) subsequently rebounded by week 4 (coincident with engraftment and recovery of WBC count) but often still remained well below control levels. Concurrent with the collective nadir of multiple cytokines, monocyte chemoattractant protein 1 (MCP-1), growth-regulated oncogene alpha (GRO-a), and leptin surged during weeks 2 to 4. High levels of leptin persisted throughout the 100 post-transplant days. Also during weeks 2 to 4, hepatocyte growth factor (HGF) and IL-6 surged in children with complications but not in those without complications. The peak in HGF was more pronounced in veno-occlusive disease (VOD). HGF and IL-6 secretion rose at least 2 weeks before the clinical diagnosis of VOD or graft-versus-host disease (GVHD). From week 4 onward in all groups, the MFI of the cytokine resistin increased to 5 to 15 times above concurrent control. HGF has now emerged in 3 or more biomarker discovery efforts for GVHD (and in our population for VOD as well). HGF (with or without IL-6) should be investigated as a potential predictive biomarker of VOD or GVHD. Alternatively, the hyperinflammatory “signature” provided by a multicytokine assay may be predictive.
Keywords: Cytokines, Bone marrow transplantation, Hepatocyte growth factor, Veno-occlusive disease, Graft-versus-host disease
INTRODUCTION
Allogeneic hematopoietic stem cell transplantation (HSCT) induces changes in the cytokine milieu that may contribute to the minor and major complications experienced by many HSCT recipients. We mapped the cytokine response to transplantation in 51 children by assaying 51 cytokines and chemokines each week for the first 100 days after the transplantation procedure. Longitudinal data of this sort had previously been obtained for only a handful of cytokines and over a limited time period. With aggregate data we propose a characteristic pattern or “signature” of cytokine secretion after transplantation and suggest potential candidate markers and therapeutic targets for hepatic veno-occlusive disease (VOD; sinusoidal obstruction syndrome) and graft-versus-host disease (GVHD).
METHODS
Eligible subjects were children (0 to 18 years of age) who were impending recipients of HSCT at Children’s Hospital Los Angeles and at Lucile Packard Children’s Hospital at Stanford University. Fifty-one children (age 8.7 ± 5.9 years, 30 boys, 21 girls) were enrolled after obtaining parental informed consent in accordance with a protocol approved by the Institutional Review Boards at both institutions. Forty-four received allogeneic transplants, and 7 were recipients of an autologous HSCT. Their primary diagnoses are listed in Table 1. There were 5 deaths: 2 from relapsed leukemia and 3 from respiratory failure.
Table 1.
Diagnoses in Children (N = 51) Receiving HSCT
| Allogeneic Transplantation | Autologous Transplantation |
|---|---|
| Acute lymphocytic leukemia (5) | Hodgkin lymphoma (2) |
| Acute myelogenous leukemia (10) | Neuroblastoma (3) |
| Biphenotypic leukemia (2) | Retinoblastoma (1) |
| Anaplastic large cell lymphoma (1) | Rhabdomyosarcoma (1) |
| Aplastic anemia (3) | |
| Myelodysplastic syndrome (5) | |
| Fanconi anemia (2) | |
| Sickle cell disease (2) | |
| Thalassemia (3) | |
| Histiocytosis (1) | |
| Mucopolysaccharidosis (1) | |
| Cartilage hair hypoplasia (1) | |
| Hemophagocytic lymphohistiocytosis (1) | |
| X-linked adrenoleukodystrophy (1) | |
| X-linked lymphoproliferative disease (1) | |
| Severe combined immune deficiency (3) | |
| CD40 ligand deficiency (1) | |
| Chediak-Higashi disease (1) |
Baseline epidemiological data included age, primary diagnosis, and type of transplant. Data collected each week throughout the study period included respiratory rate, oxygen saturation, use of supplemental oxygen (if any; concentration, flow), documentation of infection (if any), WBC count and differential, and C-reactive protein. The diagnosis of VOD was guided by the Seattle criteria, with at least 2 of 3 clinical features apparent less than 30 days after transplantation: (1) jaundice, (2) hepatomegaly with right upper quadrant pain/tenderness, and (3) ascites and/or unexplained weight gain (Table 2) [1]. The Keystone criteria were used to grade GVHD [2].
Table 2.
Diagnosis of VOD Guided by Seattle Criteria
| Patient | Bilirubin (mg/dL) | Baseline (Max) | Ascites | Ultrasound | Onset (d) |
|---|---|---|---|---|---|
| 14 mo M | 2.9 | 10 kg (12.2 kg) | Yes | Hepatomegaly, ascites | 8 |
| 14 mo F | .8 | 10.3 kg (11.5 kg) | Yes | Hepatomegaly, ascites | 7 |
| 8 mo F* | 7.7 | 5.2 kg (9.7 kg) | Severe | Hepatomegaly, ascites | 14 |
| 12 yr M | 3.5 | 45.7 kg (50 kg) | Yes | Hepatomegaly, ascites | 56 |
| 12 yr M | 1.9 | 34.1 kg (38.8 kg) | Yes | Hepatomegaly, ascites | 56 |
Diagnosis of VOD was guided by the Seattle criteria [1], with at least 2 of 3 clinical features apparent < 30 days after transplantation: (1) jaundice, (2) hepatomegaly with right upper quadrant pain/tenderness, and (3) ascites and/or unexplained weight gain.
One child was diagnosed with GVHD as well.
A whole blood sample not exceeding 2 mL was collected on day 0 just before the transplantation procedure, then weekly during hospitalization, and thereafter at the time of other standard transplant laboratory procurements (ie, some weeks after day 30 were skipped in some recipients), up to a maximum of 105 days post-transplantation. Blood was collected in a red-top tube (ie, without additives) and stored upright at room temperature for 20 to 30 minutes to form a clot. It was then centrifuged within 2 hours of collection at 1200 relative centrifugal force for 10 minutes at room temperature. The supernatant was collected, avoiding aspiration close to the clot. To minimize future damage from freeze–thaw cycles, the supernatant was divided into aliquots, labeled, and placed on ice (4°C) before freezing at −80°C.
Luminex Multiplex Cytokine Assay and Statistical Methods
An assay of a panel of cytokines was performed according to manufacturer’s recommendations (Luminex multiplex cytokine kits; Panomics/Affymetrix, Santa Clara, CA). Samples (25 μL) in duplicate were added to a 96-well filter plate preconfigured with a panel of anticytokine antibodies covalently linked to unique polystyrene beads. Standards (7-point dilutions) and controls were added at this time. The plate was incubated for 90 minutes at room temperature in the dark while shaking at 500 rpm. The plate was then vacuum aspirated and washed 3 times with 140 μL of wash buffer to remove unbound antigen sample. Biotinylated detection antibody solution was then added to the bead mixture in each well (25 μL) and incubated for 30 minutes with shaking at room temperature as above. The mixture was vacuum aspirated and washed 3 times to remove excess detector antibody. Streptavidin-PE (50 μL) was added to the mixture and incubated for 30 minutes with shaking at room temperature. The mixture was vacuum aspirated, washed 3 times, resuspended in reading buffer (120 μL), and incubated for 3 minutes at room temperature with shaking. The 96-well plate was then transferred to the Luminex reader (Luminex, Austin TX) for quantitative analysis.
The xMAP technique (Luminex) blends sandwich immunoassay with fluorescent bead–based technology. Polystyrene microspheres (5.5-μm diameter) are each filled with a specific red/infrared fluorescent dye mixture (with 100 possible mix combinations). Each bead is also coated with specific bioassay reagents (eg, antibodies against IL-6). This combination facilitates the quantification of up to 500 different analytes in a single microtiter well.
Individual cytokines were identified and classified by their bead color using red laser excitation, and cytokine levels were quantified via green laser excitation. Digital images of the bead array were captured after laser excitation using a Pixel CCD camera (Luminex, Austin TX) and were processed on a computer workstation. Data were then imported into BeadView software and analyzed to obtain standard curves and to quantify cytokine levels. Assay values were reported as mean fluorescence intensity (MFI). Log transformation converts MFI to clinically relevant measures (eg, pg/mL), which can introduce a degree of error [3]. We therefore conducted our analysis using MFI data; we also report pg/mL conversions to facilitate comparison with existing literature.
Statistical Analysis
We identified potential markers of transplant complications by using mixed treatment by subject analysis of variance, with the repeated measures of cytokine MFI as a “within-subjects” factor and categories (ie, uncomplicated, VOD, GVHD) as the “between-subjects” factor.
Aggregate cytokine data from transplant recipients were referenced against standards established with sera from a control group (11 healthy subjects ages 13 to 40 years), which were analyzed concurrently with the study samples. Data from transplant recipients were further subdivided into 3 groups for comparative analysis (GVHD, n = 11; VOD, n = 5; and uncomplicated, n = 33); 1 child developed both diagnoses (Tables 2–3). A fourth subdivision, respiratory insufficiency, had too few recipients (n = 3) for meaningful analysis; Found patterns were used to propose a characteristic cytokine “signature” over the first 100 days after HSCT.
Table 3.
Diagnosis of GVHD Guided by Keystone Criteria
| Patient | Diagnosis | Transplant | GVHD | Grade | Onset (d) |
|---|---|---|---|---|---|
| 11 yr F | ALL | 9/10 unrelated | Cutaneous | I | 14 |
| 9 yr M | ALL | 10/10 matched | Cutaneous | I | 28 |
| 8 mo F* | AML, Fanconi | 4/6 antigen 3/6 allele cord |
Cutaneous | II | 35 |
| 15 yr F | pre-B cell ALL | 10/10 unrelated | Cutaneous | I | 35 |
| 4 yr F | ALL | 6/6 antigen 4/6 allele cord |
Cutaneous | I | 77 |
| 17 yr M | ALL | Haplo-anergy HPC, T cells |
Cutaneous | II | 17 |
| 2 yr M | Hemophagocytic lymphohistiocytosis | 9/10, 9/10 unrelated | Cutaneous | II | 23 |
| 17 yr F | Sickle cell beta-thalasemia | 10/10, 10/10 unrelated | Cutaneous | I | 33 |
| 12 yr M | AML | 5/10, 5/10 haploidentical | Gastrointestinal | II | 60 |
| 1 yr M | CD40 ligand deficiency | 10/10, 9/10 unrelated | cutaneous | II | 27 |
| 13 yr M | AML | 10/10, 9/10 half-sibling | cutaneous | I | 52 |
ALL indicates acute lymphocytic leukemia; AML, myelocytic; HPC, hematopoietic progenitor cell. The diagnosis of GVHD was guided by the Keystone criteria [2].
One child was diagnosed with VOD as well.
RESULTS
Figure 1 maps the WBC count (y-axis; cells per microliter) over the first 100 days after HSCT. Counts declined predictably within the first 1 to 2 weeks of transplantation (x-axis) and then recovered over time. Recovery in WBC counts occurred more rapidly in children who developed GVHD or VOD.
Figure 1.

WBC count (y-axis; cells per microliter) from all study patients (N = 51) plotted against number of weeks after transplantation (x-axis). Total WBC count rebounded more rapidly in children who developed GVHD or VOD.
Coincident with the nadir in WBC count, the concentration of many cytokines declined by the second and third week: CD40, fibroblast growth factor-β, intercellular adhesion molecule-1, IL-1α, IL-1β, IL-2, IL-5, IL-4, IL-7, IL-12P40, IL-12P70, IL-13, IL-15, IL-17, interferon, interferon gamma-induced protein-10 (IP-10), leptin, monocyte chemotactic protein-3 (MCP3), monokine induced by gamma-interferon (MIG), macrophage inflammatory protein-1b (MIP1b), nerve growth factor (NGF), plasminogen activator inhibitor-1 (PAI-1), platelet-derived growth factor-BB (PDGFBB), RANTES (regulated on activation, normal T cell expressed and secreted), resistin, sFAS ligand, tumor necrosis factor alpha (TNF-α), transforming growth factor (TGF)-α, TGF-β, TNF-related apoptosis-inducing ligand (TRAIL), and vascular cell adhesion molecule (VCAM1). All these analytes (except MIG) subsequently rebounded by week 4 (coincident with engraftment and recovery of the WBC count). Depression of several cytokines can be seen in Figure 2.
Figure 2.

Data from children who did not develop complications after HSCT (n = 33), depicting several cytokines in very low concentrations compared with normal control subjects. This graph depicts each cytokine MFI as a multiple of the concurrent control value (ie, “control” is the horizontal line at y = 1, whereas individual cytokine MFIs are depicted either above or below that reference; eg, .2 would represent a cytokine secreted at 20% of control rate). MFI for many cytokines was well below that of concurrently measured control subjects.
Coincident with the collective nadir of multiple cytokines, 3 entities surged across all groups during weeks 2 to 4: MCP-1, GRO-α (growth-regulated oncogene), and leptin (Figure 3). High levels of leptin persisted throughout the 100 post-transplant days.
Figure 3.

Further data from the same children who did not develop complications after HSCT (n = 33), depicting the few cytokines present in concentrations greater than in concurrent control subjects. Each cytokine MFI is depicted as a multiple of the concurrent control value (ie, “control” is the horizontal line at y = 1, whereas individual cytokine MFIs are depicted as multiples of the control value; we measured MFI values as high as 15 × control baseline, whereas values below “1” denotes decreased secretion; eg, “.2” would represent a cytokine secreted at 20% of control rate).
Also during weeks 2 to 4, 2 cytokines surged in children with complications but not in those without complications: hepatocyte growth factor (HGF) and IL-6. The peak in HGF was more pronounced in VOD (Figures 4–5). IL-6 was elevated in children who ultimately were diagnosed with VOD or GVHD, whereas it remained at or below control levels in children without complications. C-reactive protein was elevated inconsistently in VOD and GVHD despite being considered a surrogate for IL-6.
Figure 4.

All transplant recipients exhibited increased MFI for a limited number of cytokines. Recipients who developed VOD had HGF and IL-6 activity that was significantly higher than in recipients without complications. IP-10 and MCP-1 varied greatly between subjects but not between groups (noncomplication versus GVHD versus VOD).
Figure 5.

Cytokine profile in children who developed GVHD (n = 10). Increases in HGF and IL-6 activity were not as high as in recipients with VOD.
Baseline granulocyte macrophage colony-stimulating factor (GM-CSF) was higher in children who eventually developed GVHD (MFI 25 ± 13 versus 16 ± 11); GM-CSF was not administered therapeutically in any patient. Five children received exogenous granulocyte colony-stimulating factor (G-CSF). In these children, MFI for GRO-α and MCP-1 were statistically higher than in children who did not receive G-CSF (P <.01). One of the G-CSF recipients developed vaso-occlusive disease. From week 4 onward in all groups, secretion of resist in increased to 5 to 15 times above concurrent control.
DISCUSSION
We have assayed 51 cytokines and chemokines in serum from 51 children, collected each week for 100 days after HSCT. Cytokine secretion in HSCT recipients differs markedly from standards established in a concurrent healthy control group. This is not surprising given the provocations involved, particularly the preparatory ablation of marrow activity with radiation and/or chemotherapy, followed by the introduction of (in allogeneic transplant, foreign) immunologically active cells. Although cytokine secretion may vary widely among pediatric HSCT recipients (ie, standard deviations were fairly large for many cytokines), we can detect some consistent trends across the first 100 days.
Global cytokine secretion in the HSCT recipient is significantly lower than in concurrent control subjects (Figure 2), and it diminishes further in the first 2 weeks after HSCT, coincident with the nadir in WBC count. Although most cytokines are initially quiescent, 2 entities (GRO-α and MCP-1) surge in all groups, followed in 2 weeks by leptin and resistin. During this same quiescent period, HGF and IL-6 surge in children who will develop VOD or GVHD but not in those without eventual complications (Table 5; Figure 6). HGF and IL-6 secretion rises at least 2 weeks before the clinical diagnosis of VOD or GVHD.
Table 5.
Partial Listing of Cytokine Activity Expressed as MFI
| Cytokine | Control Subjects (n = 11) | HSCT without Complications (n = 33) | GVHD (n = 11) | VOD (n = 5) | Respiratory Insufficiency (n = 3) | P |
|---|---|---|---|---|---|---|
| GM-CSF | 216 ± 28 | 121 ± 74 | 216 ± 349 | 69 ± 51 | 129 ± 104 | .07 |
| GRO-α | 77 ± 23 | 97 ± 151 | 199 ± 438 | 118 ± 115 | 154 ± 255 | .32 |
| HGF | 170 ± 63 | 547 ± 512 | 882 ± 725 | 1037 ± 871 | 954 ± 836 | .01 |
| IL-2 | 412 ± 54 | 105 ± 109 | 133 ± 143 | 76 ± 50 | 67 ± 26 | .30 |
| IL-4 | 195 ± 34 | 53 ± 27 | 62 ± 25 | 61 ± 34 | 56 ± 16 | .48 |
| IL-6 | 40 ± 8 | 31 ± 40 | 64 ± 95 | 91 ± 154 | 30 ± 17 | .01 |
| IL-17F | 425 ± 58 | 116 ± 62 | 190 ± 267 | 88 ± 24 | 113 ± 37 | .34 |
| IFN-β | 412 ± 54 | 229 ± 173 | 471 ± 856 | 198 ± 54 | 228 ± 75 | .40 |
| IP-10 | 305 ± 68 | 1197 ± 1670 | 1639 ± 2399 | 1622 ± 2438 | 1600 ± 1434 | .73 |
| MCP-1 | 367 ± 93 | 1297 ± 1652 | 2011 ± 3648 | 2530 ± 3510 | 1457 ± 2137 | .29 |
| PAI | 9055 ± 748 | 8170 ± 1861 | 8350 ± 2147 | 9263 ± 1712 | 7557 ± 2714 | .36 |
| PDGFBB | 1828 ± 820 | 240 ± 356 | 464 ± 947 | 157 ± 107 | 105 ± 80 | .13 |
| TGF-β | 250 ± 35 | 58 ± 43 | 61 ± 37 | 46 ± 17 | 54 ± 26 | .75 |
| TNF-α | 66 ± 18 | 29 ± 17 | 35 ± 24 | 27 ± 9 | 44 ± 58 | .12 |
| VCAM1 | 2958 ± 1161 | 6267 ± 2628 | 6749 ± 3007 | 8067 ± 2990 | 8456 ± 3893 | .25 |
| VEGF | 131 ± 60 | 71 ± 56 | 86 ± 66 | 98 ± 48 | 56 ± 57 | .36 |
All clinical specimens were obtained at 7:00 AM ± 1 hour. Cytokine profiles for transplant recipients differed markedly from control subjects. Analysis by mixed treatment by subjects ANOVA detected differences between transplant groups with and without complications only for GM-CSF, IL-6, and HGF.
Figure 6.

Median fluorescence activity. Number of weeks after transplantation along the x-axis, with day of transplant samples collected at x = 1. Patients without complications (n = 33, MFI − SD) dark gray band in foreground; GVHD (n = 10, MFI − SD) light gray with black outline; VOD (n = 5) (MFI + SD) medium gray band in background.
The most promising candidate markers for GVHD are HGF and IL-6. Both TNF-α and IFN-α were markedly elevated in some children with GVHD, but both were highly variable.
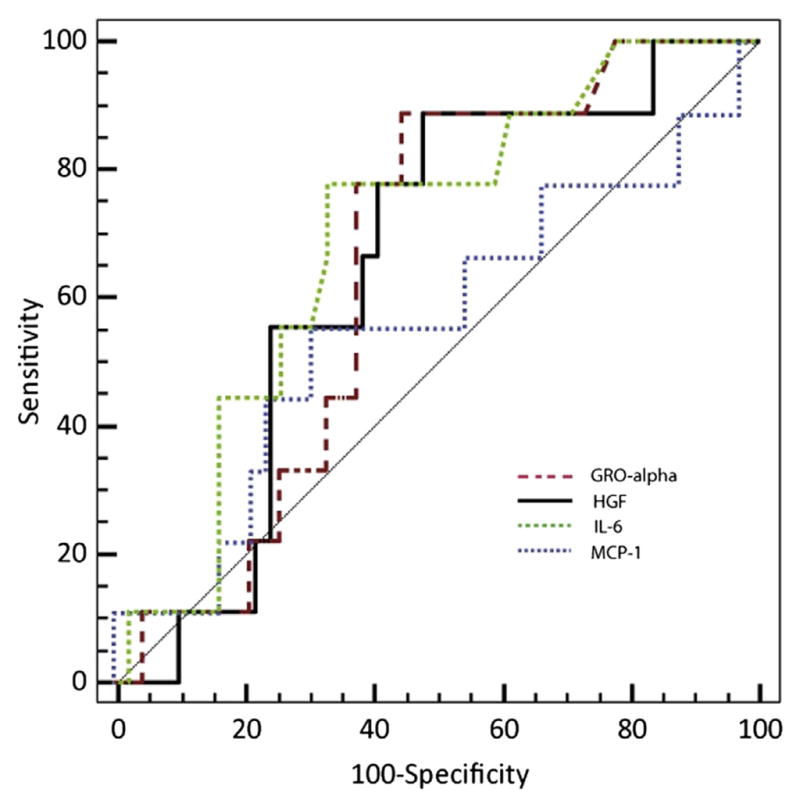
Children with VOD exhibit consistently lower concentrations of several cytokines (GM-CSF, IL-2, IL-17F, IFN-β, PDGFBB, TGF-β) as compared with either the GVHD or uncomplicated groups, but each of these (except IFN-α) trended well below control values in all HSCT groups. Receiver operating characteristic curves were constructed for prediction of vaso-occlusive disease. HGF, GRO- α, and MCP-1 were superior to IL-6 (Figure 7). The most promising candidate markers for VOD are HGF and IL-6. Both VCAM1 and PAI-1 trended higher in children with VOD, whereas HGF and IL-6 were markedly elevated before the clinical diagnosis of VOD.
Figure 7.

Receiver operating characteristic curves were constructed for prediction of vaso-occlusive disease by MFI measured 21 days after transplantation. HGF, GRO-α, and MCP-1 were superior to IL-6.
The cytokine mean values and ranges demonstrated in our patients are broadly similar to those reported using the same technology in other populations [4–6]. The similarities hold true for analytes present in high concentration as well as those in relatively low concentrations (IL-1β, IL-2, IL-4, IL-5, IL-6, IL-7, IL-8, IL-12p70, IL-13, IFN-γ, and TNF-α).
When comparing xMAP studies with those that use different technologies, reference values become problematic. For instance, in a study of multiple myeloma that used an ELISA system, control values (in pg/mL) for epithelial neutrophil-activating protein-78 (ENA-78), GRO-α, HGF, and vascular endothelial growth factor (VEGF) ranged higher than in our control patients [7,8]. The same trend was reported in neonatal studies with that system [9]. Another study using the same ELISA system reported control GRO-α in a range much higher than in our control group [10].
In head-to-head studies that attempt to reconcile the 2 techniques, reported picogram concentrations of certain analytes detected by ELISA are higher than those detected by xMAP, whereas for others they are lower [11–13]. From these direct comparison studies, it is apparent that absolute values for cytokine concentrations can be directly compared between studies using similar technology but not when evaluating studies that use different systems; rather, trends are reliably established by either technology, and that should be the focus when making comparisons.
In the present study, the control group of adolescents and young adults was a reasonable but not ideal match for the transplantation cohort. The obvious preference would be for age-matched healthy children. However, we set the bar high for determining differences between transplant recipients and control subjects (P < .01 in unpaired 2-tailed t-test). Several cytokines met this threshold (Table 4). We tracked each cytokine weekly over the course of 15 weeks after transplantation. For most cytokines, flux over time was remarkably consistent; peaks would occur across the population at roughly the same point in the transplant process. This was not an artifact of the laboratory analysis, as samples were batched, and a given plate held samples from disparate weeks: for example, from weeks 0 to 5 for patient x, weeks 3 to 8 for patient y, and weeks 11 to 14 for patient z.
Table 4.
Cytokine and Chemokine Concentrations of HSCT Recipients and Healthy Control Subjects on Day of Transplantation
| Cytokine (pg/mL) | Control Subjects (n = 11) | HSCT Recipients (n = 51) | P |
|---|---|---|---|
| CD40 ligand | 121 ± 57 | 84 ± 93 | .21 |
| ENA78 | 423 ± 490 | 50 ± 63 | 1.22 |
| Eotaxin | 18 ± 8 | 17 ± 11 | .77 |
| Fibroblast growth factor-β | 4 ± 5 | 1 ± 3 | <.01 |
| G-CSF | 223 ± 375 | 275 ± 456 | .73 |
| GM-CSF | 57 ± 45 | 23 ± 18 | <.001 |
| GRO-α | 7 ± 4 | 7 ± 5 | 1 |
| HGF | 11 ± 8 | 53 ± 40 | <.001 |
| Intercellular adhesion molecule-1 | 2503 ± 1309 | 30,300 ± 19,866 | <.001 |
| IFN-α | 2 ± 4 | 0 ± 0 | |
| IFN-β | 14 ± 7 | 21 ± 30 | .45 |
| IFN-γ | 23 ± 13 | 3 ± 4 | <.001 |
| IL-10 | 1 ± 1 | 1 ± 2 | |
| IL-12P70 | 6 ± 4 | 2 ± 2 | <.001 |
| IL-12P40 | 12 ± 5 | 6 ± 6 | .003 |
| IL-13 | 15 ± 9 | 3 ± 3 | <.001 |
| IL-15 | 4 ± 7 | 6 ± 8 | .44 |
| IL-17 | 6 ± 3 | 2 ± 2 | <.001 |
| IL-17 F | 45 ± 25 | 13 ± 14 | <.001 |
| IL-1-α | 1 ± 2 | 2 ± 3 | .29 |
| IL-1-β | 4 ± 3 | 1 ± 1 | <.001 |
| IL-1RA | 6 ± 6 | 58 ± 81 | .04 |
| IL-2 | 97 ± 61 | 18 ± 19 | <.001 |
| IL-4 | 8 ± 5 | 2 ± 2 | <.001 |
| IL-5 | 55 ± 28 | 21 ± 19 | <.001 |
| IL-6 | 2 ± 3 | 1 ± 1 | .05 |
| IL-7 | 101 ± 55 | 39 ± 30 | <.001 |
| IL-8 | 3 ± 2 | 3 ± 3 | 1 |
| IP10 | 19 ± 9 | 97 ± 102 | .014 |
| Leptin | 987 ± 395 | 19,690 ± 23,782 | .012 |
| LIF | 15 ± 9 | 2 ± 2 | <.001 |
| M-CSF | 1 ± 1 | 0 ± 0 | |
| MCP-1 | 15 ± 7 | 47 ± 45 | .02 |
| MCP-3 | 110 ± 166 | 12 ± 11 | <.001 |
| MIG | 8 ± 4 | 91 ± 110 | .02 |
| MIP-1β | 43 ± 22 | 91 ± 78 | .05 |
| MIP-1α | 25 ± 13 | 17 ± 16 | .13 |
| NGF | 32 ± 17 | 14 ± 14 | <.001 |
| PAI-1 | 1484 ± 592 | 1722 ± 738 | .32 |
| PDGFBB | 723 ± 423 | 165 ± 145 | <.001 |
| RANTES | 262 ± 126 | 436 ± 179 | .004 |
| Resistin | 1290 ± 653 | 643 ± 678 | .005 |
| SCF | 1 ± 2 | 2 ± 3 | |
| sFAS ligand | 104 ± 182 | 4 ± 3 | <.001 |
| TGF-α | 1 ± 1 | 1 ± 1 | |
| TGF-β | 9 ± 3 | 1 ± 2 | <.001 |
| TNF-α | 2 ± 1 | 1 ± 1 | .004 |
| TNF-β | 1 ± 1 | 1 ± 1 | |
| TRAIL | 16 ± 8 | 15 ± 11 | .78 |
| VCAM-1 | 616 ± 507 | 3668 ± 3083 | .002 |
| VEGF | 13 ± 8 | 11 ± 10 | .54 |
Cytokine and chemokine concentration (pcg/mL) determined algorithmically, comparing HSCT recipients the day of transplantation against healthy controls. When control values were unexpectedly low, algorithm or assay failure was assumed; these cytokines are printed in gray type and were omitted from statistical analysis.
Based on the patterns detected in this analysis, cytokines that might merit further study as potential markers of complications include IL-6 and HGF and possibly MCP-1 and GRO-α. IL-6 has both pro-inflammatory and anti-inflammatory features. It is secreted by T cells and macrophages relatively early in the immune cascade to stimulate an immune response, particularly during infection, burns, or direct tissue damage. Macrophages secrete IL-6 and other cytokines in response to specific microbial pathogen-associated molecular patterns (eg, on Escherichia coli that have translocated due to gastrointestinal damage early in the transplant process) [14]. IL-6 stimulates acute phase protein synthesis and supports neutrophil and B cell production. IL-6 has anti-inflammatory effects as well, inhibiting TNF-α and IL-1 while activating IL-1RA and IL-10.
GRO-α [also known as chemokine (C-X-C motif) ligand 1 or CXCL1] is produced by macrophages, neutrophils, and epithelial cells. It participates in angiogenesis and inflammation and has been implicated in vaso-occlusion during hemolytic transfusion reactions in a mouse model of sickle cell disease [15]. Because this may be relevant to understanding and possibly treating VOD in transplant recipients, we briefly describe this model. Hemolytic transfusion reaction was used to induce an acute vaso-occlusive crisis in the sickle cell mouse. In crisis, the most dramatic elevation in cytokine levels was noted for CXCL1 (GRO-α). Pathological changes included leukocyte recruitment in venules, capture of circulating RBCs, and reduction of flow in venules. The infusion of recombinant GRO-α alone could induce the acute reproduction of these clinical and pathological findings, whereas blockade of the CXCL1 receptor, CXCR2, prevented transfusion-elicited acute vaso-occlusive crisis. The investigators suggested that targeted inhibition of CXCL1 (GRO-α) and/or CXCR2 might emerge as a therapeutic option in sickle cell crisis.
HGF/scatter factor is secreted by mesenchymal cells and targets epithelial and endothelial cells [16]. It has a role in angiogenesis, tissue regeneration, marrow reconstitution, and the development of tumors. HGF is a good candidate as a potential predictive marker for VOD (as well as GVHD). We observed a surge in HGF 2 weeks ahead of the clinical diagnosis of VOD, and it remained elevated for 2 weeks subsequently. In children without complications after HSCT, HGF stayed close to its baseline value throughout the 100 days after transplantation. This baseline, however, was well above concurrent control values.
Veno-Occlusive Disease
PAI-1, TNF-α, and IL-1β have previously been implicated in VOD [17–19]. We found no similar association throughout the 100 days after HSCT, during which time there was no difference in the activity of PAI-1, TNF-α, and IL-1β in children with eventual VOD as compared with the uncomplicated group. These 3 cytokines were not elevated compared with concurrent control subjects.
Schots et al. [20] determined that high average levels of IL-6, IL-8, and/or TNF-α within 10 days of HSCT were independently associated with GVHD, VOD, or idiopathic pneumonia syndrome. Cutler et al. [21] found that certain biomarkers of endothelial injury (von Willebrand Factor, thrombomodulin, E-selectin, and soluble intercellular adhesion molecule-1) were predictive of VOD in HSCT recipients receiving sirolimus but not in others. In an in vitro setting, Pihusch et al. [22] demonstrated that TGF-β1 released from activated platelets might fuel the hemostatic imbalance at the sinusoidal endothelium in hepatic VOD. In our surveillance, children with VOD manifested lower levels of multiple cytokines (GM-CSF, IL-2, IL-4, IL-17F, PDGFBB, TGF-β) than in the uncomplicated or GVHD groups, whereas HGF and IL-6 reached high plateau levels 1 to 2 weeks before the diagnosis of VOD.
Graft-versus-Host Disease
Harris et al. [23] recently demonstrated the utility of HGF and another novel biomarker, designated as regenerating islet-derived-3α, in the identification and monitoring of adults with liver and gastrointestinal tract GVHD. Through high-throughput discovery methods similar to those used in our study, Paczesny et al. [24] identified a quartet of potential biomarkers of GVHD (IL-2 receptor α, TNF receptor 1, IL-8, and HGF) and subsequently validated the panel in a large population of HSCT recipients. The median age of this population was 43 years (range, 1 to 68), and patients with VOD were excluded.
We did not measure IL2RA, but in our population IL-8 activity in children with eventual GVHD was indistinguishable from activity in recipients with eventual VOD or an uncomplicated course. However, TNF-α and HGF activity were high in the children who were eventually diagnosed with GVHD. Receiver operating characteristic curves were constructed for prediction of GVHD by MFI measured 21 days after transplantation. HGF and GRO-α demonstrated acceptable sensitivity but poor specificity (Figure 8).
Figure 8.
Receiver operating characteristic curves were constructed for prediction of GVHD by MFI measured 21 days after transplantation. HGF and GRO-α demonstrated acceptable sensitivity but poor specificity.
CONCLUSIONS
From a longitudinal assay of 51 cytokines and chemokines, we can postulate a characteristic pattern of cytokine and chemokine secretion across the first 100 days after HSCT in children. Most cytokines are quiescent in the first few weeks after HSCT, coinciding with the induced nadir in the WBC count. At the same time, however, there is a surge of leptin, GRO-α, and MCP-1 in most recipients, whereas IL-6 and HGF surge in children with eventual major complications. After 4 weeks, resistin surges in all groups. Children with eventual complications exhibit a general “signature” of increased cytokine activity, but differences reach statistical significance with only a few specific entities. HGF has now emerged in 3 or more biomarker discovery efforts for GVHD (and in our population, for VOD as well). HGF (with or without IL-6) should be investigated as a potential predictive biomarker of VOD or GVHD. Alternatively, the hyper-inflammatory “signature” provided by a multicytokine assay may be predictive.
Footnotes
Conflict of interest statement: The authors have nothing to disclose.
Financial disclosure: Supported in part by a Developmental Cancer Research Award in Translational Science, awarded by the Stanford University Cancer Center.
References
- 1.McDonald GB, Sharma P, Matthews DE, et al. Venocclusive disease of the liver after bone marrow transplantation: diagnosis, incidence, and predisposing factors. Hepatology. 1984;4:116–122. doi: 10.1002/hep.1840040121. [DOI] [PubMed] [Google Scholar]
- 2.Przepiorka D, Weisdorf D, Martin P, et al. 1994 Consensus Conference on Acute GVHD Grading. Bone Marrow Transplant. 1995;15:825–828. [PubMed] [Google Scholar]
- 3.Luminex Corporation. [Accessed January 10, 2012];xPonent® logistic curve fitting: technical notes. Available at: http://www.luminexcorp.com/prod/groups/public/documents/lmnxcorp/207-xponent3.1-log-curve-fit.pdf.
- 4.Linkov F, Gu Y, Arslan AA, et al. Reliability of tumor markers, chemokines, and metastasis-related molecules in serum. Eur Cytokine Netw. 2009;20:21–26. doi: 10.1684/ecn.2009.0146. [DOI] [PMC free article] [PubMed] [Google Scholar]
- 5.Hofmann JN, Yu K, Bagni RK, et al. Intra-individual variability over time in serum cytokine levels among participants in the Prostate, Lung, Colorectal, and Ovarian Cancer Screening Trial. Cytokine. 2011;56:145–148. doi: 10.1016/j.cyto.2011.06.012. [DOI] [PMC free article] [PubMed] [Google Scholar]
- 6.Clendenen TV, Lundin E, Zeleniuch-Jacquotte A, et al. Circulating inflammation markers and risk of epithelial ovarian cancer. Cancer Epidemiol Biomarkers Prev. 2011;20:799–810. doi: 10.1158/1055-9965.EPI-10-1180. [DOI] [PMC free article] [PubMed] [Google Scholar]
- 7.Pappa CA, Tsirakis G, Kanellou P, et al. Monitoring serum levels ELR(+) CXC chemokines and the relationship between microvessel density and angiogenic growth factors in multiple myeloma. Cytokine. 2011;56:616–620. doi: 10.1016/j.cyto.2011.08.034. [DOI] [PubMed] [Google Scholar]
- 8.Manoura A, Gourgiotis D, Galanakis E, et al. Circulating concentrations of α- and β-chemokines in neonatal sepsis. Int J Infect Dis. 2010;14:e806–e809. doi: 10.1016/j.ijid.2010.03.015. [DOI] [PubMed] [Google Scholar]
- 9.Suzuki K, Matsuzaki H, Iwata K, et al. Plasma cytokine profiles in subjects with high-functioning autism spectrum disorders. PLoS One. 2011;6:e20470. doi: 10.1371/journal.pone.0020470. [DOI] [PMC free article] [PubMed] [Google Scholar]
- 10.Ormstad H, Aass HC, Lund-Sørensen N, et al. Serum levels of cytokines and C-reactive protein in acute ischemic stroke patients, and their relationship to stroke lateralization, type, and infarct volume. J Neurol. 2011;258:677–685. doi: 10.1007/s00415-011-6006-0. [DOI] [PMC free article] [PubMed] [Google Scholar]
- 11.Kornacker M, Roth A, Christensen O, et al. Quantification of vascular endothelial growth factor, interleukin-8, and basic fibroblast growth factor in plasma of cancer patients and healthy volunteers— comparison of ELISA and microsphere-based multiplexed immunoassay. Clin Chem Lab Med. 2008;46:1256–1264. doi: 10.1515/CCLM.2008.249. [DOI] [PubMed] [Google Scholar]
- 12.Codorean E, Nichita C, Albulescu L, et al. Correlation of XMAP and ELISA cytokine profiles: development and validation for immunotoxicological studies in vitro. Roum Arch Microbiol Immunol. 2010;69:13–19. [PubMed] [Google Scholar]
- 13.Loo BM, Marniemi J, Jula A. Evaluation of multiplex immunoassays, used for determination of adiponectin, resistin, leptin, and ghrelin from human blood samples, in comparison to ELISA assays. Scand J Clin Lab Invest. 2011;71:221–226. doi: 10.3109/00365513.2011.554996. [DOI] [PubMed] [Google Scholar]
- 14.Panoskaltsis-Mortari A, Griese M, Madtes DK, et al. American Thoracic Society Committee on Idiopathic Pneumonia Syndrome. An official American Thoracic Society research statement: noninfectious lung injury after hematopoietic stem cell transplantation: idiopathic pneumonia syndrome. Am J Respir Crit Care Med. 2011;183:1262–1279. doi: 10.1164/rccm.2007-413ST. [DOI] [PMC free article] [PubMed] [Google Scholar]
- 15.Jang J-E, Hod EA, Spitalnik SL, Frenette PS. CXCL1 and its receptor, CXCR2, mediate murine sickle cell vaso-occlusion during hemolytic transfusion reactions. J Clin Invest. 2011;121:1397–1401. doi: 10.1172/JCI45336. [DOI] [PMC free article] [PubMed] [Google Scholar]
- 16.Michalopoulos GK, Zarnegar R. Hepatocyte growth factor. Hepatology. 1992;15:149–154. doi: 10.1002/hep.1840150125. [DOI] [PubMed] [Google Scholar]
- 17.Richardson P, Guinan E. Hepatic veno-occlusive disease following hematopoietic stem cell transplantation. Acta Haematol. 2001;106:57–68. doi: 10.1159/000046590. [DOI] [PubMed] [Google Scholar]
- 18.Gugliotta L, Catani L, Vianelli N, et al. High plasma levels of tumor necrosis factor-α may be predictive of veno-occlusive disease in bone marrow transplantation. Blood. 1994;83:2385–2386. [PubMed] [Google Scholar]
- 19.Holler E, Kolb HJ, Möller A, et al. Increased serum levels of tumor necrosis factor-α precede major complications of bone marrow transplantation. Blood. 1990;75:1011–1016. [PubMed] [Google Scholar]
- 20.Schots R, Kaufman L, Van Riet I, et al. Proinflammatory cytokines and their role in the development of major transplant-related complications in the early phase after allogeneic bone marrow transplantation. Leukemia. 2003;17:1150–1156. doi: 10.1038/sj.leu.2402946. [DOI] [PubMed] [Google Scholar]
- 21.Cutler C, Kim HT, Ayanian S, et al. Prediction of veno-occlusive disease using biomarkers of endothelial injury. Biol Blood Marrow Transplant. 2010;16:1180–1185. doi: 10.1016/j.bbmt.2010.02.016. [DOI] [PMC free article] [PubMed] [Google Scholar]
- 22.Pihusch V, Pihusch M, Penovici M, et al. Transforming growth factor beta-1 released from platelets contributes to hypercoagulability in veno-occlusive disease following hematopoetic stem cell transplantation. Thromb Res. 2005;116:233–240. doi: 10.1016/j.thromres.2004.12.010. [DOI] [PubMed] [Google Scholar]
- 23.Harris AC, Ferrara JL, Braun TM, et al. Plasma biomarkers of lower gastrointestinal and liver acute graft-versus-host disease. Blood. 2012;119:2960–2963. doi: 10.1182/blood-2011-10-387357. [DOI] [PMC free article] [PubMed] [Google Scholar]
- 24.Paczesny S, Krijanovski OI, Braun TM, et al. A biomarker panel for acute graft-versus-host disease. Blood. 2009;113:273–278. doi: 10.1182/blood-2008-07-167098. [DOI] [PMC free article] [PubMed] [Google Scholar]