

Abstract
Purpose
Firefly luciferase catalyzes the oxidative decarboxylation of D-luciferin to oxyluciferin in the presence of cofactors, producing bioluminescence. This reaction is used in optical bioluminescence-based molecular imaging approaches to detect the expression of the firefly luciferase reporter gene. Biokinetics and distribution of the substrate most likely have a significant impact on levels of light signal and therefore need to be investigated.
Methods
Benzene ring 14C(U)-labeled D-luciferin was utilized. Cell uptake and efflux assays, murine biodistribution, autoradiography and CCD-camera based optical bioluminescence imaging were carried out to examine the in vitro and in vivo characteristics of the tracer in cell culture and in living mice respectively.
Results
Radiolabeled and unlabeled D-luciferin revealed comparable levels of light emission when incubated with equivalent amounts of the firefly luciferase enzyme. Cell uptake assays in pCMV-luciferase-transfected cells showed slow trapping of the tracer and relatively low uptake values (up to 22.9-fold higher in firefly luciferase gene-transfected vs. nontransfected cells, p=0.0002). Biodistribution studies in living mice after tail-vein injection of 14C-D-luciferin demonstrated inhomogeneous tracer distribution with early predominant high radioactivity levels in kidneys (10.6% injected dose [ID]/g) and liver (11.9% ID/g), followed at later time points by the bladder (up to 81.3% ID/g) and small intestine (6.5% ID/g), reflecting the elimination routes of the tracer. Kinetics and uptake levels profoundly differed when using alternate injection routes (intravenous versus intraperitoneal). No clear trapping of 14C-D-luciferin in firefly luciferase-expressing tissues could be observed in vivo.
Conclusions
The data obtained with 14C-D-luciferin provide insights into the dynamics of D-luciferin cell uptake, intracellular accumulation, and efflux. Results of the biodistribution and autoradiographic studies should be useful for optimizing and adapting optical imaging protocols to specific experimental settings when utilizing the firefly luciferase and D-luciferin system.
Keywords: Optical imaging, Luciferase, D-Luciferin, Reporter Genes, Biodistribution
Introduction
Optical imaging techniques, either fluorescence- or bioluminescence-based (e.g., green fluorescence protein [GFP]-based fluorescence microscopy, luciferase-based benchtop luminometry), have been in use for a long time for in vitro applications in molecular and cellular biology [1]. An extension of this concept toward noninvasive in vivo imaging with light photons represents an interesting approach for collecting relevant biological information from small living subjects. In molecular imaging, visualization of reporter gene expression is used for noninvasive monitoring of gene expression in living subjects in various experimental settings [2]. Optical imaging allows for a relatively low-cost alternative for studying reporter gene expression in small animal models compared to other strategies such as positron emission tomography (PET) [3].
One key advantage of optical bioluminescence imaging is that it can be used to detect very low levels of signal because the light emitted from a sample in the dark chamber of a charged coupled device (CCD) camera is—in contrast to fluorescence imaging—virtually background-free. It is quick and easy to perform and allows rapid testing of biological hypotheses in living experimental small animal models.
Luciferases consist of a wide range of enzymes that catalyze the oxidation of substrate luciferins to yield nonreactive oxyluciferins and the release of photons of light that may be detected, collected, and quantified externally. Some luciferins require the presence of a cofactor to undergo oxidation, such as Ca2+ or adenosine triphosphate (ATP). Other systems like the sea pansy Renilla luciferase which uses a different substrate (coelenterazine) and is not ATP dependent as well as the Gaussia luciferase system have been recently validated for applications in living subjects [4, 5].
The most common luciferase–luciferin system used in molecular imaging is that derived from the firefly Photinus pyralis [6]. The firefly luciferase gene (fluc) encodes for firefly luciferase (FL), an enzyme that oxidizes its substrate D-luciferin in the presence of ATP, magnesium, and oxygen to result in light emission (bioluminescence, Fig. 1a). The system has several favorable characteristics: It does not need external light excitation, the fast rate of enzyme turnover in the presence of substrate D-luciferin allows for real-time measurements, and the relationship between the enzyme concentration and the peak height of emitted light in vitro is linear up to seven to eight orders of magnitude. These properties potentially allow for sensitive, quantitative non-invasive imaging of fluc expression in living subjects [7].
Fig. 1.

a Firefly Luciferase catalyzes the oxidative decarboxylation of Luciferin in the presence of ATP, O2, and Mg2+, producing yellow-green light (λmax=560 nm). b Chemical structure of D-luciferin, [benzene ring–14C (U)]–: Approximately one carbon atom of the benzene ring in this radiotracer is randomly replaced by 14C. The functionality of 14C-D-luciferin was preserved in all our tests
In vitro transgene expression assays were utilizing the fact that light emission is proportional to the concentration of FL when substrate is provided in excess. However, for in vivo experiments aimed to image fluc expression in various organs after systemic administration of D-luciferin, a concern for fluc-based gene imaging is whether local substrate delivery/distribution can affect luminescence intensity.
In this work, we report cell uptake characteristics of a fully functional, 14C-labeled D-luciferin substrate in native and fluc-expressing cells in cell culture. We examine biodistribution patterns of 14C-labeled D-luciferin in mice using different injection routes (intravenous/intraperitoneal) of the tracer. The in vitro and in vivo biodistribution data are substantiated by autoradiographic studies. Finally, biodistribution data in mice with adenoviral-mediated fluc expression are discussed in context of the cell culture results and efforts to work toward a multimodality optical/ radiotracer-based reporter probe system.
Materials and methods
Production of 14C-D-luciferin
Benzene 14C (U) luciferin was obtained from Moravek Biochemicals (http://www.moravek.com) with a specific activity of 2.11 GBq/mmol and a radiochemical purity of 97.0%. The tracer was synthesized by this company following the pathway described in detail in [8]. Condensation of p-anisidine [14C] with carbamoyl thiocarbonyl thioacetic acid was the critical step in this synthesis. In the end product, D-luciferin [benzene ring–14C(U)]–, approximately one carbon atom of the benzene ring per molecule was randomly replaced by 14C, but no foreign atom or charge was introduced into the molecule (Fig. 1b).
Verification of the functionality of 14C-D-luciferin in buffer solution
To a buffer solution with fixed amounts of ATP and MgSO4 and rising amounts of FL concentrations (from 64 to 400 ng/μl), a fixed amount of 14C-labeled or unlabeled D-luciferin solution (125 ng) was added, and the bioluminescence signal was measured using a Luminometer (Turner 20/20, Turner, Sunnyvale, CA, USA).
The bioluminescence signal of labeled and unlabeled D-luciferin, measured in relative light units per minute (RLU/min), were then compared in samples with same amounts of FL. The buffer ingredients used in this experiment were the following: 20 mM tricine, 2.5 mM MgSO4, 0.1 mM ethylenediamine tetraacetic acid, 33.3 mM dithiothreitol, 530 μM ATP, and 270 μM coenzyme A (CoA)–Li salt. The buffer was prepared at room temperature, CoA–lithium salt and potassium Luc were added to the solution after the pH was adjusted to 7.8.
Verification of the functionality of 14C-D-luciferin in cell culture
To test the functionality of 14C-D-luciferin in cell culture, 2.5×10⁵ 293T cells were plated in 12-well plates in modified Eagle’s medium (MEM) containing 10% fetal bovine serum (FBS). pCMV-luciferase plasmid was built by cloning fluc in the pcDNA3.1(+) backbone (Invitrogen USA, http://www.invitrogen.com), utilizing the Nhel–Xhol restriction enzyme site. Transient transfections were performed 24 h later (~80% confluency) by using Superfect transfection reagent. Each transfection mix contained the pCMV-luciferase plasmid (2 μg CMV-Luc per row). Three hours after transfection, the cell medium was added, and the cells were incubated for 24 h. The medium was carefully removed, and phosphate-buffered saline (PBS) containing 1 μg 14C-D-luciferin (~7.4 kBq) or a corresponding amount of unlabeled D-luciferin was added to each well. Light emission of wells with 14C-D-luciferin was compared to light emission of wells with D-luciferin.
The bioluminescence was measured in a cooled CCD camera (Xenogen IVIS; Xenogen). Photons emitted from cells were collected and integrated for a period of 2 min. Images were obtained by using LIVING IMAGE software (Xenogen) and IGOR image analysis software (Wave-Metrics, Lake Oswego, OR, USA). For quantification of measured light, regions of interest were drawn over the specific wells and the maximum photons per second per square centimeter per steradian were obtained.
Cell culture and cell transfection protocols
Human embryonic kidney cancer cells 293T (American Type Culture Collection [ATCC], Manassas, VA, USA), used for most of the experiments, were grown in MEM supplemented with 10% FBS and 1% penicillin/streptomycin solution. Cells were plated in 12-well plates.
Transient transfections were performed 24 h later by using Superfect transfection reagent. Each transfection mix contained pCMV-luciferase plasmid (2 μg CMV-Luc per row, unless stated otherwise). Three hours after transfection, the cell medium was added, and the cells were incubated for 24 h before cell uptake tests were carried out.
Cell uptake and cell efflux experiments
Cell uptake experiments were done using native 293T cells and transiently with the CMV-Luc plasmid-transfected 293T cells. In one experiment, stably fluc transfected C6 rat glioma cells were utilized. The C6 cells were obtained from the ATCC (http://www.atcc.org). The stably fluc-transfected C6 rat glioma cells were created by utilizing the previously introduced pcDNA3.1(+)-fluc plasmid and selecting with the G418 (Neomycin) antibiotic marker.
Transfections were carried out as described above. Two micrograms of CMV-Luc plasmid per row in a 12-well plate was used, unless stated otherwise.
Cell uptake experiments were done in 12-well plates 24 h after CMV-Luc transfection. During the tracer uptake time, cells were kept either in cell media containing FBS or in PBS without serum.
14C-D-Luciferin (3.7 kBq) was added to each 12-well plate. In the experiments in which mass levels of carrier D-luciferin was added, 1,500 μg unlabeled D-luciferin per well was used.
Cells were incubated at 37°C for different uptake times. At the end of each incubation period, radioactivity in the medium was measured. The wells were washed with cold PBS, the cells were harvested using a cell scraper, and the radioactivity in the cell pellet was determined. Triplicate samples were performed for all uptake studies. The same wells were also used to determine total protein content. Data are expressed as the net accumulation of probe in [dpm cells/total count (dpm cells+dpm supernatant)/μg total protein]±standard error or in (dpm cells/total count)× 100±standard error.
For the efflux experiment, 293T Luc cells and native 293T cells were incubated for 1 h with 3.7 kBq 14C-D-luciferin per well in cell media and FBS. Then, the cells were washed two times with PBS, and nonradioactive media were added. At different time points, 100 μl of the supernatant was taken, cells were washed twice with PBS, and the cells were lysed. The cell media, supernatant sample, and the cell lysate sample were measured in a Beckmann LS 9000 liquid scintillation counter with cytoscint (ICN, Costa Mesa, CA, USA) scintillation fluid. Corrections for background activity and efficiency (96.1% for 14C) based on calibrated standards (Beckmann) also were performed to obtain disintegrations per minute (dpm). Data are expressed as [dpm cells/total count (dpm cells+ dpm supernatant]×100%±standard error.
Murine biodistribution studies
14C-D-Luciferin percent injected dose per gram (%ID/g) was quantified by biodistribution studies. The experiments were carried out in nude mice without fluc expression.
Mice were coinjected via the tail vein with 18.5 kBq 14C-D-luciferin and 3 mg unlabeled D-luciferin. Mice were killed, and organs were immediately removed. The organs were weighed and counted for [14C] radioactivity. For 14C tissue counting, small samples of the tissue were dissolved with hyamine and heated at 500°C for ~12 h before counting with cytoscint scintillation fluid. Corrections for background activity and efficiency (96.1% for 14C) based on calibrated standards (Beckmann) also were performed to obtain disintegrations per minute. Corrections for the efficiency of tissue sample counting were performed by sending random tissue samples (PTRL, Richmond, CA, USA) for counting by a combustion method.
Two mice per time point and three tissue samples of each tissue type were measured. Radioactivity determinations were normalized by the weight of the tissue and amount of radioactivity injected to obtain %ID/g.
Identical experiments were done after intraperitoneal injection of unlabeled and 14C-labeled D-luciferin and after tail-vein injection of 18.5 kBq 14C-D-luciferin without coinjection of mass amounts of the carrier.
Digital whole-body autoradiography
The 14C-D-luciferin injection procedure described in the biodistribution studies above was repeated using two mice per time point. After killing, each animal was frozen in liquid nitrogen in preparation for digital whole-body autoradiography (DWBA) using a 45-μm slice thickness [9]. The exposure time of the plates was 24–72 h. All digital plates were scanned on a Fuji BAS 5000 Phosphor-imager at a resolution of ~100 μm. DWBA was not quantified to calculate the absolute uptake value in %ID/g but performed to correlate the relative accumulation of the tracer in different organs as compared with the biodistribution studies.
In vivo CMV-Luc transfection and optical imaging of mice
Experiments were done in nude mice at least 72 h after injection of 1×10⁹ plaque-forming units Adenovirus (Ad-CMV-luciferase) via tail vein. Control mice were injected with the control virus (Ad-CMV-βGal) with the same titer. Mice were injected with 18.5 kBq 14C-D-luciferin and 3 mg of carrier D-luciferin (one mouse of each group was only injected with 14C-D-luciferin without mass amounts of unlabeled D-luciferin). D-Luciferin was injected via tail vein or intraperitoneally, and uptake differences in %ID/g tissue in fluc-expressing livers vs. control livers were examined.
Mice were killed immediately after CCD camera imaging of the animals so that light signals from transfected and control mice could also be documented. The bioluminescence signal in mice was measured in a cooled CCD camera, and biodistribution studies were carried out as described previously. Different time points from 1 min to 1 h were chosen, including killing the animals when peak light emission occurred.
Statistical analysis
Statistical analysis was carried out utilizing the unpaired Student’s t test algorithm and the Microsoft EXCEL software. If p values were less than 0.05, findings were deemed significant.
Results
14C-D-Luciferin demonstrates activity preservation both in buffer solution and when exposed to intact cells
14C-labeled and unlabeled D-luciferin reveal no significant differences in light yields (p=0.36) when incubated with same amounts of FL: 7,393±1,068 vs. 6,706±1,208 RLU when utilizing 400 ng FL/μl (Fig. 2a). These results clearly indicate that 14C-D-luciferin is still a functional substrate for the FL-catalyzed reaction.
Fig. 2.

a To a buffer solution with rising amounts of FL concentration and fixed amounts of ATP and MgSO4, fixed amounts of 14C-D-luciferin or D-luciferin were added, and the bioluminescence signal was measured. Light signal was detected by the luminometer from an amount of 8 ng FL on. The detected amount of light signal is displayed on the y-axis and given in relative light units (RLU) per minute. There were no significant differences in the measured light yields when using 14C-D-luciferin in comparison to unlabeled luciferin (p=0.36). b To test the functionality of 14C-D-luciferin in cell culture, 293T cells expressing FL and native cells were investigated. After adding corresponding amounts of unlabeled or 14C-labeled D-luciferin to the wells, light emission was measured in a CCD camera. Up to 173 min after adding the substrate to the FL-expressing 293T cells, we found slightly lower light levels (p=0.02) in wells with labeled D-luciferin, at time point 720 min, no significant differences were observed (p=0.2)
To test the functionality of 14C-D-luciferin in cell culture, 293T cells, plated in a 12-well culture plate, were transfected with pCMV-luciferase plasmid (CMV-Luc, 2 μg CMV-Luc per row). Twenty-four hours later, 1.0 μg 14C-D-luciferin or a corresponding amount of unlabeled D-luciferin was added to each well (cells in PBS). The bioluminescence light emission of wells measured in an optical CCD camera with 14C-D-luciferin was compared to light emission of wells with unlabeled D-luciferin. Up to 173 min after adding the substrate to the FL-expressing 293T cells, we found slightly lower light levels (p=0.02) in wells with labeled D-luciferin. At time point 720 min, no significant differences between wells exposed with unlabeled or 14C-labeled D-luciferin are observed (p=0.2; Fig. 2b).
FL-expressing cells in FBS-containing media show only minimal enhanced 14C-D-luciferin uptake levels compared to cells not expressing FL
The 293T control cells and transiently transfected cells expressing FL were exposed for up to 70 min to cell media containing FBS with 14C-D-luciferin. Only minimally enhanced (p=0.2, not statistical significant) accumulation levels of 14C-derived radioactivity in transfected cells—as compared to nontransfected cells—are observed (see Supplemental Fig. 1 on the website).
Adding mass amounts of cold D-luciferin to the cell media further enhances intracellular 14C-D-luciferin uptake levels
Adding mass amounts of unlabeled D-luciferin (1,500 μg per well in a 12-well plate) additionally to trace amounts (3.7 kBq per well) of 14C-D-luciferin enhances 14C-D-luciferin uptake in cells expressing FL when the cells are kept in cell media containing FBS. The 14C-D-luciferin cell uptake at 15 min is 1.6-fold higher when adding mass amounts of unlabeled D-luciferin (p=0.04; Fig. 3). Adding higher activity levels of 14C-D-luciferin alone is not able to further enhance the cell uptake levels. There is also no peak uptake in the first 5 min (data not shown).
Fig. 3.

293T CMV-Luc cells were exposed for 15 min with 14C-D-luciferin, followed by cell uptake measurements for 14C-derived radioactivity. The cell uptake of 14C-D-luciferin is 1.6 fold higher (p=0.04) in the presence of mass amounts of unlabeled D-luciferin during the uptake period. Sample 1: 293T-CMV-Luc cells, +14C-D-luciferin. Sample 2: 293T-CMV-Luc cells, +14C- D-luciferin+mass amounts of carrier D-luciferin. Sample 3: No radioactivity added (background control with 293T-CMV-Luc cells)
The FL-expressing cells kept in serum-free PBS compared to native cells kept in PBS show significantly higher level of intracellular accumulation of 14C-D-luciferin over time
293T cells transiently transfected with CMV-luciferase (2 μg per row) show significantly higher uptake levels in comparison to native 293T cells when exposed to PBS containing 14C-D-luciferin (3.7 kBq per well, 12-well plate). Cells show the highest uptake values (up to 22.9-fold higher in fluc-transfected vs. nontransfected cells, p value= 0.0002) after a 3-h exposure with PBS containing 14C-D-luciferin (Fig. 4a).
Fig. 4.

a 293T cells transiently transfected with CMV-Luc show significant (p=0.0002) higher uptake levels in comparison to native 293T cells, when exposed to PBS containing 14C-D-luciferin. The transfected cells show highest uptake values (up to 22.9-fold higher in fluc transfected vs. nontransfected cells) after a 3-h exposure with PBS containing the radiotracer. b 293T cells transiently transfected with different amount of CMV-Luc plasmid show highest intracellular uptake levels of 14C-D-luciferin after transfection with 10 μg per fluc plasmid per row. Cell uptake time was 1 h
CMV-Luc-transfected 293T cells in PBS without FBS show highest intracellular trapping of 14C-D-luciferin after transfection with 10 μg CMV-Luc
293T cells transiently transfected with different amount of CMV-Luc plasmid (from 2 up to 10 μg per row in a 12-well plate) show highest intracellular uptake levels after transfection with 10 μg CMV-Luc per row, when exposed to PBS containing 14C-D-luciferin (3.7 kBq per well; Fig. 4b). Incubation time of the cells with 14C-D-luciferin in PBS was 1 h. The amount of transient intracellular accumulation of 14C-D-luciferin is dependent on the intracellular FL levels. Accumulation of radioactivity in the transfected cells is significantly higher as compared to native 293T cells (p< 0.005 after transfection with 10 μg CMV-Luc per row).
Efflux experiments carried out in FL-expressing cells kept in media demonstrates that most of the efflux takes place in the first 30 min after the uptake period
293T Luc cells and native 293T cells were incubated for 1 h with 14C-D-luciferin containing cell media and FBS. Then, the cells were washed two times and kept with fresh medium. At different time points, 100 μl of the supernatant was taken and measured for 14C-D-luciferin. The cell lysate was also measured in the scintillation counter. As displayed in Fig. 5, most of the efflux takes place in the first 30 min after termination of the cell uptake period. However, FL-expressing cells show significantly higher radioactivity levels as compared to native cells up to 2.5 h after start of the efflux experiment (p<0.05).
Fig. 5.

293T CMV-Luc cells and native 293T cells were incubated for 1 h with 14C-D-luciferin containing cell media and FBS. Then, the radioactivity efflux from the cells was measured. Most of the efflux takes place in the first 30 min
Biodistribution after tail-vein coinjection of carrier cold D-luciferin added with 14C-D-luciferin in mice without fluc expression
Experiments were carried out in nude mice (N= 8) without fluc expression. 14C-D-Luciferin (18.5 kBq) and 3 mg D-luciferin was coinjected via the tail vein. Two mice per time point and three tissue samples of each tissue type were measured for 14C-derived radioactivity. Biodistribution of 14C-D-luciferin after tail-vein injection shows early high uptake values in the kidneys; 15 min after injection, significant uptake was observed in most of the organs with low uptake in the brain, and 30 min after injection, high activity in the gastrointestinal tract was observed. Blood levels and liver activity (approximating blood pool at early time points) peak early but then fall rapidly. The data are detailed in Fig. 6a.
Fig. 6.

a Biodistribution of 14C-D-luciferin in nude mice without fluc expression after tail-vein injection of 18.5 kBq 14C-D-luciferin and 3 mg carrier D-luciferin. Note the early high uptake values in the kidneys due to fast renal excretion of the tracer; 15 min after injection, significant uptake in most of the organs is demonstrated with low uptake in the brain. Blood levels and liver activity, which equals blood pool at early time points, peak early but fall rapidly. b Biodistribution of 14C-D-luciferin in nude mice without fluc expression after intraperitoneal injection with the same amounts of tracer and carrier like above. Note the differences in biodistribution after intraperitoneal injection in comparison to intravenous injection: Blood levels rise less high but are longer detectable. Kidney activity peaks later. In general, organ activity is not getting as high as after intravenous injection. Bowel/intestine activities are at early time points high probably due to the injection route
Biodistribution after intraperitoneal injection of carrier cold D-luciferin added with 14C-D-luciferin in mice differ from the results after tail-vein injection
The experiments were carried out in nude mice (N=8) without fluc expression. 14C-D-Luciferin (18.5 kBq) and 3 mg D-luciferin were coinjected intraperitoneally. Two mice per time point and three tissue samples of each tissue type were measured for 14C-D-luciferin-derived radioactivity. There are significant (p<0.05) differences in biodistribution after intraperitoneal in comparison to intravenous injection: Blood levels rise slower and do not peak to as high levels but are detectable for a prolonged time after intraperitoneal injection. Kidney activity peaks much later. In general, organ activity does not get as high as after intravenous injection but stays increased for a prolonged time. Brain uptake is low with both routes; highest levels are reached in the first 5 min after injection but not significantly higher than after intraperitoneal injection of the tracer (p=0.09). Bowel/intestine shows high activity after (local) intraperitoneal injection. The data are listed in Fig. 6b.
Significant differences of biodistribution patterns after intravenous injection of labeled/or injection of carrier cold D-luciferin added with 14C-D-luciferin are detectable in the kidneys
Differences of the biodistribution patterns were evaluated in nude mice (N=8) which were intravenously injected with only labeled/or coinjected with mass levels of carrier cold D-luciferin added to the 14C-D-luciferin (18.5 kBq 14C-D-luciferin and 3 mg unlabeled D-luciferin). The results were evaluated 1 and 5 min after injection of the tracer. The data are plotted in Fig. 7. We detected very high radioactivity levels in the kidneys if no mass level of carrier was coinjected, pointing to a possibly higher renal excretion of the tracer. The fact that kidney activity is much higher after only 14C-D-luciferin in comparison to carrier and 14C-D-luciferin is highly significant (p=0.0015 after 5 min). However, no consistent significant uptake differences in organs other than the kidneys could be detected 5 min after injection of only 14C-D-luciferin or 14C-D-luciferin and carrier D-luciferin. One minute after injection of only labeled or carrier added 14C-D-luciferin, observed radioactivity levels in the blood pool are slightly but not significantly higher in coinjected mice (p=0.07).
Fig. 7.

Differences of the biodistribution patterns were evaluated in nude mice not expressing FL which were intravenously injected with only labeled 14C-D-luciferin or mass levels of carrier added to the 14C-D-luciferin (18.5 kBq 14C-D-luciferin and 3 mg D-luciferin). The results were evaluated 1 and 5 min after injection of the tracer. Kidney activities are significantly higher, if only 14C-D-luciferin is injected, but other organ activities do not differ significantly with our without coinjection of mass levels of carrier substrate
Autoradiographic studies verified the results obtained in the biodistribution experiments
To further confirm the biodistribution results obtained from the different tissues, autoradiograms of animals (N=6) injected with the 14C-D-luciferin in similar conditions were studied (Fig. 8). Autoradiographic studies after tail-vein injection of 14C-D-luciferin demonstrate inhomogeneous tracer distribution in mice with early predominant high radioactivity values in the kidneys and later predominant uptake in the gastrointestinal tract, likely reflecting the second elimination route of the tracer via the hepato-biliary system.
Fig. 8.
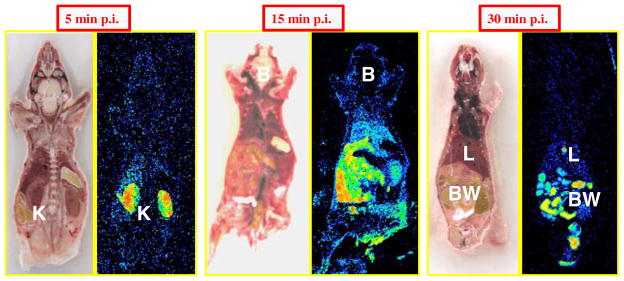
Autoradiograms (N=6 mice) 5, 15, and 30 min after coinjection via the tail vein of 18.5 kBq 14C-D-luciferin and 3 mg carrier D-luciferin. Autoradiographic studies verified results from the biodistribution experiments with early high uptake values in the kidney followed by accumulation in the gut system (K kidney, B brain, L liver, BW bowel)
Autoradiograms 1 min after injection of only labeled or carrier-added 14C-D-luciferin were developed on the same plate using the exact same color scale (Supplemental Fig. 2 on the website; N=4). Consistent with the biodistribution data of radioactivity levels in the blood pool at this time point, we observed—especially in the liver—slightly higher uptake levels if mass levels of unlabeled D-luciferin are coinjected with 14C-D-luciferin.
Optical imaging and biodistribution data in mice expressing FL demonstrates no trapping of 14C-D-luciferin in FL-expressing tissue in vivo
Experiments were done in nude mice at least 72 h after tail-vein injection of equivalent titers of Ad-pCMV-luciferase (Adenovirus carrying the fluc under the control of the CMV promoter; N=6) or a control virus (N=5). Mice were injected with 18.5 kBq 14C-D-luciferin and 3 mg D-luciferin (one mouse of each group received only 14C-D-luciferin). D-Luciferin was injected via tail vein or intraperitoneally, and uptake differences in %ID/g tissue in fluc-expressing livers vs. control livers were examined. Mice were killed immediately after CCD camera imaging of the animals so that light signals from transfected and control mice could also be documented and correlated to the well counter results. Experiments utilizing intraperitoneal injections of the tracer could not detect uptake differences in %ID/g in fluc-expressing vs. control livers (data not shown). One major obstacle in this setting was that peak organ activity of 14C-D-luciferin is less high after intraperitoneal injection compared to the intravenous route. This makes it difficult to detect possibly relatively small 14C-D-luciferin uptake differences in FL-expressing vs. control tissue.
Time points from 1 min after intravenous injection of 14C-D-luciferin up to 1 h after injection of the tracer were examined. The uptake differences in the %ID/g levels of transfected vs. not transfected tissue detected after intravenous injection are relatively small, with the biggest differences found 4 min after carrier-added injection of 14C-D-luciferin:
Pooled uptake data in %ID/g of six CMV-Luc-transfected livers vs. five control livers are showing 13.24±1.1% ID/g in the fluc-transfected livers vs. 9.45±1.79%ID/g in the livers of the control animals (p=0.047; Fig. 9). Average light signals of the livers in six fluc-transfected vs. five control mice were 7.29E+07±3.12E+07 vs. 3.12E+05± 1.49E+05 (p=0.03); the bioluminescence signal is represented as photons per second per square centimeter per steradian.
Fig. 9.
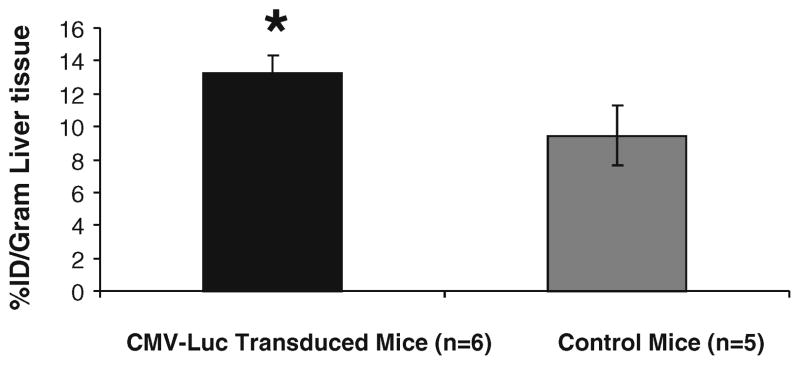
Mice were transduced by injecting Ad-CMV-luciferase via the tail vein; the control mice were injected with a control virus without the fluc sequence. Five minutes after tail-vein injection of 14C-D-luciferin and mass level of carrier D-luciferin, mice were imaged in a CCD camera, and organs were harvested immediately after imaging to measure uptake in %ID/g. In pooled data over six fluc-transfected and five control mice, the difference in 14C-D-luciferin uptake was only borderline significant (p=0.0047). No higher uptake differences between fluc-transfected and control tissue could be detected at earlier or later time points in similar experiments
Higher 14C-D-luciferin uptake differences between FL-expressing and nonexpressing tissue could not be detected after longer uptake times, shorter uptake time, or after intraperitoneal injection of the tracer (data not shown).
Discussion
For in vitro luciferase assays, a linear relationship between enzyme concentration and light signal can be ensured by controlled reaction conditions which include provision of the D-luciferin substrate in excess [10]. In vivo luciferase reporter gene imaging in mice implies the assumption that the intensity of light signal reliably reflects the regional transgene expression levels. For a fixed concentration of enzyme, a decrease in local substrate availability will cause a decline in the reaction rate [11]. Therefore, local availability and biodistribution of administered D-luciferin are of concern for optical-based in vivo luciferase reporter gene imaging.
We first verified that 14C-D-luciferin can serve as a reliable substrate for FL. In a previous work, Lee et. al. [12] synthesized radiolabeled D-luciferin by electrophilic radio-iodination of D-luciferin with Na 123/125I. Although the authors stated that iodo-D-luciferin partially retained substrate specificity for FL, the introduction of iodine into the molecule still raises questions whether this modification might have a significant impact on the functional characteristic and biodistribution patterns of the substrate relative to the unlabeled form.
Our tracer was produced utilizing an alternate synthesis pathway [8], and the end product, D-luciferin, [benzene ring–14C(U)]–, approximately one carbon atom per molecule in the benzene ring was randomly replaced by 14C. No foreign atoms or charge were introduced into the molecule to ensure that no significant changes in the functionality of the radiolabeled substrate occur. Our experiments in buffer solution demonstrated as expected no significant functional differences between 14C-labeled D-luciferin and cold D-luciferin. These results support that 14C-D-luciferin can be utilized as an appropriate tracer for the parent D-luciferin. The slightly lower light emission of 14C-D-luciferin observed in cell culture was not consistent over the whole time frame of the experiment. Results of 14C-D-luciferin cell uptake experiments support the previously published results of relatively low permeability of D-luciferin through cell membranes [13]. Intracellular uptake levels of the tracer were very low in both native and FL-expressing cells. Adding mass amounts of cold D-luciferin as carrier to the medium moderately increased intracellular uptake levels. This supports the theory of a diffusion-based uptake of D-luciferin. The serum proteins in the medium, to which trace amounts of 14C-D-luciferin can bind and of which the mass amounts could displace the 14C-D-luciferin, might also contribute to the observed increased intracellular uptake levels in the presence of the carrier.
No significant differences in uptake patterns of the tracer could be detected in native versus fluc-transfected cells, when the cells were kept in media containing FBS. It is interesting to note, however, that significant accumulation of radioactivity was observed in fluc-transfected cells in culture when the cells were exposed to PBS containing radiolabeled D-luciferin. It can be speculated that FBS-containing media with saturated level of proteins may interfere with the intracellular entry of D-luciferin, so that the minimal intracellular accumulation of the substrate could only be detected in cells kept in protein-free PBS. The polar nature of the converted oxyluciferin [14] might contribute to the observed intracellular accumulation of radioactivity in cells expressing FL.
The results of the 14C-D-luciferin efflux experiments with the fast efflux of the tracer do not support the concept of a prolonged intracellular trapping of D-luciferin or its metabolites in FL-expressing cells.
Biodistribution of 14C-D-luciferin after tail-vein injection of carrier-added 14C-D-luciferin shows early high uptake values in the kidneys indicating early renal excretion of the tracer. Early high activity levels in liver tissue represent blood pool activity. Five and 15 min after injection, significant uptake is present in most of the organs with low uptake in brain tissue.
There are significant differences in biodistribution after intraperitoneal injection in comparison to intravenous injection of carrier-added 14C-D-luciferin: A general advantage when using the intravenous injection route was the low variation of uptake values in %ID/g in tissues of different mice. After intraperitoneal injection, organ uptake is prolonged in comparison to intravenous injections. Brain uptake is low with both routes. Intestinal uptake is high after (local) intraperitoneal injection.
The measured higher activities in the organs at later time points (45 min after injection) in the biodistribution study by Lee et. al. [12] is probably in part due to the accumulation of free iodine and might not reflect to the full extent the tracer levels. The relatively high activity levels in the stomach measured at later time points by Lee et al. are also indicative of free iodine (transported into the lumen of the stomach by the sodium iodide symporter).
Biodistribution data in our study confirm relatively low organ activities of the tracer, which likely influence the light signal. It is critical for the planning of optical imaging experiments to decide the injection route. If early and high uptake values are the key, then intravenous injection should be preferred. Intraperitoneal injections are better suited if prolonged organ uptake is important. Location of the area to be studied can also have an impact on the choice of the injection route. The exact timing of the data acquisition relative to time of injection is also critical.
Comparisons of mice intravenously injected with only labeled or carrier-added 14C-D-luciferin clearly showed much higher kidney activity (approximately sevenfold after 1 min, approximately fourfold after 5 min) in mice which were only injected with labeled tracer. Renal excretion of 14C-D-luciferin, the predominant route of excretion of the tracer, is decreased when adding higher amounts of cold D-luciferin to the injection volume. One minute after injection, a higher blood pool activity in coinjected mice was detectable.
We also examined mice after tail-vein injection of high titers of adenovirus carrying the CMV-Luc gene, which leads to high fluc expression levels in the liver (adenoviral infection is mediated by coxsackievirus and adenovirus receptor which are expressed in high density in liver tissue of mice) [15]. Although we found higher organ activity 4 min after injection of carrier-added 14C-D-luciferin in fluc-transfected livers (with a low statistical significance level), consistent data to prove significant trapping of the tracer in tissue expressing high levels of FL could not be demonstrated in vivo. Significant intracellular accumulation of 14C-D-luciferin could not be observed in FL-expressing cells in vivo. It can be speculated that this might be in part due to the low cell membrane permeability of the tracer, which in combination with protein binding and fast renal excretion leads to a rapid tracer washout.
In summary, we successfully introduced for the first time 14C-D-luciferin as a substrate tracer for the FL-catalyzed bioluminescence reaction. We detailed in vitro cell uptake and efflux characteristics as well as biodistribution patterns of this tracer in living mice. However, we did not observe accumulation of the tracer in luciferase-expressing cells in vivo.
Future studies will benefit from the evaluation of biodistribution patterns of radiolabeled coelenterazine and other substrates of optical imaging probes in efforts to characterize alternate optical imaging systems. In future studies of optical imaging probes, a search for probes in which intracellular trapping of the radiolabeled substrate correlates with light yield would be useful. Such intracellular trapping of a substrate in vivo would possibly allow the development of a dual modality optical/radiotracer reporter system.
Since optical/PET scanners are already in development [16], a combined radiolabeled PET/optical multimodality tracer—with corresponding and correlative trapping of the substrate in light emitting cells—would be a significant step in the emerging scientific field of multimodality molecular imaging.
Supplementary Material
Acknowledgments
This work was supported by National Cancer Institute (NCI) Small Animal Imaging Resource Program (SAIRP) grant R24 CA93862, NCI ICMIC P50 CA114747 (SSG), and NIH R01 CA82214 (SSG). FB was supported by a grant of the German Research Foundation (DFG), a grant by the Bayerisch-Kalifornische Hochschulinitiative (BACATEC), and the Friedrich Baur Stiftung. We also thank Xenogen for purchasing 14C(U)-labeled D-luciferin from Moravek Biochemicals. The reported experiments comply with the current laws of the USA inclusive of ethics approval.
Abbreviations
- FL
firefly luciferase
- Fluc
firefly luciferase gene
- CMV-Luc
CMV-luciferase plasmid
- PBS
phosphate-buffered saline
- FBS
fetal bovine serum
- Ad-CMV-Luciferase
adenovirus carrying fluc under the control of the cytomegalie virus promoter
- 293T Luc cells
293T cells expressing the Firefly luciferase gene
- %ID/g
percent injected dose/gram
Footnotes
Conflict of interest statement All authors state that they have no conflict of interests.
Electronic supplementary material The online version of this article (doi:10.1007/s00259-008-0870-6) contains supplementary material, which is available to authorized users.
Contributor Information
Frank Berger, Email: Frank.Berger@med.uni-muenchen.de, Department of Clinical Radiology, Ludwig-Maximilians University Munich, Marchioninistr. 15, 81377, Munich, Germany.
Ramasamy Paulmurugan, Departments of Radiology and Bioengineering, Molecular Imaging Program at Stanford, James H. Clark Center, 318 Campus Dr, East Wing, first floor, Stanford, CA 94305-5427, USA.
Srabani Bhaumik, GE Global Research, Niskayuna, NY, USA.
Sanjiv Sam Gambhir, Email: sgambhir@stanford.edu, Departments of Radiology and Bioengineering, Molecular Imaging Program at Stanford, James H. Clark Center, 318 Campus Dr, East Wing, first floor, Stanford, CA 94305-5427, USA.
References
- 1.Contag CH, Ross BD. It’s not just about anatomy: in vivo bioluminescence imaging as an eyepiece into biology. J Magn Reson Imaging. 2002;16:378–87. doi: 10.1002/jmri.10178. [DOI] [PubMed] [Google Scholar]
- 2.Massoud TF, Gambhir SS. Molecular imaging in living subjects: seeing fundamental biological processes in a new light. Genes Dev. 2003;17(5):545–80. doi: 10.1101/gad.1047403. [DOI] [PubMed] [Google Scholar]
- 3.Iyer M, Sato M, Johnson M, Gambhir SS, Wu L. Applications of molecular imaging in cancer gene therapy. Curr Gene Ther. 2005;5 (6):607–18. doi: 10.2174/156652305774964695. [DOI] [PubMed] [Google Scholar]
- 4.Bhaumik S, Gambhir SS. Optical imaging of Renilla luciferase reporter gene expression in living mice. Proc Natl Acad Sci USA. 2002;99(1):377–82. doi: 10.1073/pnas.012611099. [DOI] [PMC free article] [PubMed] [Google Scholar]
- 5.Tannous BA, Kim DE, Fernandez JL, Weissleder R, Breakefield XO. Codon-optimized Gaussia luciferase cDNA for mammalian gene expression in culture and in vivo. Mol Ther. 2005;11(3):435–43. doi: 10.1016/j.ymthe.2004.10.016. [DOI] [PubMed] [Google Scholar]
- 6.Contag PR, Olomu IN, Stevenson DK, Contag CH. Bioluminescent indicators in living mammals. Nat Med. 1998;4:245–7. doi: 10.1038/nm0298-245. [DOI] [PubMed] [Google Scholar]
- 7.Gheysens O, Gambhir SS. Studying molecular and cellular processes in the intact organism. Prog Drug Res. 2005;62:117–50. doi: 10.1007/3-7643-7426-8_4. [DOI] [PubMed] [Google Scholar]
- 8.Bowie LJ. Synthesis of radiolabeled Luciferin. Methods in Enzymol. 1985;57:18–24. [Google Scholar]
- 9.Gambhir SS, Barrio JR, Wu L, Iyer M, Namavari M, Satyamurthy N, et al. Imaging of adenoviral-directed herpes simplex virus type 1 thymidine kinase reporter gene expression in mice with radiolabeled ganciclovir. J Nucl Med. 1998;39(11):2003–11. [PubMed] [Google Scholar]
- 10.Nguyen VT, Morange M, Bensaude O. Firefly luciferase luminescence assays using scintillation counters for quantitation in transfected mammalian cells. Anal Biochem. 1988;171(2):404–8. doi: 10.1016/0003-2697(88)90505-2. [DOI] [PubMed] [Google Scholar]
- 11.Lembert N, Idahl LA. Regulatory effects of ATP and luciferin on firefly luciferase activity. Biochem J. 1995;305(Pt 3):929–33. doi: 10.1042/bj3050929. [DOI] [PMC free article] [PubMed] [Google Scholar]
- 12.Lee KH, Byun SS, Paik JY, Lee SY, Song SH, Choe YS, et al. Cell uptake and tissue distribution of radioiodine labelled D-luciferin: implications for luciferase based gene imaging. Nucl Med Commun. 2003;24:1003–9. doi: 10.1097/00006231-200309000-00009. [DOI] [PubMed] [Google Scholar]
- 13.de Wet JR, Wood KV, DeLuca M, Helinski DR, Subramani S. Firefly luciferase gene: structure and expression in mammalian cells. Mol Cell Biol. 1987;7(2):725–37. doi: 10.1128/mcb.7.2.725. [DOI] [PMC free article] [PubMed] [Google Scholar]
- 14.Wang JQ, Pollok KE, Cai S, Stantz KM, Hutchins GD, Zheng QH. PET imaging and optical imaging with D-luciferin [11C] methyl ester and D-luciferin [11C]methyl ether of luciferase gene expression in tumor xenografts of living mice. Bioorg Med Chem Lett. 2006;16(2):331–37. doi: 10.1016/j.bmcl.2005.09.082. [DOI] [PubMed] [Google Scholar]
- 15.Adams JY, Johnson M, Sato M, Berger F, Gambhir SS, Carey M, et al. Visualization of advanced human prostate cancer lesions in living mice by a targeted gene transfer vector and optical imaging. Nat Med. 2002;8(8):891–7. doi: 10.1038/nm743. [DOI] [PubMed] [Google Scholar]
- 16.Cherry SR. In vivo molecular and genomic imaging: new challenges for imaging physics. Phys Med Biol. 2004;49(3):R13–48. doi: 10.1088/0031-9155/49/3/r01. [DOI] [PubMed] [Google Scholar]
Associated Data
This section collects any data citations, data availability statements, or supplementary materials included in this article.