Abstract
Amyloid fibrils and their soluble oligomeric intermediates are implicated in several age-related diseases including Alzheimer’s and Parkinson’s disease. The distribution of oligomers and fibrils is related to toxicity and is dependent on the pathways for fibril assembly, generally considered to occur via a slow nucleation step that precedes fibril elongation. Human apolipoprotein (apo) C-II forms amyloid fibrils via a reversible self-assembly process accompanied by closed-loop formation and fibril breaking and joining. Our fluorescence quenching and sedimentation velocity experiments with Alexa488-labelled apoC-II indicated a time-dependent sub-unit interchange for both linear and closed-loop fibrils, while dilution experiments using mature fibrils indicated a shift to smaller size distributions consistent with a reversible assembly pathway. To account for this behaviour we developed an equilibrium self-association model that describes the final size distributions of apoC-II fibrils formed at different starting concentrations. The model proposes a reversible isomerisation of apoC-II monomer to form an active conformer that self-assembles into fibrils via an isodesmic self-association pathway coupled to fibril length-dependent closed-loop formation. The model adequately described fibril size distributions and the proportion of closed-loops as a function of total apoC-II concentration over the concentration range 0.1–0.5 mg/ml. Extension of the model to include the rates of isomerisation, self-association and fibril breaking and joining provided satisfactory global fits to kinetic data on fibril formation and changes in average fibril size at different apoC-II starting concentrations. The model provides a simple thermodynamic description of the processes governing the size distribution of apoC-II fibrils at equilibrium and the formation of discrete oligomeric intermediates.
Several common neurological and systemic diseases are accompanied by the aggregation of misfolded proteins to form insoluble amyloid fibrils1; 2. These fibrils are defined by a characteristic cross-β structure and the ability to interact with the dyes thioflavin T and Congo Red3. While amyloid fibril deposits have been implicated in the disease process it is widely considered that toxicity is mediated by small oligomeric intermediates in the assembly pathway4; 5. The observation of a distinct lag phase in the kinetics of amyloid fibril formation forms the basis for nucleated kinetic models for fibril assembly that involve the initial slow formation of a nucleus that serves as a template for fibril elongation6; 7. A feature of simple nucleated kinetic models is the transient nature of the nucleus and lack of stable intermediates. More recent models have incorporated fibril breaking, joining, and lateral association events as additional mechanisms to describe the kinetics of fibril formation and the heterogeneity of the end product8; 9; 10; 11; 12; 13. A significant finding is the observation that fibril fragments produced from breaking and joining enhance amyloid fibril cytotoxicity14.
We have developed amyloid fibril formation by human apolipoprotein (apo) C-II as a system to examine the steps involved in fibril assembly. ApoC-II is a 79 amino acid co-factor of lipoprotein lipase and an integral component of the lipid-rich very low density lipoproteins and chylomicrons, which transport lipids through the bloodstream. Under lipid-free conditions in vitro, apoC-II spontaneously aggregates to form homogenous fibrils with all the hallmarks of amyloid15. Fibrils composed of apoC-II activate a pro-inflammatory macrophage signalling cascade mediated by the CD36 scavenger receptor16, which is a key feature of vascular inflammation leading to lesion development. Kinetic analysis of the rate of formation of apoC-II fibrils as a function of starting concentration coupled with an analysis of the size distribution of the fibrillar products led to the development of a model for fibril formation that involves reversible nucleated assembly from monomers coupled with fibril breakage and joining17. Direct evidence for fibril breakage and joining was provided by antibody-labelling transmission electron microscopy studies17. A limitation of the analysis was the observed correlation of some of the fitting parameters as well as the difficulty of defining the size of the nucleus. In addition, the analysis neglected the formation of closed-loop structures by apoC-II18.
Structural analyses of apoC-II amyloid fibrils indicate the apoC-II monomer within fibrils adopts a “letter G-like” conformation that stacks to form an in-register structure composed of two parallel β-sheets19. This structural model suggested a simple mechanism for fibril assembly involving a reversible isomerisation of apoC-II subunits to form a conformer that self-assembles into linear fibrils, via an isodesmic self-association process governed by a single equilibrium constant. Isodesmic, non-cooperative self-association models have been described for a number of interacting protein systems20; 21; 22; 23. An equilibrium isodesmic model for apoC-II fibril formation could account for the formation of closed-loop structures by assuming circularization via a length-dependent probability of loop closure15; 18. Closed-loop fibrils24, discrete oligomers25 and pore-like annular protofibrils26 have been observed in several amyloid forming systems, accounting for much of the heterogeneity inherent in fibril populations. In the present study we have developed a generally applicable and comprehensive thermodynamic model to describe the formation and equilibrium size distribution of linear and closed-loop apoC-II amyloid fibrils.
Results
ApoC-II fibril size distributions
Studies of the concentration dependence of apoC-II fibril formation, have shown that the average sedimentation coefficients of fibrils, formed in the concentration range 0.1 to 0.6 mg/ml, reach stable time-independent values after 6–7 days17, indicating an equilibrium condition. Sedimentation velocity data for apoC-II fibrils at equilibrium after 7 days at 0.3 mg/ml (pre-formed fibrils) are presented in Figure 1. Fitting the data to a continuous size distribution indicated two separate populations of fibrils, with modal sedimentation coefficients of approximately 36 S and 88 S. Assuming a worm-like chain model for apoC-II fibrils, calculated for a persistence length of 36 nm and rise per subunit of 0.47 nm18, these sedimentation coefficients indicate weight-average molecular mass values of 3.0×10⁶ and 2.9×10⁷, corresponding to fibrils composed of approximately 340 and 3300 subunits, respectively. The slower sedimenting population, which accounts for approximately 6.6 % (on a mass scale) of total fibrils at 0.3 mg/ml, is ascribed to the formation of closed-loops17. Size distribution analysis of fibrils formed at different total concentrations of apoC-II indicated a systematic increase in the average sedimentation coefficient of the larger sub-population of fibrils over the concentration range 0.1 – 0.6 mg/ml (Figure 1). As indicated previously, this trend is not consistent with a simple nucleation-elongation model which predicts that low concentrations will restrict nucleation leading to the formation of longer fibrils than those formed at higher concentrations17. An explanation for the concentration dependence of fibril size shown in Figure 1, consistent with the structural model for apoC-II fibrils19, is that the major population of fibrils is formed by the isodesmic self-association of an active conformer, yielding an equilibrium mixture of interacting fibrils. In contrast, values for the weight-average sedimentation coefficient of the slower moving, “closed-loop” fraction did not show a consistent trend over the same concentration range (Figure 1 and Table 1). The results in Table 1 show that the free pool of non-sedimenting apoC-II and the concentration of the closed-loop fraction are relatively independent of the total apoC-II concentration.
Figure 1.
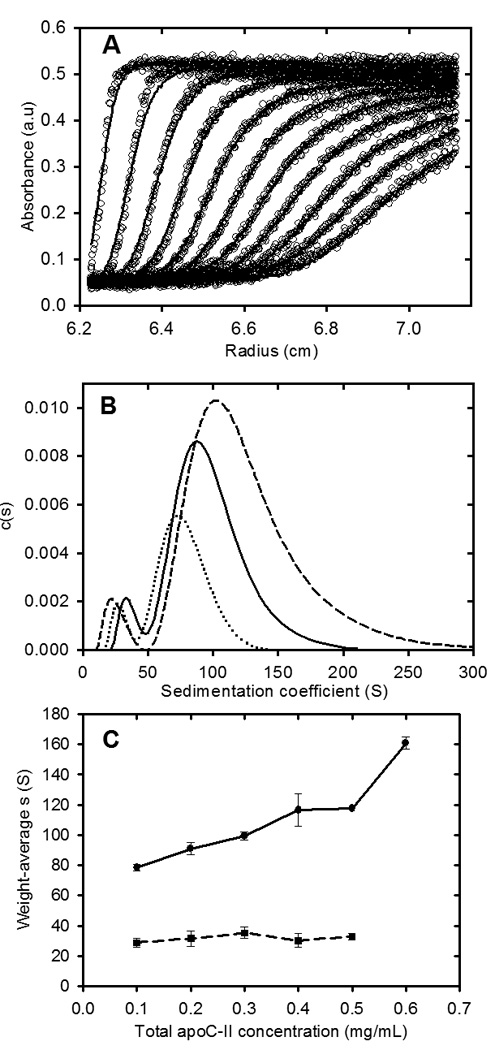
Sedimentation velocity analysis of apoC-II fibrils formed at different apoC-II concentrations. ApoC-II samples were prepared by incubating apoC-II in refolding buffer for 14 days prior analytical ultracentrifugation at 8,000 rpm at 20°C with radial scans taken at 8 minute intervals. Panel A: Radial scans for apoC-II sample (0.3 mg/mL), monitored at 280 nm (open circles). The fit of the data to a c(s) model45 is also shown (solid lines). Panel B: Sedimentation coefficient distributions for fibril samples formed at 0.1 mg/mL (dotted line), 0.3 mg/mL (solid line) and 0.5 mg/mL (dashed line). Panel C: Dependence of the weight-average sedimentation coefficient on total apoC-II concentration for the faster moving and slower moving population of fibrils (closed circles and closed squares, respectively).
Table 1.
Characterization of free pool and closed-loop fraction in apoC-II fibril samples
| Total apoC-II (mg/ml) | Non-sedimenting apoC-II (mg/ml) | Closed loops (mg/ml) |
|---|---|---|
| 0.1 | 0.0193 | 0.0099 |
| 0.2 | 0.0195 | 0.0157 |
| 0.3 | 0.0197 | 0.0197 |
| 0.4 | 0.0231 | 0.0198 |
| 0.5 | 0.0257 | 0.0193 |
| 0.6 | 0.0264 | a |
ApoC-II samples were prepared by incubating apoC-II in refolding buffer for 14 days prior to sedimentation velocity analysis. The concentration of non-sedimenting apoC-II was determined from the optical density in the supernatant at the conclusion of centrifugation.
A closed-loop population was not observed for fibrils formed at 0.6 mg/ml.
Recovery of equilibrium size distributions following shearing of apoC-II amyloid fibrils
Preformed apoC-II fibrils were subjected to a number of shear processes to further establish the equilibrium nature of fibrils formed. The results show that extended vortexing or bath sonication of pre-formed fibrils had little effect on either the weight-average sedimentation coefficient or relative proportion of the two sub-populations of fibrils (Figure 2). In contrast, freeze-thaw cycling of pre-formed apoC-II fibrils led to an initial decrease in the average size of the fibrils and an increase in the proportion of the smaller fibril sub-population. An important observation, however, is that incubation of the freeze-thawed sample for 24 h lead to a recovery of the size distribution towards the distribution observed for a control untreated sample, consistent with the return towards an equilibrium condition. Similar recoveries of fibril size distributions following probe sonication have been reported previously17.
Figure 2.
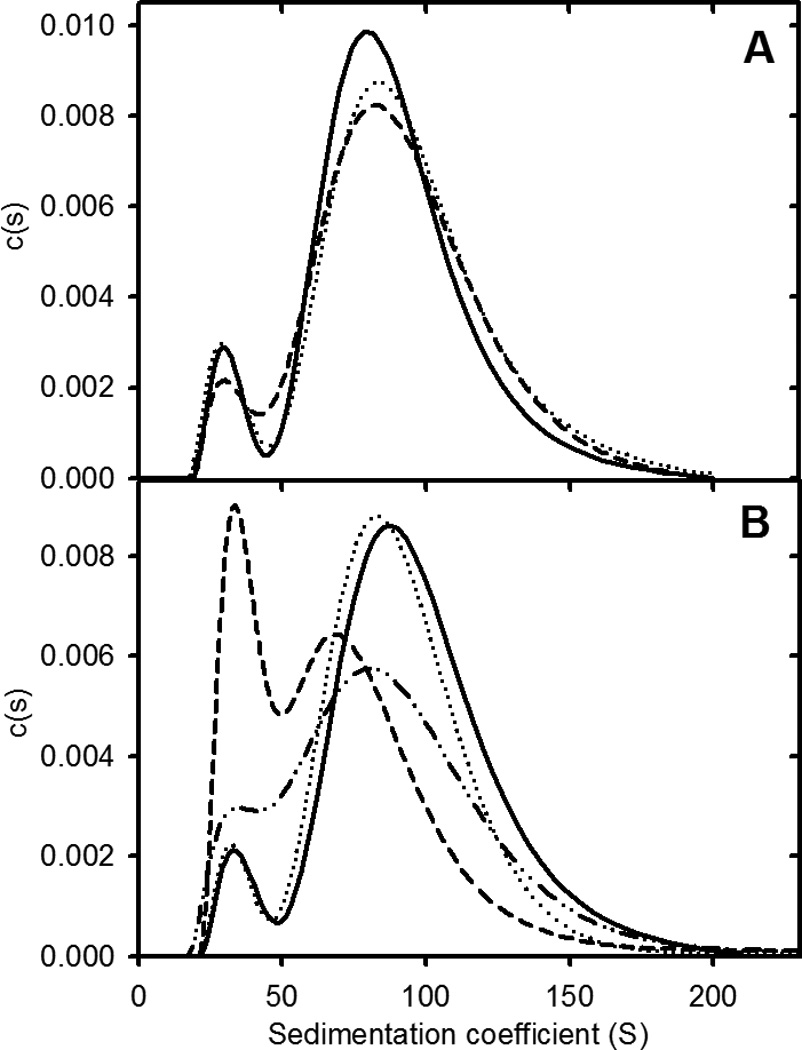
ApoC-II fibril size distributions following exposure to shear. Panel A: Sedimentation coefficient distributions for preformed apoC-II fibrils (0.3 mg/ml; solid line) and for fibrils subjected to rapid vortexing for 20 min (dotted line) and bath sonication for 15 min (dashed line). Panel B: Sedimentation coefficient distributions for preformed apoC-II amyloid fibrils (0.3 mg/mL) before (solid line) and after freeze-thaw treatment (dashed line). Distributions for the untreated sample (dotted line) and freeze-thawed samples (dot-dot-dash line), following incubation at 25° C for 24 h.
Purification of apoC-II closed-loop fibrils
The results in Figure 1 indicate the presence of a smaller sub-population of fibrils ascribed to closed-loops. To further explore the equilibrium status of preformed apoC-II fibrils we developed procedures to purify and characterize the closed-loop sub-population. Preformed apoC-II fibrils were subjected to cycles of freeze-thawing to enrich for closed-loops and preparative ultracentrifugation was used to sediment the linear fibrils leaving closed-loop fibrils enriched in the supernatant. The results in Figure 3 show representative electron micrographs of apoC-II fibrils in the supernatant fraction, revealing a high proportion of closed-loop fibrils. Analysis of the contour lengths of the closed-loops (Figure 3) yielded an average length of approximately 292 nm, corresponding approximately 621 subunits and comparable to the results from previous studies18. Based on a worm-like chain model, this value for the average length of the fibrils gives an estimate of 45.0 S for the average sedimentation coefficient of closed-loops, comparable with the size of the smaller population of fibrils observed in Figure 1.
Figure 3.
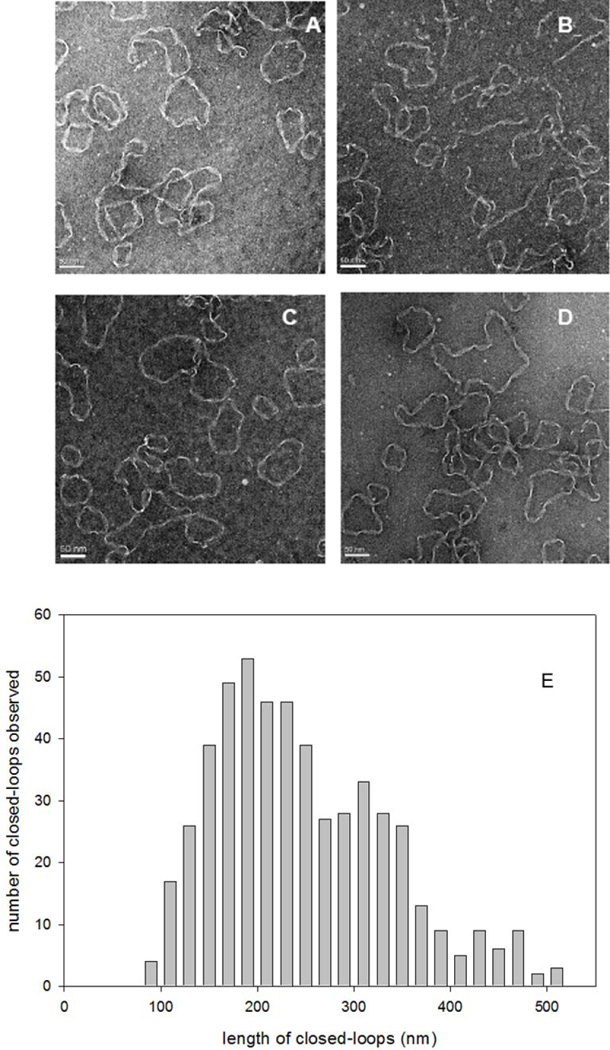
Electron microscopy of purified apoC-II closed-loops. ApoC-II closed-loops were purified from preformed apoC-II fibrils by preparative ultracentrifugation. Panels A–D: Negative staining transmission electron micrographs showing representative images. Scale bars of 50 nm are shown. Panel E: Distribution of the contour lengths of the closed-loops.
Subunit exchange experiments
An isodesmic self-association model for fibril formation proposes a final equilibrium state composed of a mixture of active monomers and fibrils with a single equilibrium constant describing both the addition of an active monomer to the ends of fibrils and the reversible breaking and joining of fibrils. A prediction of this model is that, in the equilibrium state, the addition of labelled monomers to preformed fibrils will lead to subunit exchange of the labelled monomers with the fibrils. To provide additional support for an isodesmic self-association model, subunit exchange experiments were performed. The results in Figure 4 show that the addition of Alexa488-labelled apoC-II to preformed apoC-II fibrils or purified closed-loop fibrils leads to the rapid incorporation of Alexa488-apoC-II into fibrils as indicated by the decrease in the amount of fluorescence detected in the supernatant fraction following centrifugation. A dynamic exchange of subunits has also been observed for other amyloid assemblies27; 28.
Figure 4.
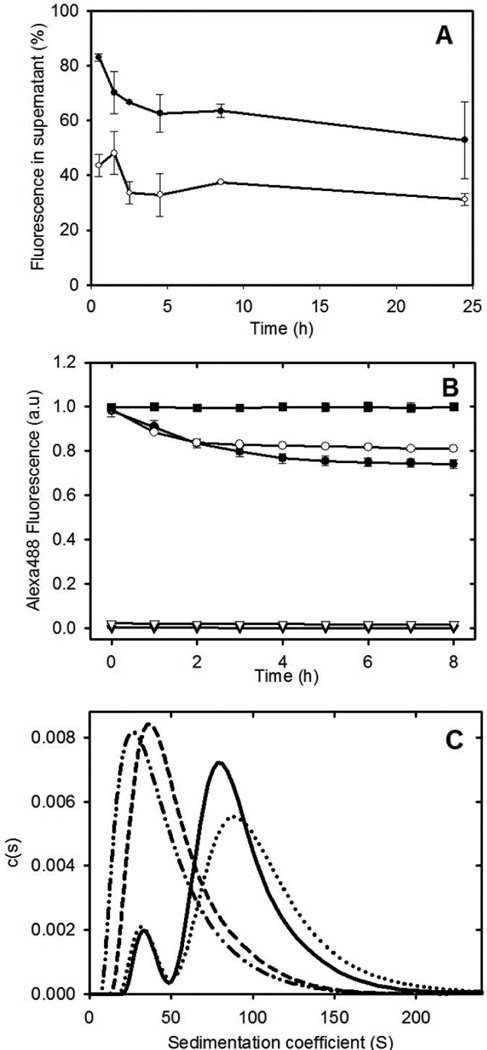
Subunit exchange with apoC-II fibrils. Panel A: Alexa488-labelled apoC-II monomer was added to preformed apoC-II fibril samples (closed circles) or purified closed-loops (open circles). Subunit exchange was monitored by centrifugation of the samples and determination of the Alexa labelled apoC-II fluorescence in the supernatant fraction. Panel B: Alexa488 fluorescence emission measured as a function of time for monomeric Alexa488-labelled apoC-II added to linear fibrils (closed circles), purified closed-loops (open circles), linear fibrils alone (closed triangles) and closed loops alone (open triangles). The fluorescence of free Alexa488-maleimide (0.76 µM), following the addition apoC-II fibrils (15.7 µM), expressed relative to the fluorescence of Alexa488-maleimide alone (closed squares). Panel C: Sedimentation velocity subunit exchange analysis of preformed and closed-loop apoC-II fibrils. Monomeric Alexa488-labelled apoC-II (0.016 mg/ml) was incubated with preformed fibrils or purified closed-loops (0.14 mg/ml) for 4 hrs at 25°C. Sedimentation coefficient distribution analysis was performed at 280 nm to detect total protein for preformed fibrils or purified closed-loops (solid and dashed line, respectively) and at 495 nm to monitor the distribution of Alexa488-labelled apoC-II in preformed fibrils or purified closed-loops (dotted line and dot-dot-dash lines, respectively).
Subunit exchange was also monitored by fluorescence decay experiments. The self-assembly of Alexa488-labelled apoC-II into fibrils has previously been shown to reduce Alexa488 emission29. The addition of Alexa488-labelled apoC-II to preformed apoC-II fibrils or purified closed-loops led to a decrease in Alexa488 fluorescence indicating a time-dependent subunit exchange with both the preformed fibrils and purified closed-loop samples (Figure 4). Control experiments using free Alexa488-maleimide showed no change in fluorescence in the presence of preformed apoC-II fibrils.
The incorporation of Alexa488-labelled apoC-II into the closed-loops suggested an equilibrium between closed-loops and linear fibrils that permits sub-unit exchange with closed loops. Alternatively, the observed exchange could arise from contaminating linear fibrils within the purified closed-loop sample. Size distribution analysis of Alexa488-labelled apoC-II incubated for 4h with preformed or purified closed-loop fibrils is also shown in Figure 4. Monitoring of the sedimentation velocity behaviour at 280 nm to detect total protein shows that the average sedimentation coefficient of the purified closed-loops is approximately 40 S and similar to the values observed for the smaller sub-population present in preformed fibrils (Figure 1). Monitoring the sedimentation behaviour at 495nm shows that the distribution of Alexa488 absorbance is similar to the distribution of total protein, indicating substantial equilibration of Alexa488-labelled apoC-II with both preformed or purified closed-loop apoC-II fibrils. This behaviour is consistent with a dynamic isodesmic self-association model for fibrils at equilibrium with a sub-population of closed-loops.
Dilution of preformed apoC-II amyloid fibrils
A further test of the reversible isodesmic self-association model was to examine whether dilution of preformed apoC-II fibrils reduced the average size of the fibrils. The results in Figure 5 show that a 1:3 dilution of mature apoC-II fibrils formed at 0.3 mg/ml, reduced the modal sedimentation coefficient of the fibrils. This reduction was also apparent in calculated values of the weight-average sedimentation coefficient and was maintained following incubation of the fibrils over a period of 7 days (Table 2). Experiments employing higher dilution factors were performed using Alexa488-labelled apoC-II fibrils and fluorescence detection in the analytical ultracentrifuge. The results in Figure 5 and Table 2 show that dilution of the fibrils by factors of 1:10 and 1:100 decreased the modal sedimentation coefficient of the main population of fibrils and the weight-average sedimentation coefficients of the entire fibril population. These changes were maintained after incubation of the samples for 14 days. The results in Figure 5 also show that high dilution generated a smaller population of fibrils with sedimentation coefficients in the range 10–30S. The overall reductions in average fibril size following dilution attest to the reversibility of apoC-II fibril formation and are consistent with an equilibrium model for fibril formation.
Figure 5.
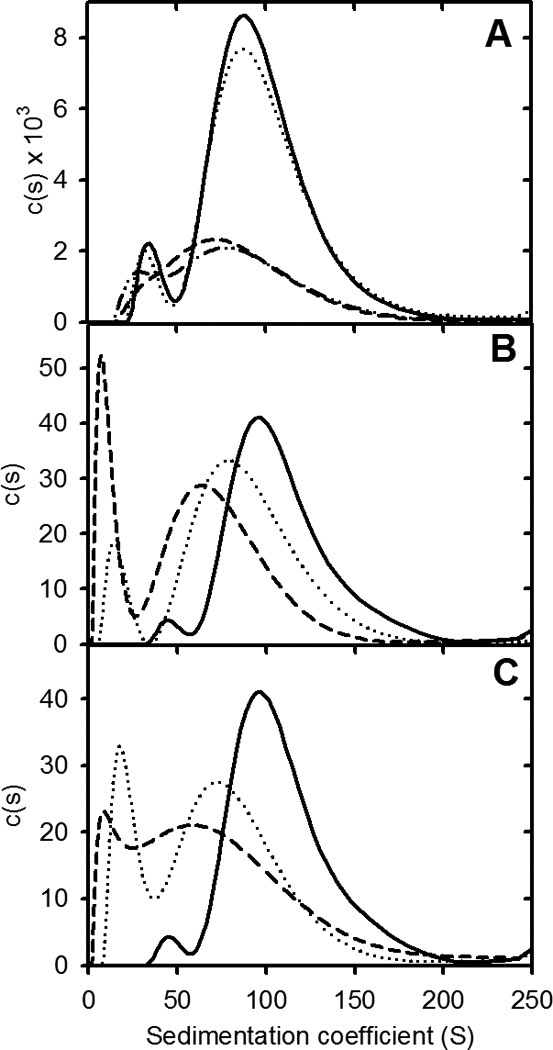
Effect of dilution on apoC-II amyloid fibril size distributions. Panel A: Sedimentation coefficient distributions for preformed apoC-II fibrils (0.3 mg/ml) initially (solid line) and after incubation at 25°C for 7 days (dotted line). Data is also presented for a 1:3 dilution of preformed fibrils, initially (dashed line), and after incubation at 25°C for 7 days (dot-dot-dash line). Sedimentation velocity was monitored at 280 nm. Panels B and C: Sedimentation coefficient distributions for preformed apoC-II fibrils (0.3 ml/ml), incubated with Alexa488-labelled apoC-II and DTT (1 mM) for 4 hrs prior to analysis. Sedimentation velocity was monitored by fluorescence detection. Data is presented for samples diluted 1:10 (Panel B) and 1:100 (panel C), initially (dashed lines) and after incubation at 25°C for 7 days (dot-dot-dash line). The solid lines in panels B and C are scaled distributions obtained for the undiluted sample after incubation for 7 days.
Table 2.
Effect of dilution on the weight-average sedimentation coefficient of preformed apoC-II fibrils
| Dilution | Detection methoda | Initiallya | After 7 or 14 daysa |
|---|---|---|---|
| Undiluted | OD | 98.4 | 98.2 |
| 1:3 | OD | 86.1 | 84.2 |
| Undiluted | Fluorescence | 96.2 | 98.5 |
| 1:10 | Fluorescence | 76.3 | 62.4 |
| 1:100 | Fluorescence | 65.0 | 65.3 |
Studies were performed using preformed Alexa488-labeled apoC-II fibrils.
Weight-average sedimentation coefficients in Svedberg units (S) were measured using SEDFIT44 Results are presented for initial samples and for samples incubated at 25 °C for 7 days for optical density at 280 nm measurements or 14 days for samples monitored by Alexa488 fluorescence.
An equilibrium model to simulate the size distribution of apoC-II amyloid fibrils
A model to describe our experimental results is presented in Figure 6. The model proposes an ensemble of misfolded apoC-II monomers in equilibrium with an active conformer, governed by an isomerisation constant, Ki. The model further proposes that this active conformer self-assembles via an isodesmic self-association process governed by an equilibrium constant, Keq. An intrinsic feature of an isodesmic self-association model is that monomer addition and reversible fibril breaking and joining are characterised by the same equilibrium constant. The reversible formation of closed-loops is accounted for by an equilibrium constant, KL, which describes fibril length-dependent closed-loop opening and closing.
Figure 6.
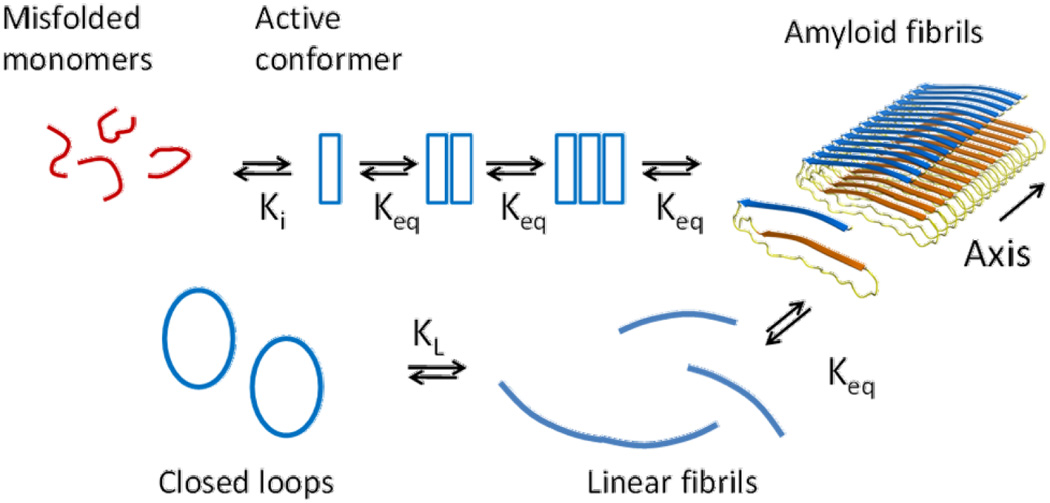
Equilibrium model for apoC-II fibril assembly. The model proposes an initial isomerisation of misfolded apoC-II monomers to form an active conformer that self-assembles into fibrils according to an isodesmic self-association process (equation 1). An integral part of the model is fibril breaking and joining coupled to size dependent closed-loop formation. The equilibrium constants for the various steps are shown. The structural model for apoC-II fibrils shows a linear assembly of monomers in a “letter G-like” conformation19.
The model shown in Figure 6 was used to fit theoretical curves to the size distribution data for apoC-II fibrils formed at different starting concentrations. The parameters of the model used to fit the data in Figure 7 are summarized in Table 3. The results in Figure 7 show good agreement between the modal sedimentation coefficient for the two main populations of fibrils formed at initial concentrations of 0.1, 0.3 and 0.5 mg/ml. The fitted values obtained for the concentration of the active conformer over the concentration range 0.1–0.5 mg/ml varied over a very narrow range from 3.05578 to 3.05690 pM. These values correspond to values of the product nKeq ranging from 0.9942 – 0.9978. For an isodesmic self-association, values of nKeq close to 1 lead to the formation of large fibrils (see equation 1).
Figure 7.
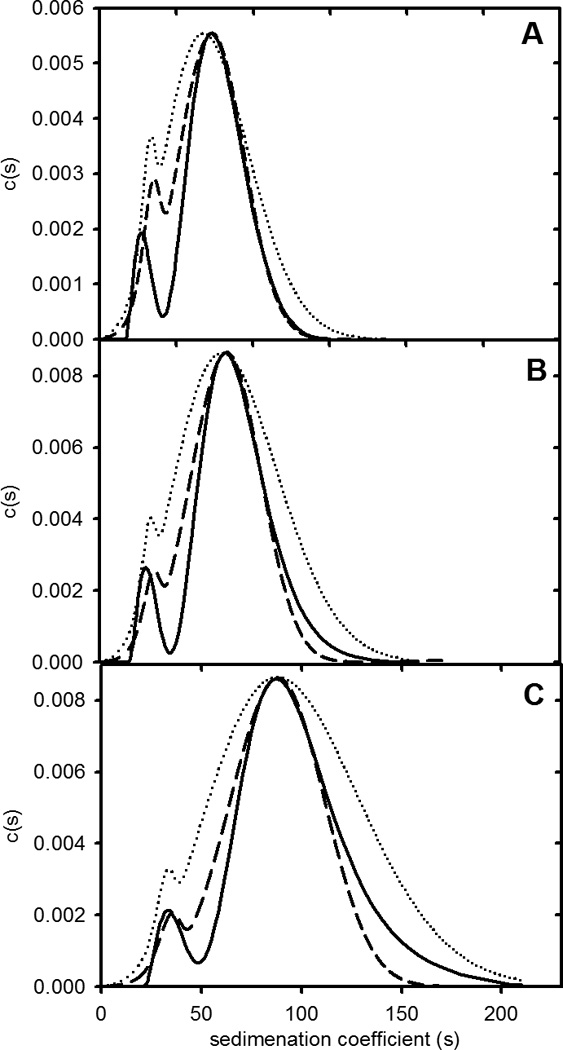
Fit of experimental fibril size distributions with theoretical model. Experiment data for fibrils formed at different apoC-II concentrations (Figure 1B) were fitted to the model presented in Figure 6. Parameters used to fit the data are summarised in Table 3. Panels A-C present experimental size distributions at 0.1 mg/mL, 0.3 mg/mL and 0.5 mg/mL, respectively (solid lines), and the corresponding theoretical fits assuming size independent (dotted lines) or size-dependent isodesmic self-association constants (Dashed lines).
Table 3.
Parameters used to fit apoC-II fibril size distributions and the kinetics of fibril formation to an isodesmic self-association model
| Isodesmic self- association modela |
Size-dependent isodesmic self- association modela |
Kinetic modelb |
|
|---|---|---|---|
| Keq (M−1) × 10−11 | 3.27059 | 37.2750c | 3.27 |
| Ki × 106 | 1.51 | 0.134 | 1.5 |
| KL | 1 | 10 | — |
| kon (h−1) × 10−3 | — | — | 3 |
| ke (M−1 h−1) × 10−12 | 1.8 | ||
| kj (M−1 h−1) × 10−8 | — | — | 3.2 |
Procedures used to fit the size distribution data (Figs. 7 and 8) and kinetic data (Fig. 9) are presented in Materials and Methods. The values of μ and σ (Eq. 1) used to fit the data in Fig. 7 and 8 were 210 and 100, respectively.
The kinetic data on the rate of fibril formation and change in weight-average sedimentation coefficient (Fig. 9) were fitted assuming fixed values for Keq, and Ki was obtained from the analysis of the size distribution data (Fig. 7). The kinetic data were fitted assuming the absence of closed loops.
In general, the shapes of the theoretical size distributions in Figure 7 are in reasonable agreement with the experimental results. The main divergence arises from the width of the theoretical fits compared to the experimental distribution. While there could be several explanations, one possibility considered was that the equilibrium constant for fibril self-association is size-dependent. The results in Figure 7 also show fits to the experimental size distributions assuming an empirical relationship between the self-association constant, Keq, and fibril length (see Theory section). The fitted value for exponent “a” of −.001 (equation 3) corresponds to a size-dependent fractional decrease of 0.8% in Keq for fibrils composed of 3000 subunits compared to 2 subunits. The results show that, while the theoretical size distributions are sensitive to the inclusion of a size dependent self-association constant, both models provide a satisfactory description of the average size of the fibrils observed at equilibrium and over the range of concentrations studied.
Application of the model to fit the weight-average sedimentation coefficient of fibrils
The fitted parameters in Table 3, assuming a constant value of Keq, were used to calculate equilibrium values for the weight-average sedimentation coefficients of fibrils formed at different apoC-II concentrations (Figure 1). The results in Figure 8 show good agreement between these calculated values and experimental values in the concentration range 0.1–0.5 mg/ml. In particular, the model accurately describes the concentration-dependent increase in the average sedimentation coefficient for the larger population of fibrils and the concentration independence of the average sedimentation coefficient of the “closed-loop” sub-population. At higher total apoC-II concentrations the weight-average sedimentation coefficients of the fibrils deviate from the theoretic curve. This divergence is even more evident in studies at higher concentrations where values in the range 100–1000 S have been observed30. These additional effects appear to be irreversible and are attributed to fibril tangling and interactions between fibrils30.
Figure 8.
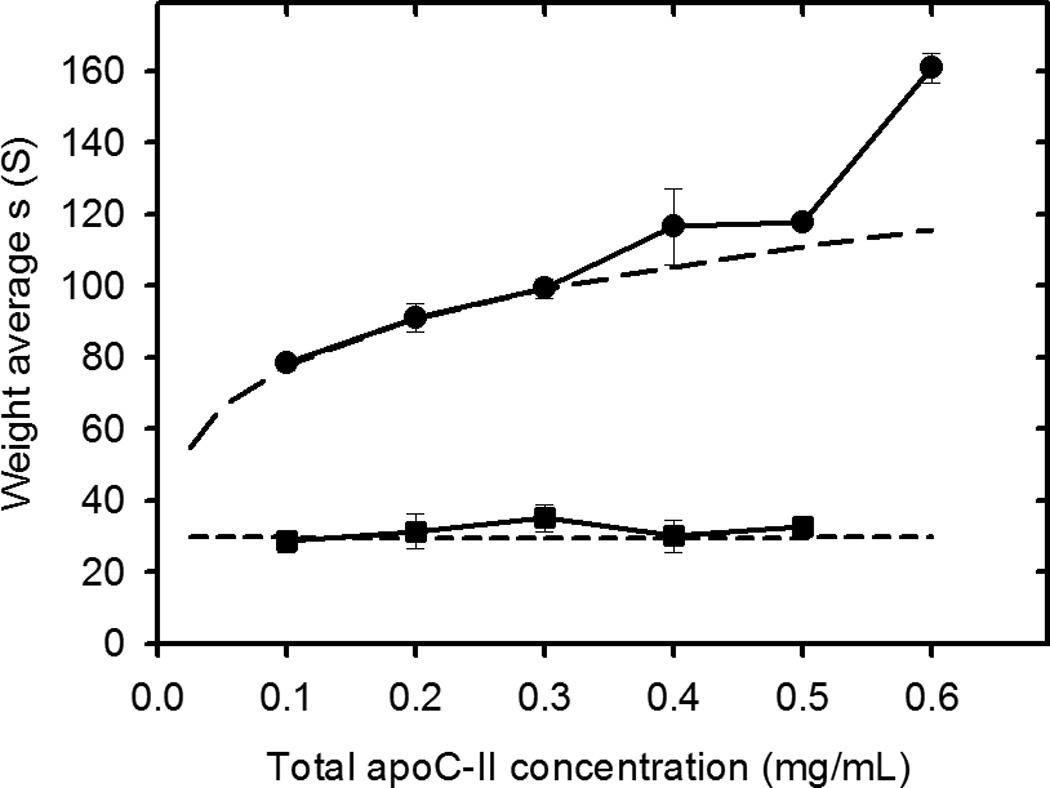
Fit of model shown in Figure 6 to the dependence of apoC-II fibril size on total apoC-II concentration. Weight-average sedimentation coefficient values for the faster moving and slower moving population of fibrils (Figure 1C) are shown together with theoretical data (long dashed and short dashed lines, respectively) calculated using the fitted parameters shown in Table 3, assuming a constant value for Keq.
Analysis of kinetics of fibril formation
The model in Figure 6 was extended to examine the kinetics of apoC-II fibrils formed at different starting concentrations17. The kinetic description was possible with the simplifying treatment of all fibrils as a fibril of average length, thereby excluding direct consideration of closed-loop formation (see Methods). Given this approximation which is justified on the basis of the small proportion of the closed-loop population, the results in Figure 9 show reasonable agreement between the lines of best-fit for the model and experimental data on the rate of fibril formation and changes in the weight-average sedimentation coefficient during fibril formation. The best-fit lines were constrained to the values of Ki and Keq obtained from an analysis of the data in Figure 7 assuming a size independent value of Keq, as summarised in Table 3. The fitting process involved fitting three additional parameters, namely values for kon, the rate constant for formation of the active folded conformer, ke the rate constant for fibril elongation by conformer addition and kj the rate for fibril joining (Table 3). While a more elaborate treatment, including closed-loop formation, may improve the fits shown in Figure 9, the present treatment indicates that the equilibrium model shown in Figure 6 satisfactorily accounts for the major features of the kinetics of apoC-II fibril formation.
Figure 9.
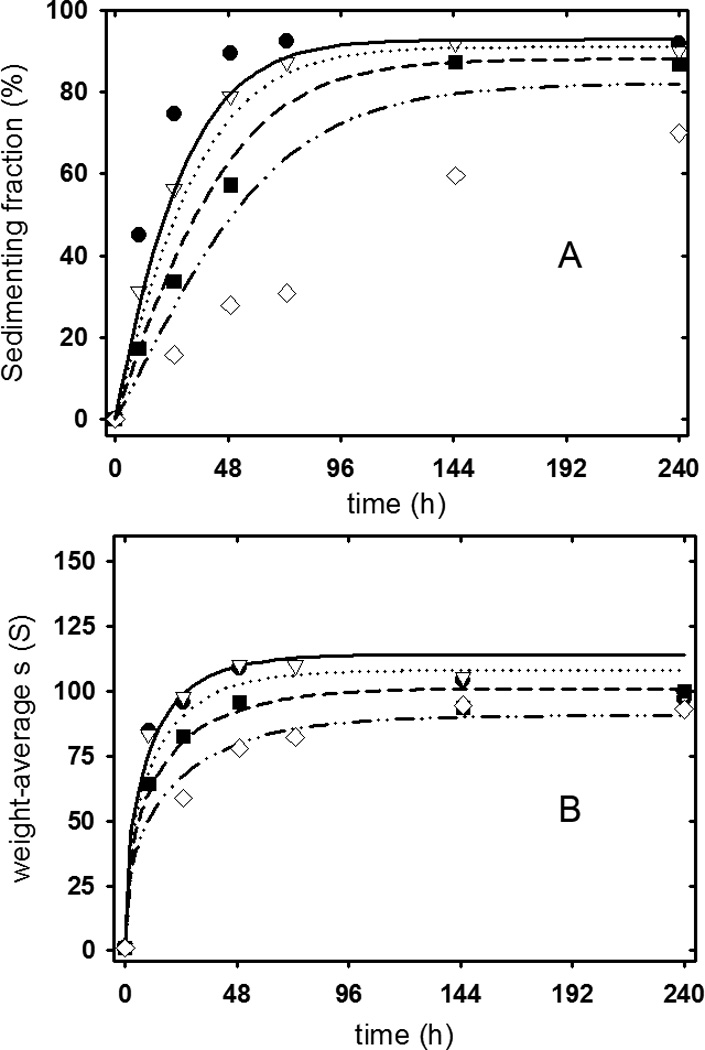
Application of the equilibrium model to fit the kinetics of apoC-II fibril formation. Data on the rate of fibril formation (Panel A) and on the change in weight-average sedimentation coefficient with time (Panel B) are from17. The experimental data was analysed according to the equilibrium model presented in Figure 6 and the parameters summarized in Table 3, extended to include rate constants for the various equilibria (see Theory section). Experimental data (symbols) and theoretical fits (lines) are shown for fibrils formed at 0.2 mg/mL (diamonds, dash-dot-dot line), 0.3 mg/mL (squares, dashed line), 0.4 mg/mL (triangles, dotted line) and 0.5 mg/mL (circles, solid line).
Discussion
It is pertinent to summarise the evidence supporting the isodesmic self-association model for amyloid fibril formation by apoC-II. The model is consistent with the stacking of identical subunits within apoC-II fibrils to form a twisted-ribbon architecture with each subunit interface stabilized by identical interactions19. The reversible isodesmic self-association model in Figure 6 is also consistent with the concentration dependence of the equilibrium size distributions, the rapid exchange of labelled subunits with mature fibrils and the recovery towards the equilibrium position following sonication or dilution of pre-formed fibrils (Figures 1–5). It should be noted, however, that while the model fits the experimental data in the 0.1–0.5 mg/ml concentration range, a limitation of the model applies at higher apoC-II concentrations (>0.6 mg/ml) where additional irreversible processes occur to generate large fibrillar aggregates attributed to fibril aggregation or tangling30. A further consideration is that while the model assumes the equilibrium constant for the formation of each subunit-subunit interface is identical the possibility exists that the initial dimerization constant differs from the equilibrium constant describing subsequent monomer addition steps. Such a possibility appears to be the case for apoC-II fibril formation in the presence of amphipathic activators or inhibitors where there is good evidence for the formation of discrete tetramers or dimers, respectively31. The slow formation of discrete oligomeric species coupled with an isodesmic self-association model may also account for the appearance of a distinct concentration-dependent lag phase for some amyloid fibril forming systems.
A useful property of an isodesmic self-association model is the ability to define the concentration of all fibrillar species based on the assignment of a single equilibrium constant. This simplifies the extension of the model to include fibril size-dependent processes such as closed-loop formation and lateral interactions allowing simulation and analysis of fibril-derived oligomeric intermediates. A further property of the model arises from a consideration of equation 1 which shows that the system converges to an equilibrium fibril distribution when the product Keq × n is less than 1. For apoC-II fibrils this condition occurs when the concentration of active monomer decreases to below 1/Keq corresponding to a concentration of approximately 3 × 10⁻¹² M or 3 pM. Fibril formation by apoC-II can be compared with other systems where it is difficult to define size distributions due to the very large fibrillar aggregates formed and in some cases stirring is required to obtain fibrils in a reasonable timescale8; 9; 32; 33. A distinction between the behaviour of different amyloid fibril forming systems can be made, based on the value of the isodesmic self-association constant, Keq. For apoC-II fibril formation the value of Keq is such that during fibril formation the concentration of the free active conformer, n, decreases to below 1/Keq and a discrete and well-defined fibril size distribution is formed. For systems characterized by very large values of Keq the product Keq × n remains greater than 1 and the system does not reach equilibrium. In these cases, the concentration of free active conformer reaches very low values and fibril formation comes to a kinetic rather than equilibrium end-point. According to this classification, distinguishing between equilibrium and non-equilibrium self-association schemes becomes an important consideration in the analysis of amyloid fibril forming pathways.
The best-fit values reported in Table 3 for Keq, ke and kj allow the relative rates of monomer dissociation from fibrils (keoff) and the rate of fibril breakage (kb) to be calculated, where Keq=ke/keoff = kj/kb. The calculated values for keoff and kb (5.4 h−1 and 9.7 × 10⁻⁴ h−1, respectively) indicate monomer dissociation from fibrils is a rapid process compared to fibril breakage, at least during the early stages when the size of the fibrils is small. It should be noted, however, that keoff describes the rate constant for breakage at each interface in the fibril, as opposed to the rate constant of fibril breakage anywhere. At later stages, the size of the fibrils increases such that for fibrils composed of 3000 subunits the rate of breakage per fibril is approximately 3 h−1.
The equilibrium model proposed in Figure 6 differs from the nucleation-elongation models commonly applied to the analysis of amyloid fibril formation. By considering the equilibrium condition the number of parameters required to describe the final size distribution is reduced considerably compared to a nucleation-elongation model based on the assignment of kinetic rate constants. An additional advantage of the isodesmic self-association model is the ability to distinguish the energy contributions associated with monomer folding from the energy of sub-unit interactions. For apoC-II, fitting the fibril size distribution data provided an estimate of Keq and the equilibrium concentration of free active conformer, n. Knowledge of n and the size of the total free monomer pool then allows the concentration of the unfolded monomer, m to be calculated and hence the isomerisation constant, Ki. The values obtained for the isomerisation constant, Ki (1.5 × 10⁻⁶) and the isodesmic self-association constant, Keq (3.3 × 10¹¹ M−1) for apoC-II fibril formation (Table 3) indicates an unfavourable positive free energy value of 32.7 kJ.mol−1 for active conformer formation that is coupled with a large negative free energy of −64.6 kJ.mol−1 for subunit-subunit interactions within fibrils. It should be noted that, although the free energy change for conformer formation is positive, the rate of isomerisation is fast with values for kon and koff (Table 3) ensuring rapid interconversion between an ensemble of unfolded monomers and the active monomeric conformer over the millisecond to second timescale. The kinetics of the isomerisation-isodesmic self-association model may be contrasted with calculations based on the nucleation-elongation model. A free pool of monomer, indicative of a reversible process, has been reported for fibril formation by Aβ7 and used as a measure of the equilibrium constant for fibril elongation to estimate the effects of mutations on fibril stability34. An uncertainty introduced with the nucleation-elongation model is that it is not possible to distinguish the effects of mutations on monomer folding or monomer addition to fibrils.
The equilibrium model proposed for apoC-II fibrils has implications for in vivo amyloid fibril formation where deposits accumulate over a long time scale such that a steady-state equilibrium condition is achieved, governed by the relative rates of protein synthesis and breakdown. Studies aimed at controlling amyloid fibril formation and depositions have mainly focussed on procedures to limit the formation of amyloid fibrils. The present study suggests procedures targeted at reversing fibril formation or modulating fibril breaking and joining may also be effective. Another aspect of the equilibrium model, relevant to intracellular amyloid fibril formation is the potential for spatial resolution of amyloid fibril forming conditions within the cell. A recent study of Huntington aggregation within cells identified three major populations corresponding to monomers, oligomers (modal sedimentation coefficient of 140S) and intracellular inclusion bodies35. The appearance of soluble oligomers is consistent with the formation of a discrete size distribution predicted for an isodesmic self-association. Variations in the total concentration of amyloid fibril forming proteins in different regions of the cell could determine whether equilibrium or non-equilibrium self-association mechanisms apply and the nature of the fibrils and oligomeric intermediates formed. For apoC-II fibril formation, a variety of physiological factors including macromolecular crowding36, mutations37, molecular chaperones38; 39, apolipoprotein E40, shear forces41, lipids42 and oxidation43 modulate fibril formation. The development of a simple isodesmic self-association model for apoC-II fibril formation will facilitate kinetic and thermodynamic studies of the mechanism these modulators exert on amyloid fibril formation.
Materials and Methods
ApoC-II was expressed, purified and stored as a stock solution in 5M guanidine hydrochloride, 10 mM Tris.HCl, pH 8.0 at a concentration of approximately 45 mg/ml29. A cysteine containing derivative, apoC-II S61C, provided by Dr. Chi Pham (University of Melbourne), was conjugated with Alexa 488 C5 maleimide (Invitrogen-Molecular Probes, Eugene, Oregon)29. ApoC-II fibril formation was initiated by dilution of the stock apoC-II solution into refolding buffer (100mM sodium phosphate, 0.05% sodium azide, pH 7.4) and incubation at 25° C. Preformed apoC-II fibrils were prepared by incubation of apoC-II at 0.3 mg/ml for 7 days at 25°C.
Sedimentation analysis
Sedimentation experiments were conducted using an XL-I analytical ultracentrifuge (Beckman Coulter Instruments, Inc., Fullarton, California), an An-60Ti rotor and double-sector 12 mm path length cells containing quartz windows and charcoal-filled epon centerpieces. Sedimentation velocity data was collected at 8,000 rpm, using optical density measurements at 280 nm and 8 min time intervals. A fluorescence detection system (FDS; Aviv Biomedical) was used to monitor the fluorescence of Alexa-labeled apoC-II44. Fluorescence data were collected at 1 minute intervals from 6.0 – 7.25 cm with the excitation laser focused to a spot 20 µm in diameter, 31 µm below the surface of the window. Sedimentation velocity data was analysed using the c(s) model in SEDFIT9.445. Second derivative Tikhonov-Phillips regularization was used to convert the experimental data into continuous size distributions46. The hydrodynamic scaling law derived on the basis of a worm-like chain model for non-interacting fibrils was used to relate the sedimentation coefficient to fibril molecular weight as described previously30.
Shear experiments
Preformed apoC-II fibrils were subjected to shear using rapid vortexing, bath sonication or freeze thaw treatment. Vortexing was carried out for 20 min using a benchtop vortex instrument at a speed setting of 600 rpm. Bath sonication was performed using a bath sonicator (Ultrasonic FXP 10) for 15 min. Freeze thaw treatment involved 4 cycles of freezing the sample (1 mL aliquots) in liquid nitrogen and thawing in warm water of 42 °C.
Fluorescence spectroscopy
All fluorescence measurements were recorded in a Cary Eclipse fluorescence spectrometer (Varian Inc.). The fluorescence emission of Alexa488 labeled apoC-II (0.00675 mg/mL) was determined using an excitation wavelength of 495 nm and collecting the emission over the range 495–700 nm using a 495-nm long-pass filter.
Purification of apoC-II closed-loop fibrils
ApoC-II fibrils were formed at 0.3 mg/ml by incubation in refolding buffer at 25°C for 7 days. Preformed fibrils (1 mL aliquots) were freeze-thawed 10 times by submerging in liquid nitrogen for 25 seconds followed by rapid thawing in water at 42°C. After annealing at 25° C for 24 h, the samples were centrifuged at 50,000 rpm for 8 min in an 50,000 rpm (47,500 × g) using an OptimaMax centrifuge and a TL-100.1 rotor (Beckman Coulter Instruments, Inc., Fullerton, CA) to separate fibrils into pellet and supernatant fractions for further analysis.
Transmission electron microscopy
Carbon-coated Formvar 300 mesh copper grids were rendered hydrophilic by glow discharge under reduced atmosphere for 10 seconds. ApoC-II closed-loop fibril samples were diluted to a concentration of 0.1 mg/mL with de-ionised water. The diluted samples were applied to the grids for 1 min within 15 min of glow discharging and stained twice with 2% potassium phosphotungstate at pH 6.8. The grids were air-dried and inspected using a Tecnai TF30 transmission electron microscope (FEI, The Netherlands) operating at 200 kV. Images were acquired digitally using a Gatan US1000 2kX2k CCD Camera (Pleasanton, CA).
Subunit exchange and fibril dilution experiments
A centrifugation assay was used to monitor apoC-II subunit exchange. Monomeric Alexa488-labelled apoC-II (6.75 µg/mL) was added to preformed apoC-II fibrils or purified closed-loop samples (0.14 mg/ml). Following incubation at 25°C, for specified times, the samples (100 µL) were centrifuged at 100,000 rpm for 30 min and Alexa488 fluorescence in the supernatant measured. Subunit exchange was also monitored by the quenching of Alexa488-labelled apoC-II fluorescence that occurs on fibril formation19. Monomeric Alexa488-labelled apoC-II (6.75 µg/mL) was added to preformed apoC-II fibrils or closed-loop samples (0.14 mg/ml) and Alexa488 fluorescence measured continuously during incubation at 25°C. Fluoresence emission was normalised to data collected for Alexa488-labelled apoC-II (6.75 µg/mL) alone which showed only minor variation over the same time course (< 5%). Fibril dilution experiments and size distribution analysis using fluorescence detection were performed using preformed apoC-II fibrils (0.3 mg/ml) incubated with Alexa488-labelled apoC-II (6.75 µg/mL) and DTT (1 mM) for 4 h.
Computer simulations
The equilibrium constants shown in Figure 6 were used to obtain expressions for the various species as a function of total apoC-II concentration. With the molar concentrations of unfolded monomer, active folded conformer, linear fibrils of length i and closed-loops of length i denoted as m, n, fi and Li respectively, the relevant expressions are:
| (1) |
P is the length-dependent probability of closed-loop formation, assuming a Gaussian distribution with μ and σ the mean length and standard deviation of closed loops, respectively. With this formulation the total apoC-II concentration, ct, is given by:
| (2) |
Combination of equations 1 and 2 and assigning values for n, the concentration of active folded conformer, allowed fibril size distributions to be calculated as a function of total concentration for specified values of Ki, Keq, KL, μ and σ. The summations in equation 2 were truncated for larger species (i > 35000) since the concentration of these species became vanishingly small. Fibril size distributions were converted to sedimentation coefficient distributions assumed a worm-like chain model30. Fitted values for Keq were obtained by fitting theoretical fibril size distributions to experimental data using a sequential process. Initially, the data obtained at a total apoC-II concentration of 0.3 mg/ml was analysed and the total concentration of fibrils calculated by subtracting the free pool of non-sedimenting monomer (m+n). Values were then assigned to n to fit the total fibril concentration for assigned values of Keq, neglecting closed loop formation (KL=0). This procedure was then repeated for different values of Keq to obtain fibril distributions that fitted the modal sedimentation coefficient of fibrils observed experimentally. The fitted value for Keq was then fixed and the process repeated iteratively with the inclusion of closed loop formation to obtain a fibril size distribution that adequately described the experimental profile for manually assigned values of KL, μ and σ. This procedure yielded fitted values for Keq, KL, μ and σ which were then fixed to obtain simulated size distributions to compare with experimental distributions obtained for apoC-II fibrils formed over the concentration range 0.1–0.6 mg/ml. This protocol also yielded fitted values for n which together with experimental values for the free pool of apoC-II monomer, (m+n), allowed calculation of the corresponding values for Ki. Simulated size distributions were also calculated for the case where Keq varied with fibril length, i. For these calculations the following expression was used for the length dependent equilibrium constant, K’eq(i):
| (3) |
where the exponent “a” was used as an additional fitting parameter.
The time-courses for fibril formation and the changes in weight-average sedimentation coefficient were computed for the model shown in Figure 6 using procedures similar to those used previously17. For practical reasons we used an approximate description based on the simplifying approximation of replacing all fibrils of different length with a single, average fibril species, f. This approach neglected the formation of closed-loop structures, with the approximation that the proportion of closed-loops relative to total fibrils is small. The relevant equations are:
| (4) |
where c0 is the total molar concentration of subunits in the experiment, kon and koff are rate constants for formation and dissociation of active folded conformer, ke and keoff the rate constants for fibril elongation and active conformer dissociation from each end, kb and kj the rate of fibril breaking or end-to-end joining per subunit-subunit interface. The average fibril length (in monomer units) can be calculated as (c0-m-n)/f, which, in turn, can be converted into a weight-average sedimentation coefficient expected to be observed in the sedimentation experiments30. Equation 1 was solved in MATLAB and implemented for non-linear regression of the experimental data.
Acknowledgements
This research was supported under the Australian Research Council's Discovery Projects funding scheme (project number DP0984565). M.D.W.G is the recipient of an Australian Research Council Post Doctoral Fellowship (project number DP110103528). This work was supported in part by the Intramural Research Program of the National Institute of Biomedical Imaging and Bioengineering, National Institutes of Health.
Abbreviations
- apo
apolipoprotein
- AUC
analytical ultracentrifuge
- FDS
fluorescence detection system
References
- 1.Dobson CM. Protein-misfolding diseases: Getting out of shape. Nature. 2002;418:729–730. doi: 10.1038/418729a. [DOI] [PubMed] [Google Scholar]
- 2.Masters CL, Simms G, Weinman NA, Multhaup G, McDonald BL, Beyreuther K. Amyloid plaque core protein in Alzheimer disease and Down syndrome. Proc Natl Acad Sci U S A. 1985;82:4245–4249. doi: 10.1073/pnas.82.12.4245. [DOI] [PMC free article] [PubMed] [Google Scholar]
- 3.Sipe JD, Cohen AS. Review: history of the amyloid fibril. J Struct Biol. 2000;130:88–98. doi: 10.1006/jsbi.2000.4221. [DOI] [PubMed] [Google Scholar]
- 4.Bucciantini M, Giannoni E, Chiti F, Baroni F, Formigli L, Zurdo J, Taddei N, Ramponi G, Dobson CM, Stefani M. Inherent toxicity of aggregates implies a common mechanism for protein misfolding diseases. Nature. 2002;416:507–511. doi: 10.1038/416507a. [DOI] [PubMed] [Google Scholar]
- 5.Kirkitadze MD, Bitan G, Teplow DB. Paradigm shifts in Alzheimer's disease and other neurodegenerative disorders: the emerging role of oligomeric assemblies. J Neurosci Res. 2002;69:567–577. doi: 10.1002/jnr.10328. [DOI] [PubMed] [Google Scholar]
- 6.Lomakin A, Chung DS, Benedek GB, Kirschner DA, Teplow DB. On the nucleation and growth of amyloid beta-protein fibrils: detection of nuclei and quantitation of rate constants. Proc Natl Acad Sci U S A. 1996;93:1125–1129. doi: 10.1073/pnas.93.3.1125. [DOI] [PMC free article] [PubMed] [Google Scholar]
- 7.Wetzel R. Kinetics and thermodynamics of amyloid fibril assembly. Acc Chem Res. 2006;39:671–679. doi: 10.1021/ar050069h. [DOI] [PubMed] [Google Scholar]
- 8.Baskakov IV, Bocharova OV. In vitro conversion of mammalian prion protein into amyloid fibrils displays unusual features. Biochemistry. 2005;44:2339–2348. doi: 10.1021/bi048322t. [DOI] [PubMed] [Google Scholar]
- 9.Collins SR, Douglass A, Vale RD, Weissman JS. Mechanism of prion propagation: amyloid growth occurs by monomer addition. PLoS Biol. 2004;2:e321. doi: 10.1371/journal.pbio.0020321. [DOI] [PMC free article] [PubMed] [Google Scholar]
- 10.Xue WF, Homans SW, Radford SE. Systematic analysis of nucleation-dependent polymerization reveals new insights into the mechanism of amyloid self-assembly. Proc Natl Acad Sci U S A. 2008;105:8926–8931. doi: 10.1073/pnas.0711664105. [DOI] [PMC free article] [PubMed] [Google Scholar]
- 11.Hall D, Edskes H. A model of amyloid's role in disease based on fibril fracture. Biophys Chem. 2009;145:17–28. doi: 10.1016/j.bpc.2009.08.004. [DOI] [PMC free article] [PubMed] [Google Scholar]
- 12.Knowles TP, Waudby CA, Devlin GL, Cohen SI, Aguzzi A, Vendruscolo M, Terentjev EM, Welland ME, Dobson CM. An analytical solution to the kinetics of breakable filament assembly. Science. 2009;326:1533–1537. doi: 10.1126/science.1178250. [DOI] [PubMed] [Google Scholar]
- 13.Kumar S, Mohanty SK, Udgaonkar JB. Mechanism of formation of amyloid protofibrils of barstar from soluble oligomers: evidence for multiple steps and lateral association coupled to conformational conversion. J Mol Biol. 2007;367:1186–1204. doi: 10.1016/j.jmb.2007.01.039. [DOI] [PubMed] [Google Scholar]
- 14.Xue WF, Hellewell AL, Gosal WS, Homans SW, Hewitt EW, Radford SE. Fibril fragmentation enhances amyloid cytotoxicity. J Biol Chem. 2009;284:34272–34282. doi: 10.1074/jbc.M109.049809. [DOI] [PMC free article] [PubMed] [Google Scholar]
- 15.Hatters DM, MacPhee CE, Lawrence LJ, Sawyer WH, Howlett GJ. Human apolipoprotein C-II forms twisted amyloid ribbons and closed loops. Biochemistry. 2000;39:8276–8283. doi: 10.1021/bi000002w. [DOI] [PubMed] [Google Scholar]
- 16.Medeiros LA, Khan T, El Khoury JB, Pham CL, Hatters DM, Howlett GJ, Lopez R, O'Brien KD, Moore KJ. Fibrillar amyloid protein present in atheroma activates CD36 signal transduction. J Biol Chem. 2004;279:10643–10648. doi: 10.1074/jbc.M311735200. [DOI] [PubMed] [Google Scholar]
- 17.Binger KJ, Pham CL, Wilson LM, Bailey MF, Lawrence LJ, Schuck P, Howlett GJ. Apolipoprotein C-II amyloid fibrils assemble via a reversible pathway that includes fibril breaking and rejoining. J Mol Biol. 2008;376:1116–1129. doi: 10.1016/j.jmb.2007.12.055. [DOI] [PubMed] [Google Scholar]
- 18.Hatters DM, MacRaild CA, Daniels R, Gosal WS, Thomson NH, Jones JA, Davis JJ, MacPhee CE, Dobson CM, Howlett GJ. The circularization of amyloid fibrils formed by apolipoprotein C-II. Biophys J. 2003;85:3979–3990. doi: 10.1016/S0006-3495(03)74812-7. [DOI] [PMC free article] [PubMed] [Google Scholar]
- 19.Teoh CL, Pham CL, Todorova N, Hung A, Lincoln CN, Lees E, Lam YH, Binger KJ, Thomson NH, Radford SE, Smith TA, Muller SA, Engel A, Griffin MD, Yarovsky I, Gooley PR, Howlett GJ. A structural model for apolipoprotein C-II amyloid fibrils: experimental characterization and molecular dynamics simulations. J Mol Biol. 2011;405:1246–1266. doi: 10.1016/j.jmb.2010.12.006. [DOI] [PubMed] [Google Scholar]
- 20.Gonzalez JM, Velez M, Jimenez M, Alfonso C, Schuck P, Mingorance J, Vicente M, Minton AP, Rivas G. Cooperative behavior of Escherichia coli cell-division protein FtsZ assembly involves the preferential cyclization of long single-stranded fibrils. Proc Natl Acad Sci U S A. 2005;102:1895–1900. doi: 10.1073/pnas.0409517102. [DOI] [PMC free article] [PubMed] [Google Scholar]
- 21.Attri AK, Fernandez C, Minton AP. pH-dependent self-association of zinc-free insulin characterized by concentration-gradient static light scattering. Biophys Chem. 148:28–33. doi: 10.1016/j.bpc.2010.02.002. [DOI] [PMC free article] [PubMed] [Google Scholar]
- 22.Correia JJ. Analysis of tubulin oligomers by analytical ultracentrifugation. Methods Cell Biol. 95:275–288. doi: 10.1016/S0091-679X(10)95015-2. [DOI] [PubMed] [Google Scholar]
- 23.Rana MS, Riggs AF. Indefinite noncooperative self-association of chicken deoxy hemoglobin D. Proteins. 79:1499–1512. doi: 10.1002/prot.22978. [DOI] [PubMed] [Google Scholar]
- 24.Thorn DC, Ecroyd H, Sunde M, Poon S, Carver JA. Amyloid Fibril Formation by Bovine Milk κ(s2)-Casein Occurs under Physiological Conditions Yet Is Prevented by Its Natural Counterpart, α(s1)-Casein. Biochemistry. 2008;47:3926–3936. doi: 10.1021/bi701278c. [DOI] [PubMed] [Google Scholar]
- 25.Bernstein SL, Dupuis NF, Lazo ND, Wyttenbach T, Condron MM, Bitan G, Teplow DB, Shea JE, Ruotolo BT, Robinson CV, Bowers MT. Amyloid-beta protein oligomerization and the importance of tetramers and dodecamers in the aetiology of Alzheimer's disease. Nat Chem. 2009;1:326–331. doi: 10.1038/nchem.247. [DOI] [PMC free article] [PubMed] [Google Scholar]
- 26.Kayed R, Pensalfini A, Margol L, Sokolov Y, Sarsoza F, Head E, Hall J, Glabe C. Annular protofibrils are a structurally and functionally distinct type of amyloid oligomer. J Biol Chem. 2009;284:4230–5237. doi: 10.1074/jbc.M808591200. [DOI] [PMC free article] [PubMed] [Google Scholar]
- 27.Sanchez L, Madurga S, Pukala T, Vilaseca M, Lopez-Iglesias C, Robinson CV, Giralt E, Carulla N. Abeta40 and Abeta42 amyloid fibrils exhibit distinct molecular recycling properties. J Am Chem Soc. 133:6505–6508. doi: 10.1021/ja1117123. [DOI] [PubMed] [Google Scholar]
- 28.Carulla N, Caddy GL, Hall DR, Zurdo J, Gairi M, Feliz M, Giralt E, Robinson CV, Dobson CM. Molecular recycling within amyloid fibrils. Nature. 2005;436:554–558. doi: 10.1038/nature03986. [DOI] [PubMed] [Google Scholar]
- 29.Ryan TM, Howlett GJ, Bailey MF. Fluorescence detection of a lipid-induced tetrameric intermediate in amyloid fibril formation by apolipoprotein C-II. J Biol Chem. 2008;283:35118–35128. doi: 10.1074/jbc.M804004200. [DOI] [PMC free article] [PubMed] [Google Scholar]
- 30.MacRaild CA, Hatters DM, Lawrence LJ, Howlett GJ. Sedimentation velocity analysis of flexible macromolecules: self-association and tangling of amyloid fibrils. Biophys J. 2003;84:2562–2569. doi: 10.1016/S0006-3495(03)75061-9. [DOI] [PMC free article] [PubMed] [Google Scholar]
- 31.Ryan TM, Griffin MD, Teoh CL, Ooi J, Howlett GJ. High-affinity amphipathic modulators of amyloid fibril nucleation and elongation. Journal of Molecular Biology. 2011;406:416–429. doi: 10.1016/j.jmb.2010.12.023. [DOI] [PubMed] [Google Scholar]
- 32.Platt GW, Routledge KE, Homans SW, Radford SE. Fibril growth kinetics reveal a region of beta2-microglobulin important for nucleation and elongation of aggregation. J Mol Biol. 2008;378:251–263. doi: 10.1016/j.jmb.2008.01.092. [DOI] [PMC free article] [PubMed] [Google Scholar]
- 33.Munishkina LA, Henriques J, Uversky VN, Fink AL. Role of protein-water interactions and electrostatics in alpha-synuclein fibril formation. Biochemistry. 2004;43:3289–3300. doi: 10.1021/bi034938r. [DOI] [PubMed] [Google Scholar]
- 34.Williams AD, Shivaprasad S, Wetzel R. Alanine scanning mutagenesis of Abeta(1–40) amyloid fibril stability. J Mol Biol. 2006;357:1283–1294. doi: 10.1016/j.jmb.2006.01.041. [DOI] [PubMed] [Google Scholar]
- 35.Olshina MA, Angley LM, Ramdzan YM, Tang J, Bailey MF, Hill AF, Hatters DM. Tracking mutant huntingtin aggregation kinetics in cells reveals three major populations that include an invariant oligomer pool. J Biol Chem. 2010;285:21807–21816. doi: 10.1074/jbc.M109.084434. [DOI] [PMC free article] [PubMed] [Google Scholar]
- 36.Hatters DM, Minton AP, Howlett GJ. Macromolecular crowding accelerates amyloid formation by human apolipoprotein C-II. J Biol Chem. 2002;277:7824–7830. doi: 10.1074/jbc.M110429200. [DOI] [PubMed] [Google Scholar]
- 37.Pham CL, Hatters DM, Lawrence LJ, Howlett GJ. Cross-linking and amyloid formation by N- and C-terminal cysteine derivatives of human apolipoprotein C-II. Biochemistry. 2002;41:14313–14322. doi: 10.1021/bi026070v. [DOI] [PubMed] [Google Scholar]
- 38.Hatters DM, Wilson MR, Easterbrook-Smith SB, Howlett GJ. Suppression of apolipoprotein C-II amyloid formation by the extracellular chaperone, clusterin. Eur J Biochem. 2002;269:2789–2794. doi: 10.1046/j.1432-1033.2002.02957.x. [DOI] [PubMed] [Google Scholar]
- 39.Hatters DM, Lindner RA, Carver JA, Howlett GJ. The molecular chaperone, alpha-crystallin, inhibits amyloid formation by apolipoprotein C-II. J Biol Chem. 2001;276:33755–33761. doi: 10.1074/jbc.M105285200. [DOI] [PubMed] [Google Scholar]
- 40.Gunzburg MJ, Perugini MA, Howlett GJ. Structural basis for the recognition and cross-linking of amyloid fibrils by human apolipoprotein E. J Biol Chem. 2007;282:35831–35841. doi: 10.1074/jbc.M706425200. [DOI] [PubMed] [Google Scholar]
- 41.Teoh CL, Bekard IB, Asimakis P, Griffin MD, Ryan TM, Dunstan DE, Howlett GJ. Shear flow induced changes in apolipoprotein C-II conformation and amyloid fibril formation. Biochemistry. 2011;50:4046–4057. doi: 10.1021/bi2002482. [DOI] [PubMed] [Google Scholar]
- 42.Griffin MD, Mok ML, Wilson LM, Pham CL, Waddington LJ, Perugini MA, Howlett GJ. Phospholipid interaction induces molecular-level polymorphism in apolipoprotein C-II amyloid fibrils via alternative assembly pathways. J Mol Biol. 2008;375:240–256. doi: 10.1016/j.jmb.2007.10.038. [DOI] [PubMed] [Google Scholar]
- 43.Binger KJ, Griffin MD, Howlett GJ. Methionine oxidation inhibits assembly and promotes disassembly of apolipoprotein C-II amyloid fibrils. Biochemistry. 2008;47:10208–10217. doi: 10.1021/bi8009339. [DOI] [PubMed] [Google Scholar]
- 44.MacGregor IK, Anderson AL, Laue TM. Fluorescence detection for the XLI analytical ultracentrifuge. Biophys Chem. 2004;108:165–185. doi: 10.1016/j.bpc.2003.10.018. [DOI] [PubMed] [Google Scholar]
- 45.Schuck P. Size-distribution analysis of macromolecules by sedimentation velocity ultracentrifugation and lamm equation modeling. Biophys J. 2000;78:1606–1619. doi: 10.1016/S0006-3495(00)76713-0. [DOI] [PMC free article] [PubMed] [Google Scholar]
- 46.Schuck P, Rossmanith P. Determination of the sedimentation coefficient distribution by least-squares boundary modeling. Biopolymers. 2000;54:328–341. doi: 10.1002/1097-0282(20001015)54:5<328::AID-BIP40>3.0.CO;2-P. [DOI] [PubMed] [Google Scholar]


