

Abstract
Natural killer cells form tightly regulated, finely tuned immunological synapses (IS) in order to lyse virally infected or tumorigenic cells. Dynamic actin reorganization is critical to the function of NK cells and the formation of the IS. Imaging of F-actin at the synapse has traditionally utilized confocal microscopy, however the diffraction limit of light restricts resolution of fluorescence microscopy, including confocal, to approximately 200 nm. Recent advances in imaging technology have enabled the development of subdiffraction limited super-resolution imaging. In order to visualize F-actin architecture at the IS we recapitulate the NK cell cytotoxic synapse by adhering NK cells to activating receptor on glass. We then image proteins of interest using two-color stimulated emission depletion microscopy (STED). This results in <80 nm resolution at the synapse. Herein we describe the steps of sample preparation and the acquisition of images using dual color STED nanoscopy to visualize F-actin at the NK IS. We also illustrate optimization of sample acquisition using Leica SP8 software and time-gated STED. Finally, we utilize Huygens software for post-processing deconvolution of images.
Keywords: Immunology, Issue 85, natural killer cells, F-actin, immune synapse, super-resolution microscopy, two-color stimulated emission depletion (STED) microscopy
Introduction
The immunological synapse is a complex milieu of signaling proteins and cytoskeletal elements. The cytolytic synapse was originally described as having a "bulls-eye" like structure with a ring of actin and adhesion molecules surrounding a central secretory domain1-4. However, we now know that it consists of microscopic domains of active signaling that require continuous dynamic cytoskeletal reorganization for function5-11. Much of the information that we now have about the synapse has been derived from microscopy, and immunologists have been early adopters of cutting-edge imaging technology.
One such novel technology is super-resolution microscopy. Conventional light microscopy is spatially limited by the diffraction barrier of light, which sets the lower limit of resolution for all fluorescence microscopy, including confocal, at approximately 200 nm. In recent years, several techniques have been developed that allow resolution below the diffraction barrier. These include stimulation emission depletion microscopy (STED), structured illumination microscopy (SIM), stochastically resolved microscopy (STORM), and photoactivatable light microscopy (PALM). These techniques have been reviewed in detail elsewhere12-15, but are outlined below. Subdiffraction limited resolution is generated in unique ways in each system. The selection of a super-resolution technique, therefore, should be dictated by the experiment and experimental system of interest.
STED super resolution is achieved using a high-intensity torroidal depletion beam that selectively "silences" fluorescence around each fluorophore of interest following excitation, resulting in subdiffraction limited fluorescence microscopy16-18. One advantage of STED is that image acquisition is rapid and requires relatively little post-processing. While dye selection is dictated by the spectral position of the depletion beam, which in the commercially available system is situated at 592 nm, several commercially available dyes are available that make combinations of two fluorophores possible. In addition, commonly used fluorescent reporters such as GFP can be imaged, making live cell experiments possible19,20.
We have previously used STED to identify and quantify regions of F-actin hypodensity that are utilized by NK cells for degranulation21,22. We propose that STED is a good choice for imaging the immune synapse due to its relatively flexible availability of fluorophores and superior improvement in resolution in the x-y axis. In addition, on the commercially available STED system utilized for these experiments, the use of a high-speed (12,000 Hz) resonance scanner allows for rapid acquisition of images with minimal damage to samples. Limited flexibility in dye selection is considered a disadvantage of STED12, however dual color STED is relatively straightforward with several commercially available fluorophores. The integration of STED with a laser scanning confocal microscope also allows for additional confocal imaging in combination with STED, so while STED is limited to two channels, additional structures can be imaged in confocal with resolution of approximately 200 nm (E. Mace, unpublished observations). While we describe the use of STED for imaging immune cells, this technology is applied to a variety of cell types, including neural cells, and for visualizing a variety of cell structures23-26.
SIM uses a different approach to generate subdiffraction-limited images. By visualizing known periodic excitation patterns, information can then be obtained about the unknown structure being studied following mathematical transformation27. This yields an increase in resolution to ~100 nm laterally28,29. The advantage of SIM is that it is compatible with all standard confocal dyes and probes, however the disadvantage is that it is much slower to acquire images and these require lengthy post-processing12. This also limits its use for live cell imaging.
Finally, super-resolution images can be generated by stochastic photo-switching of fluorophores. This approach is exploited in photo-activated localization microscopy (PALM) and stochastic optical reconstruction microscopy (STORM). By scanning multiple camera frames and localizing randomly activated molecules that are turned "on" and "off" over time, images with 20-30 nm resolution are generated from accumulated frames30-32 . The trade-off for this resolution is the time required to acquire images.
Here we show, in detail, the protocol for preparing and imaging dual color samples in STED. In this system, excitation is with a pulsed, tunable, white light laser. Due to the nature of the pulsed excitation beam, time gating of detection is made possible and further increases resolution. In addition, the system is equipped with gadolinium hybrid (HyD) detectors, which are more sensitive than conventional photomultiplier tubes, thus allowing for lower laser power requirements. The depletion beam for STED is applied continuously and is tuned to 592 nm, which will dictate the choice of dyes available for two color STED. Commonly used dye combinations generally include one excitable by 488 nm (such as Alexa Fluor 488, Oregon Green, DyLights green, or Chromeo 488) and one excitable by 458 nm (such as Pacific Orange or Horizon V500). Thus, while detection of the two dyes will be in a similar range (and both are accessible by the depletion laser), excitation will occur with different wavelengths. With a tunable white light laser and tunable detectors, maximizing signal while eliminating spectral overlap is made fairly easy. As such, we have had good success with combinations of commercially available dyes, such as Pacific Orange and Alexa Fluor 488 (used here). Our protocol is tailored towards and describes the evaluation of human NK cells as that represents the historical focus of our laboratory. We are specifically utilizing the NK92 cell line in this example as that is one we have regularly applied in our experimental work21,33.
Protocol
1. Coat Coverslips with Antibody
Prewarm (at 37 °C) 30 ml of RPMI 10% FCS media and 1 ml of BD Cytofix/Cytoperm.
- Prepare a solution of 5 μg/ml of purified antibody in phosphate buffered saline (PBS). For activation of the NK92 cell line, use of anti-CD18 and anti-NKp30 is recommended.
- Mark one approximately dime sized circle for each condition on a #1.5 coverslip using a PAP pen. For a dual color experiment, there should be four conditions: unstained, dual stained, and two single stained conditions. Dispense 200 µl of antibody solution in each region and incubate at 37 °C for 30 min.
- Wash coverslips by gently immersing each one in 50 ml of PBS in a 50 ml conical tube at room temperature. Washing should occur immediately prior to the addition of cells and care should be taken to avoid antibody drying on the coverslip.
2. Activate NK Cells on Coverslips; Fix and Permeabilize
- Isolate 5 x 10⁵ NK92 cells per condition. Centrifuge and decant supernatant. Wash once with 10 ml prewarmed media from step 1.1. Centrifuge and decant supernatant.
- Resuspend cells in prewarmed media from step 1.1 at a concentration of 2.5 x 10⁶/ml.
- Gently decant 200 µl to the center of the region created in section 1.2.1. Incubate at 37 °C for 20 min at 5% CO2. (Note: this time can be extended or decreased depending on the biological function of interest. For NK cell granule polarization, 20 min is sufficient).
Following incubation of cells, gently wash coverslips by immersing each in 50 ml of room temperature PBS in a 50 ml conical tube.
Add 1 µl of Triton X-100 to 1 ml of prewarmed Fix/Perm solution from step 1.1 and vortex thoroughly. Fix and permeabilize by adding 200 µl of Fix/Perm buffer (step 2.3) to cells. Incubate for 10 min in the dark at room temperature.
3. Stain Cells
- Prepare staining buffer: Phosphate buffered saline (PBS), 1% BSA, 0.1% Saponin.
- Prepare solution of primary antibody in200 µlstaining buffer (see step 3.1). (Note: antibody should be titrated prior to use). Avoid the use of primary antibody that is raised in the same species used to coat the coverslip (step 1.2). Also avoid Strepatividin-biotin linkages for STED imaging.
- Following section 2.3.1, gently wash coverslips in 50 ml staining buffer. Dab edges of PAP-pen region with cotton swab to remove excess buffer. Apply antibody solution created in section 3.1.1. Incubate 30 min in the dark at room temperature. (Recommended: incubate coverslips in slide box with a moist paper towel to maintain humidity).
- Prepare solution of secondary antibody in200 µlstaining buffer. Recommended fluorophores are Alexa Fluor 488, Pacific Orange, and V500. Generally, a 1:200 dilution is suitable for STED imaging.
- Gently wash coverslips in 50 ml staining buffer. Dab edges of PAP-pen region with cotton swab to remove excess buffer. Apply secondary antibody solution. Incubate 30 min in the dark at room temperature.
Repeat washing and staining for additional proteins of interest. If detecting F-actin with Phalloidin, this can be included with secondary antibody, generally at a 1:200 dilution.
4. Mount Coverslips on Slides
Prepare mounting medium. Note: Prolong or Prolong Gold are preferable. VECTASHIELD must be avoided, as it is not compatible with STED. 2,2-thiodioethanol must be avoided if Phalloidin is used. Mowiol is acceptable.
Place approximately 10-20 µl of mounting medium on a slide. Invert coverslip (cell-side down) and mount coverslip gently, taking care to avoid introduction of air bubbles. Incubate slides for 24 hr (coverslip up) prior to imaging.
Seal edges of coverslip with nail polish.
5. Experimental Setup
Initiate required lasers and software. Initiate STED depletion laser at 100% power. Align STED laser, which in the case of commercial systems is often an automated procedure.
Focus the sample, beginning with single stained control, on the microscope using eyepieces.
6. Optimization of Settings
- Scan the first channel and optimize laser power, excitation beam position and detector range. If possible, avoid a gain of >100. Capture the image in confocal to optimize settings. Line and/or frame averaging will increase resolution. Check for pixel saturation. Note: Some saturation is acceptable in confocal as application of STED will reduce the intensity of emission. For STED, an optimal pixel size will be below 30 nm however better resolution will be obtained with smaller pixel sizes. The size of the region of interest being imaged will dictate the lower limit of pixel size. Smaller pixel sizes may increase photobleaching.
- Apply STED depletion beam and capture image, starting with 50% depletion laser power. If an improvement in resolution is seen, more depletion laser power can be applied. At this stage, it may be necessary to adjust excitation laser power, line average, and/or gain.
- Apply time gating to reduce background (minimum 0.3 nsec). Adjust settings until an improvement in resolution over confocal can be seen. Resolution can be approximated by estimating full width half maximum (FWHM). This represents the distance at the half maximal intensity of a Gaussian peak created by drawing a line profile across the structure of interest, and is a widely used method of estimating resolution.
- Once the first channel is satisfactory, initiate a second sequence for sequential scanning. In general, it is best to scan the longer wavelength fluorophore first. Repeat step 6.1 on second channel.
Confirm lack of spectral overlap by imaging single stained controls with both scan sequences. Mild spectral overlap can be corrected using spectral un-mixing features in the software, however should be avoided wherever possible.
7. Image Acquisition
Acquire images. For quantitative imaging, it is recommended to obtain at least 20 images/condition. The exact number, however, should be defined according to the experimental question in concert with a statistical approach such as sample size calculation. Save experiment.
8. Deconvolution
Open file with deconvolution software or batch processor. Check parameters for each channel using software. Confirm each channel's excitation and emission spectra, STED depletion emission, and imaging direction (up or down, if the image is 3-dimensional) in particular.
Deconvolve using the deconvolution wizard. Default settings are generally adequate, however signal to noise ratio (SNTR) will vary from fluorophore to fluorophore and will need to be determined for each channel and each experiment individually.
Representative Results
Clearly, a primary goal of super-resolution imaging will be an improvement over conventional confocal microscopy. However, there are some common pitfalls that may lead to suboptimal resolution. These require that each experiment be optimized individually. In our representative experiment, we are imaging the F-actin network in an NK cell activated by antibody bound to glass. Common causes of (and corrections for) a lack of improved resolution of STED over confocal are as follows:
Under-sampling (Figure 1a). This may lead to graininess and loss of pixel information, as shown by poor resolution of F-actin filaments. Increased line or frame averaging can often correct this.
Bleaching and/or over-sampling (Figure 1b). This may be caused by lengthy pixel dwell time as a result of excessive line averaging. Alternatively, it may be a result of over-scanning of the image prior to acquisition, including over-use of the depletion laser. This commonly results in hazy or fuzzy images. This can be corrected by scanning the field of interest only minimally before acquiring or, if possible, increasing laser scan speed. If the problem persists, the depletion laser power can be reduced.
By achieving the correct balance of pixel dwell time, excitation laser power, and depletion laser power, an image with improved resolution and sufficient information can be generated (Figure 1c). Resolution can be further improved by the use of deconvolution (Figure 1d). When acquisition is optimized, deconvolution will improve resolution both qualitatively and quantitatively and sub-100 nm resolution should be routinely attainable.
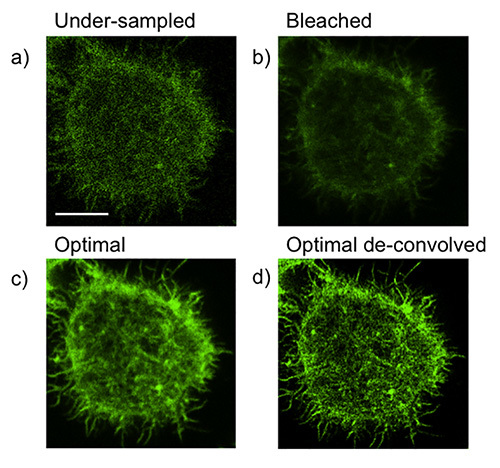 Figure 1.Optimization of acquisition and common pitfalls of STED imaging. NK92 cells were activated on anti-CD18 and -NKp30 coated glass for 20 min then fixed, permeabilized and stained for F-actin with Phalloidin Alexa Fluor 488. a) An example of loss of image information due to under-sampling. b) An example of loss of resolution due to bleaching/over-sampling c) conditions optimized d) optimized conditions lead to greater improvement in resolution with deconvolution. Scale bar = 5 μm.
Discussion
The improvement in resolution over confocal will be somewhat dependent upon factors which cannot be controlled. These factors include minor aberrations in cover slip thickness and inconsistencies in mounting media. It is important to keep the temperature and humidity in the imaging room as consistent as possible, and the STED beam should be realigned approximately every 60 min. As mentioned in Procedures, use of VECTASHIELD mounting medium must be avoided, as this is not compatible with STED. In addition to which, one should always use #1.5 cover slips, and if available, use those which have been verified to a specific thickness.
One modification of the approach described here is to image additional channels in confocal, using fluorophores that emit at a longer wavelength than the STED beam. In this way, one can image up to four channels (two in confocal, two in STED). If taking this approach, however, the channels with fluorophores emitting above the STED depletion laser will need to be imaged first, as application of the STED beam will deplete photons in these channels. One advantage to this technique is the application of time gating, which will also improve resolution in confocal by eliminating emission from photons with short lifetimes34. In particular, the use of time gating, the timing of emission detectors to correspond with pulsed excitation STED, will decrease background fluorescence from reflection off coverslip glass when imaging close to it. Even in an experiment not suitable for STED, if using a pulsed excitation source, time gating can be a useful tool for improving resolution in confocal.
There are various modifications that can be utilized to improve resolution in STED. One is to decrease the size of the pinhole from the standard 1 Airy unit, although this will also decrease the amount of light reaching the sample. This can be compensated for by increasing laser power or gain. Another is to increase line average, which will increase the amount of information gathered for each photon, improving resolution. Again, however, this may be at the cost of photobleaching of the sample, so a balance will need to be struck between resolution and bleaching. Similarly, use of fluorescent proteins such as GFP will require careful optimization to avoid bleaching. This may be accomplished by decreasing STED laser power if necessary. Longer time points will also allow for greater photon recovery and reduce bleaching. Correction for photobleaching should be accounted for when analyzing live STED.
Of course, imaging in 3 dimensions in STED is also possible, and will also give an improvement over conventional confocal imaging. This is particularly true if it is done in combination with deconvolution, although care should be taken to correct for drift that occurs during imaging multiple planes in the z-axis. If using Huygens software to deconvolve, this correction is obtained using the "stabilize image" feature. Using this approach, resolution in the z-axis will be improved. This is a great improvement over conventional confocal imaging, which has poor axial resolution, and even over just STED itself, which also has relatively poor z-axis resolution. While acquiring multiple stacks in STED, care must be taken to avoid bleaching of the sample, and if necessary one can reduce line averaging or laser power intensity in order to do so. Again, it should be noted that if imaging other fluorophores that are not suitable for STED, application of the depletion beam in the first sequential scan would prevent emission from these channels. Therefore, a mixed STED/confocal approach (when using confocal scanning in channels that emit at a wavelength greater than 592 nm) will unfortunately not be suitable for 3D.
To summarize, we have chosen STED as an approach due to its relative ease of application and improvement in resolution over standard confocal imaging. For imaging the immune synapse, it has proven an effective and valuable technique that allows us to see details in F-actin architecture not possible at resolution over 200 nm. While many of these details seem subtle, they can have a profound effect on NK cell function. Thus, we are applying the latest nanoscopic imaging technology to deriving information that is critical for maintaining human health.
Disclosures
The authors declare that they have no competing financial interests. Partial publication cost of this article was defrayed by Leica Microsystems, Inc.
Acknowledgments
We thank Geoff Daniels for technical assistance. This work was funded by R01 AI067946 to J.S.O.
References
- Stinchcombe JC, Bossi G, Booth S, Griffiths GM. The immunological synapse of CTL contains a secretory domain and membrane bridges. Immunity. 2001;15(5):751–761. doi: 10.1016/s1074-7613(01)00234-5. [DOI] [PubMed] [Google Scholar]
- Grakoui A, Bromley SK, Sumen C, et al. The immunological synapse: a molecular machine controlling T cell activation. Science. 1999;285(5425):221–227. doi: 10.1126/science.285.5425.221. [DOI] [PubMed] [Google Scholar]
- Monks CR, Freiberg BA, Kupfer H, Sciaky N, Kupfer A. Three-dimensional segregation of supramolecular activation clusters in T cells. Nature. 1998;395(6697):82–86. doi: 10.1038/25764. [DOI] [PubMed] [Google Scholar]
- Orange JS, Harris KE, Andzelm MM, Valter MM, Geha RS, Strominger JL. The mature activating natural killer cell immunologic synapse is formed in distinct stages. Proc. Natl. Acad. Sci. U.S.A. 2003;100(24):14151–14156. doi: 10.1073/pnas.1835830100. [DOI] [PMC free article] [PubMed] [Google Scholar]
- Treanor B, Lanigan PM, Kumar S, et al. Microclusters of inhibitory killer immunoglobulin-like receptor signaling at natural killer cell immunological synapses. J. Cell Biol. 2006;174(1):153–161. doi: 10.1083/jcb.200601108. [DOI] [PMC free article] [PubMed] [Google Scholar]
- Abeyweera TP, Merino E, Huse M. Inhibitory signaling blocks activating receptor clustering and induces cytoskeletal retraction in natural killer cells. J. Cell Biol. 2011;192(4):675–690. doi: 10.1083/jcb.201009135. [DOI] [PMC free article] [PubMed] [Google Scholar]
- Beemiller P, Jacobelli J, Krummel MF. Integration of the movement of signaling microclusters with cellular motility in immunological synapses. Nat. Immunol. 2012;13(8):787–795. doi: 10.1038/ni.2364. [DOI] [PMC free article] [PubMed] [Google Scholar]
- Campi G, Varma R, Dustin ML. Actin and agonist MHC-peptide complex-dependent T cell receptor microclusters as scaffolds for signaling. J. Exp. Med. 2005;202(8):1031–1036. doi: 10.1084/jem.20051182. [DOI] [PMC free article] [PubMed] [Google Scholar]
- Mossman KD, Campi G, Groves JT, Dustin ML. Altered TCR signaling from geometrically repatterned immunological synapses. Science. 2005;310(5751):1191–1193. doi: 10.1126/science.1119238. [DOI] [PubMed] [Google Scholar]
- Varma R, Campi G, Yokosuka T, Saito T, Dustin ML. T cell receptor-proximal signals are sustained in peripheral microclusters and terminated in the central supramolecular activation cluster. Immunity. 2006;25(1):117–127. doi: 10.1016/j.immuni.2006.04.010. [DOI] [PMC free article] [PubMed] [Google Scholar]
- Yokosuka T, Sakata-Sogawa K, Kobayashi W, et al. Newly generated T cell receptor microclusters initiate and sustain T cell activation by recruitment of Zap70 and SLP-76. Nat. Immunol. 2005;6(12):1253–1262. doi: 10.1038/ni1272. [DOI] [PubMed] [Google Scholar]
- Toomre D, Bewersdorf J. A new wave of cellular imaging. Annu. Rev. Cell. Dev. Biol. 2010;26:285–314. doi: 10.1146/annurev-cellbio-100109-104048. [DOI] [PubMed] [Google Scholar]
- Schermelleh L, Heintzmann R, Leonhardt H. A guide to super-resolution fluorescence microscopy. J. Cell Biol. 2010;190(2):165–175. doi: 10.1083/jcb.201002018. [DOI] [PMC free article] [PubMed] [Google Scholar]
- Huang B, Bates M, Zhuang X. Super-resolution fluorescence microscopy. Annu. Rev. Biochem. 2009;78:993–1016. doi: 10.1146/annurev.biochem.77.061906.092014. [DOI] [PMC free article] [PubMed] [Google Scholar]
- Mace EM, Orange JS. New views of the human NK cell immunological synapse: recent advances enabled by super- and high-resolution imaging techniques. Front. Immunol. 2012;3 doi: 10.3389/fimmu.2012.00421. [DOI] [PMC free article] [PubMed] [Google Scholar]
- Hell SW, Wichmann J. Breaking the diffraction resolution limit by stimulated emission: stimulated-emission-depletion fluorescence microscopy. Opt. Lett. 1994;19(11):780–782. doi: 10.1364/ol.19.000780. [DOI] [PubMed] [Google Scholar]
- Klar TA, Hell SW. Subdiffraction resolution in far-field fluorescence microscopy. Opt. Lett. 1999;24(14):954–956. doi: 10.1364/ol.24.000954. [DOI] [PubMed] [Google Scholar]
- Klar TA, Jakobs S, Dyba M, Egner A, Hell SW. Fluorescence microscopy with diffraction resolution barrier broken by stimulated emission. Proc. Natl. Acad. Sci. U.S.A. 2000;97(15):8206–8210. doi: 10.1073/pnas.97.15.8206. [DOI] [PMC free article] [PubMed] [Google Scholar]
- Rankin BR, Moneron G, Wurm CA, et al. Nanoscopy in a living multicellular organism expressing GFP. Biophys. J. 2011;100(12):63–65. doi: 10.1016/j.bpj.2011.05.020. [DOI] [PMC free article] [PubMed] [Google Scholar]
- Willig KI, Kellner RR, Medda R, Hein B, Jakobs S, Hell SW. Nanoscale resolution in GFP-based microscopy. Nat. Methods. 2006;3(9):721–723. doi: 10.1038/nmeth922. [DOI] [PubMed] [Google Scholar]
- Rak GD, Mace EM, Banerjee PP, Svitkina T, Orange JS. Natural killer cell lytic granule secretion occurs through a pervasive actin network at the immune synapse. PLoS Biol. 2011;9(9) doi: 10.1371/journal.pbio.1001151. [DOI] [PMC free article] [PubMed] [Google Scholar]
- Mace EM, Orange JS. Dual channel STED nanoscopy of lytic granules on actin filaments in natural killer cells. Commun. Integr. Biol. 2012;5(2):184–186. doi: 10.4161/cib.18818. [DOI] [PMC free article] [PubMed] [Google Scholar]
- Singh H, Lu R, Rodriguez PF, et al. Visualization and quantification of cardiac mitochondrial protein clusters with STED microscopy. Mitochondrion. 2012;12(2):230–236. doi: 10.1016/j.mito.2011.09.004. [DOI] [PMC free article] [PubMed] [Google Scholar]
- Tonnesen J, Nagerl UV Superresolution imaging for neuroscience. Exp. Neurol. 2013;242:33–40. doi: 10.1016/j.expneurol.2012.10.004. [DOI] [PubMed] [Google Scholar]
- Kempf C, Staudt T, Bingen P, et al. Tissue multicolor STED nanoscopy of presynaptic proteins in the calyx of held. PLoS One. 2013;8(4) doi: 10.1371/journal.pone.0062893. [DOI] [PMC free article] [PubMed] [Google Scholar]
- Jans DC, Wurm CA, Riedel D, et al. STED super-resolution microscopy reveals an array of MINOS clusters along human mitochondria. Proc. Natl. Acad. Sci. U.S.A. 2013;110(22):8936–8941. doi: 10.1073/pnas.1301820110. [DOI] [PMC free article] [PubMed] [Google Scholar]
- Gustafsson MG. Surpassing the lateral resolution limit by a factor of two using structured illumination microscopy. J. Microsc. 2000;198(2):82–87. doi: 10.1046/j.1365-2818.2000.00710.x. [DOI] [PubMed] [Google Scholar]
- Gustafsson MG, Shao L, Carlton PM, et al. Three-dimensional resolution doubling in wide-field fluorescence microscopy by structured illumination) Biophys. J. 2008;94(12):4957–4970. doi: 10.1529/biophysj.107.120345. [DOI] [PMC free article] [PubMed] [Google Scholar]
- Schermelleh L, Carlton PM, Haase S, et al. Subdiffraction multicolor imaging of the nuclear periphery with 3D structured illumination microscopy. Science. 2008;320(5881):1332–1336. doi: 10.1126/science.1156947. [DOI] [PMC free article] [PubMed] [Google Scholar]
- Betzig E, Patterson GH, Sougrat R, et al. Imaging intracellular fluorescent proteins at nanometer resolution. Science. 2006;13(5793):1642–1645. doi: 10.1126/science.1127344. [DOI] [PubMed] [Google Scholar]
- Hess ST, Girirajan TP, Mason MD. Ultra-high resolution imaging by fluorescence photoactivation localization microscopy. Biophys. J. 2006;91(11):4258–4272. doi: 10.1529/biophysj.106.091116. [DOI] [PMC free article] [PubMed] [Google Scholar]
- Rust MJ, Bates M, Zhuang X. Sub-diffraction-limit imaging by stochastic optical reconstruction microscopy. Nat. Methods. 2006;3(10):793–795. doi: 10.1038/nmeth929. [DOI] [PMC free article] [PubMed] [Google Scholar]
- Banerjee PP, Pandey R, Zheng R, Suhoski , Monaco-Shawver L, Orange JS, editors. Cdc42-interacting protein-4 functionally links actin and microtubule networks at the cytolytic NK cell immunological. J. Exp. Med. 2007;204(10):2305–2320. doi: 10.1084/jem.20061893. [DOI] [PMC free article] [PubMed] [Google Scholar]
- Vicidomini G, Moneron G, Han KY, et al. Sharper low-power STED nanoscopy by time gating. Nat. Methods. 2011;8(7):571–573. doi: 10.1038/nmeth.1624. [DOI] [PubMed] [Google Scholar]