Abstract
There is growing interest among smartphone users in the ability to determine their precise location in their environment for a variety of applications related to wayfinding, travel and shopping. While GPS provides valuable self-localization estimates, its accuracy is limited to approximately 10 meters in most urban locations. This paper focuses on the self-localization needs of blind or visually impaired travelers, who are faced with the challenge of negotiating street intersections. These travelers need more precise self-localization to help them align themselves properly to crosswalks, signal lights and other features such as walk light pushbuttons.
We demonstrate a novel computer vision-based localization approach that is tailored to the street intersection domain. Unlike most work on computer vision-based localization techniques, which typically assume the presence of detailed, high-quality 3D models of urban environments, our technique harnesses the availability of simple, ubiquitous satellite imagery (e.g., Google Maps) to create simple maps of each intersection. Not only does this technique scale naturally to the great majority of street intersections in urban areas, but it has the added advantage of incorporating the specific metric information that blind or visually impaired travelers need, namely, the locations of intersection features such as crosswalks. Key to our approach is the integration of IMU (inertial measurement unit) information with geometric information obtained from image panorama stitchings. Finally, we evaluate the localization performance of our algorithm on a dataset of intersection panoramas, demonstrating the feasibility of our approach.
Keywords: self-localization, image stitching, IMU (inertial measurement unit), assistive technology, blindness and low vision, mobile vision
I. Introduction
There is growing interest among smartphone users in the ability to determine their precise location in their environment, for a variety of applications related to wayfinding, travel and shopping. While GPS (often integrated with other sensor-based localization information such as Wi-Fi and cell tower triangulation) provides valuable self-localization estimates, its accuracy is limited to approximately 10 meters in most urban locations [1].
Some tasks require better localization accuracy than what GPS-based methods can provide, including a variety of tasks performed by blind and visually impaired persons. One such task, which we focus on in this paper, is the task of negotiating street intersections. Specifically, this task requires the traveler to align him/herself properly to the crosswalk and other intersection features, which demands localization accuracy that is at least an order of magnitude more precise than what GPS provides. (In some cases GPS may not even be able to ascertain which corner of an intersection a traveler is standing at, let alone whether he/she is properly aligned to the crosswalk corridor [1].) Accurate localization is useful not only for finding, and approaching, important features such as pedestrian crossing buttons, but can also enable the detection and recognition of traffic signals such as walk lights.
To achieve superior localization accuracy, we have devised a novel computer vision-based localization approach that is tailored to the street intersection domain, building on our past work on the “Crosswatch” system to provide guidance to blind and visually impaired pedestrians at street intersections [2]. Unlike most work on computer vision-based localization techniques, which typically assume the presence of detailed, high-quality 3D models of urban environments [3], [4], our technique harnesses the availability of simple, ubiquitous satellite imagery (e.g., Google Maps) to create simple maps of each intersection. Not only does this technique scale naturally to the great majority of street intersections in urban areas, but it has the added advantage of incorporating the specific metric information that blind or visually impaired travelers need, namely, the locations of intersection features such as crosswalks.
A key contribution of our approach is the integration of IMU (inertial measurement unit) information with geometric information obtained from image panorama stitchings. Such integration is necessary to combine the information that the IMU contains about the absolute directions in the world (up, north and east) with the precise relative geometric information provided by the image panorama (i.e., rotations between different camera views of the scene, which are necessary for seamless integration of imagery). Finally, we evaluate the localization performance of our algorithm on a dataset of intersection panoramas, demonstrating the feasibility of our approach, and its superiority over GPS-based localization.
II. Related Work
There is a large amount of work on image-based self-localization, but here we mention only a few key examples of this work that have also been implemented on smartphones. Like our approach, [3] combines GPS with localization evidence based on panoramic images, demonstrating impressive localization results in large-scale environments; [5] builds on this work, incorporating IMU (inertial measurement unit) sensor data to improve localization results. Work on a related approach [4] focuses on the development of a publicly available test dataset. These works rely on the use of very accurate and detailed 3D models of the urban environment, in some cases requiring the use of expensive 3D scanners.
In a different vein, there have been several papers focusing on the detection of important street intersection features for blind and visually impaired travelers, such as work on detecting traffic lights [6] and the Zebralocalize project [7] for locating zebra crosswalks. Differently from most past work, we view the problem of determining one’s position and orientation and alignment relative to crosswalks as a 2D localization problem.
One of the challenges posed by computer vision applications intended for blind and visually impaired persons is the difficulty of taking usable pictures without the ability to examine the camera viewfinder. To facilitate these kinds of applications, camera-based feedback is essential; for example, a saliency-based measure is used in [8] to help blind users know where to aim the camera. Work on the “Crosswatch” project for orienting blind and visually impaired pedestrians to traffic intersections [2] shows that an appropriate user interface enables a blind person to take a usable panorama image of an intersection scene (see Sec. III-B).
Our approach builds on [9]. Relative to that work, we have devised a simple and novel scheme to integrate IMU readings over multiple images, using detailed information from stitching. While there is a large body of work in robotics on fusing image and IMU data (for one example, see [10]), we are unaware of other work that specifically exploits the geometric relationships among multiple images output by an image stitching algorithm to reconcile orientation estimates from the IMU and from the images. Finally, we have evaluated our algorithm quantitatively on an image dataset, and have shown that our algorithm performs better than GPS.
III. Approach
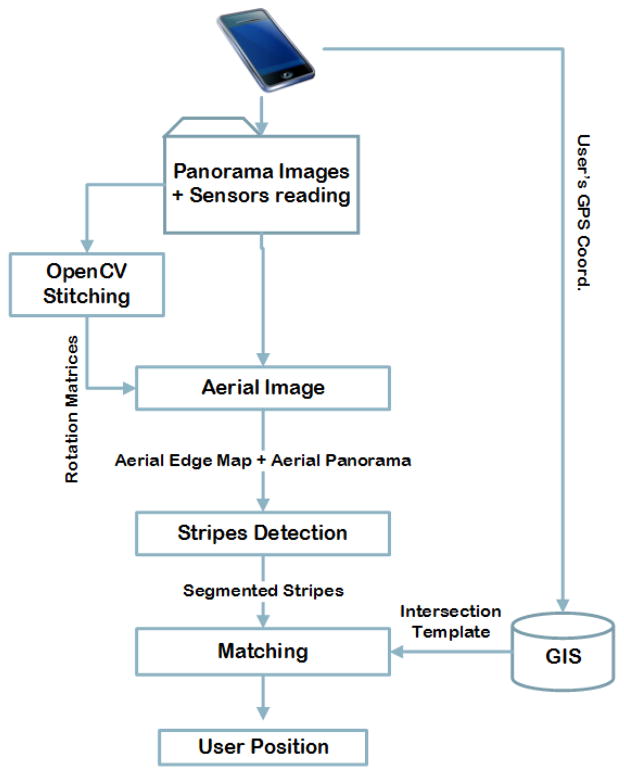
This section describes our approach to self-localization, beginning with an overview and continuing with details in subsequent subsections. Fig. 1 depicts a high-level pipeline of the proposed system.
Figure 1.
Pipeline of the proposed system. Note that GPS is only used by the system to determine which intersection the user is standing at; it is not used for any other aspect of the localization process. Details can be found in Section III.
A. Overview
Our approach to self-localization is based on a simple geometric model of each street intersection of interest, called an intersection template, which contains crosswalk stripe segmentations. There is a separate template (see Fig. 5(d)) for each intersection, derived from satellite imagery and having known orientation (i.e., the bearing of each stripe relative to north) and known scale (i.e., pixels per meter). This model assumes that the intersection is flat (which is approximately true, even if the streets adjoining it are sloped). We assume that the camera is held at a known height from the ground (which is measured for each user and is fairly uniform over time), and that the camera focal length is known. We also assume that the user is standing near an intersection and that GPS accuracy is sufficient to identify the correct intersection. (In our experiments, see Sec. IV, GPS accuracy was always sufficient to identify the correct intersection that the user was standing at, but not necessarily the specific corner of the intersection.) Note that GPS is only used by the system to determine which intersection the user is standing at; it is not used for any other aspect of the localization process.
Figure 5.
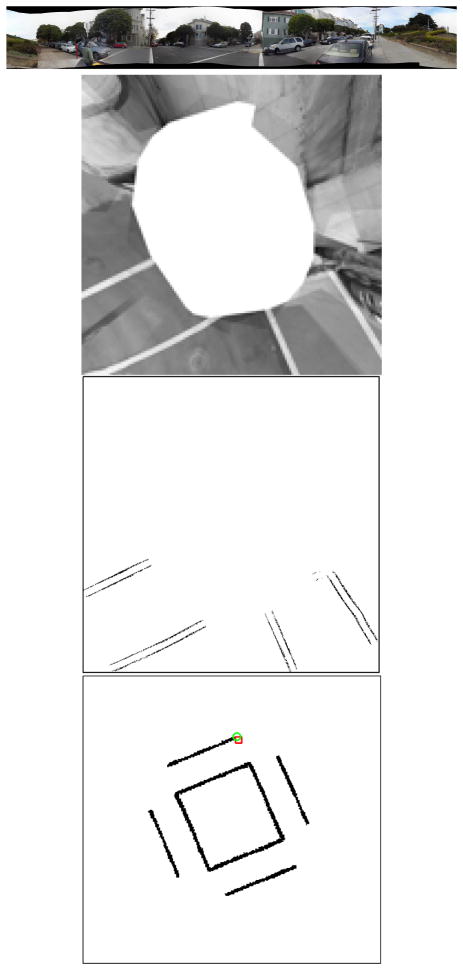
From top to bottom: (a) Sample panorama. (b) Corresponding aerial view (white space in center corresponds to points below the camera’s field of view); (c) Binary stripe edge map showing estimated locations of stripe edge pixels. (d) Final result superimposed on template of intersection: green circle shows ground truth location, and red square shows location estimated by our algorithm.
Using a simple smartphone app that we programmed, the user stands in one place and acquires multiple images while turning from left to right and holding the camera roughly horizontal. The IMU rotation matrix and GPS readings are recorded for each image.
These images are stitched into a rotational panorama, and an aerial image of the intersection is computed. The aerial image is computed such that the scale (pixels per meter) matches that of the template, and the IMU data is used to normalize the bearing of the aerial image (so that the image columns are roughly aligned to north).
Stripes in the aerial image are then detected by combining two procedures. First, a Haar-type filter is used to enhance stripe-like features. Second, a modified Hough transform, which is tailored to the known width of the stripes, is used in conjunction with the Haar-based map to find the likely stripe locations, encoded as a binary map. Next, the segmented image is cross-correlated with the template, with the peak correlation indicating the optimal translation between template and aerial image and thereby determining the user’s location.
The following subsections cover the algorithm in detail and are prefaced by a subsection describing how blind persons can use the system.
B. Use of system by blind persons
The Crosswatch system was specifically developed for use by blind and visually impaired persons. Many persons with visual impairments find it challenging to take pictures with a camera because it is difficult to aim properly without a clear view of the viewfinder, which most sighted persons use to help compose pictures. However, user interfaces can be devised to provide real-time guidance to help blind and visually impaired persons take usable pictures, as in [8], which uses a saliency-based measure to suggest locations of likely interest in the scene to photograph.
For Crosswatch, we developed a simple user interface [2], [9] to aid blind users in holding the camera properly, using the smartphone accelerometer to issue a vibration warning whenever the camera is pitched too far from the horizon or rolled too far from horizontal. We note that this interface does not require any analysis of the scene, since a usable 360° panorama requires only that the camera is oriented properly as it is moved from left to right. Experiments show [2] that blind users are able to use this interface to acquire usable panoramas, after a brief training session.
While the panoramas in the experiments reported in this paper were acquired by a sighted user, ongoing work (to be reported in later publications) on Crosswatch is based on panoramas successfully acquired by blind users. We are currently investigating the feasibility of narrower (e.g., 180°) panoramas, which require the user to aim the camera in the general direction of the intersection.
C. Template
We constructed a template of each intersection by downloading satellite images from Google Maps, cropping the intersection region and manually segmenting the crosswalk stripes (see Fig. 5(d) for an example). Note that the scale (pixels per meter) is known and that the image is normalized so that the up direction in the image points to geographic north. While the process of constructing a template takes approximately 5–10 minutes per intersection, in the future it will be possible to create templates for a very large number of intersections using crowdsourcing techniques such as those available through CrowdFlower (http://crowdflower.com/), a service that is well suited to complicated labeling tasks. We hope to make templates freely available online in the future, perhaps in conjunction with the OpenStreetMap (http://www.openstreetmap.org/) database.
D. Panorama
The smartphone app that we programmed automatically acquired images for a panorama as the user turned from left to right. The IMU was used to estimate the user’s bearing relative to magnetic north, and a new image was acquired roughly every 20° of bearing. Each image was saved to flash memory, along with all current IMU and GPS information for that image.
We used OpenCV to stitch together the images offline into a rotational panorama [11], see Fig. 5(a) for an example. The primary purpose of assembling a panorama is to facilitate the construction of an aerial image. However, the panorama also has two important benefits. First, it removes some moving objects (e.g., pedestrians and vehicles) from the scene, which would otherwise occlude some of the intersection features. Second, the relative pose geometry estimated in the creation of the panorama (i.e., how the camera is rotated between views) is useful for the estimation of the bearing of the aerial image.
E. Aerial image
The aerial image is a reconstruction of an aerial view of the intersection, viewed from a camera pointed straight down (perpendicular to the ground plane), in which the scale (pixels per meter) is known. (See Fig. 5(b) for an example.) The aerial view is created, and its bearing is normalized (so that the up direction in the aerial image points to magnetic north), to permit matching with a template of the intersection to estimate the (x, y) location of the camera. Note that the aerial image calculations assume that all points in the scene lie on the ground plane, which means that objects not lying on the ground plane appear distorted; however, enough of the scene points of interest lie on the ground plane to make the aerial image usable. Also note that an aerial view is based on scene points lying within a limited distance from the camera, and thus typically emcompasses only a small portion of the entire intersection (e.g., two crosswalks meeting at one corner of the intersection).
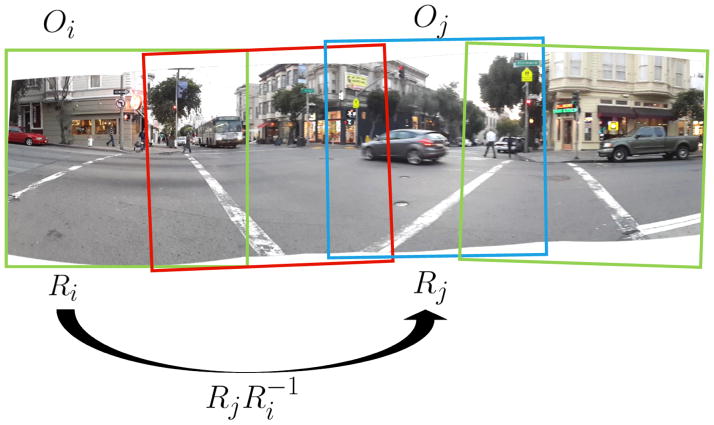
Since the panorama stitching algorithm has no access to inertial information such as the direction of up (defined by gravity), which is required for the creation of the aerial image, we had to combine inertial information with stitching information to create the aerial image. We developed three variants of the same approach to creating the aerial image, which we call Scheme 0, 1 and 2, described as follows. See Fig. 2 for an overview of this approach for creating reconciled orientation estimates for each image, used to create the aerial image.
Figure 2.
Schematic illustrating our novel algorithm for correcting IMU orientation estimates with rotational information from image stitching (Scheme 2). The IMU estimates an orientation matrix Oi for each image i that goes into the panorama, and each Oi provides an orientation estimate relative to absolute world coordinates (defined by magnetic north and gravity), but with too much noise to be solely relied upon to create an aerial view. The image panorama algorithm independently furnishes rotation estimates Ri for each image, but these are not calibrated with respect to absolute world coordinates. However, the rotation estimates can be combined to create highly accurate rotations between image pairs, so that transforms quantities from image i to image j. These inter-image rotations are combined with the IMU data to produce reconciled orientation estimates (see text).
Scheme 0 is too simple to be of practical use but helps motivate the descriptions of the Schemes 1 and 2, which are of practical use. To create the aerial image using Scheme 0, we simply use the orientation matrix Oi, estimated by the IMU for each image i (ranging from 1 through N, where N is the total number of images in the panorama) to unwarp image i into the aerial image. Note that the orientation matrix defines how the camera is rotated relative to a world coordinate system that is defined by three orthogonal axes: up (in terms of gravity), magnetic north (specifically, the direction of the earth’s magnetic field projected onto the horizontal plane), and magnetic east (defined to be perpendicular to the other two axes). Specifically, the orientation matrix Oi can be interpreted as follows: the third row equals û, which is the up direction (in camera-centered coordinates); the second row equals n̂, which is the magnetic north direction; and the first row equals ê, which is the magnetic east direction.
The unwarping from image i to the aerial image uses Oi, the height of the camera above the ground, and the camera focal length, resulting in an image that is normalized so that the up direction in the image points to magnetic north and the scale is known (pixels per meter). If more than one image contributes to a given pixel in the aerial view, the median of all contributing intensities is taken as the final pixel value. Finally, the resulting image is rotated by the magnetic declination so that the final aerial image is aligned to geographic (rather than magnetic) north, to achieve consistency with the intersection template. The problem with Scheme 0 is that the orientation matrices Oi are not estimated exactly, and inconsistencies between them result in a very muddled aerial image, with multiple copies of single edges, etc. To solve this problem, we devised Scheme 1, which uses rotation matrices Ri estimated in the OpenCV stitching algorithm to achieve consistency among different images. In Scheme 1, IMU information is used from just one image, say O1, and the rotation matrices Ri are used to transform O1 into predicted orientations Ôi for i > 1. (Note that the matrix transforms quantities from image i to image j, as described in [12].) The resulting aerial image (based on O1, Ô2, Ô3, …, ÔN) is far superior to that obtained using Scheme 0 in that there are almost no inconsistencies among different images.
However, the main flaw of Scheme 1 is that it draws on IMU information only from the first image, which is clearly sub-optimal. Scheme 2 was devised to incorporate IMU information from all images, without sacrificing inter-image consistency. It achieves this goal by normalizing the IMU measurements Oi, for all i > 1, to the first image, resulting in predicted orientations , which are the value of O1 that would be predicted based on measured value Oi and the transformation . Then we can average together the matrices over all i to produce a more robust estimate of O1 based on all available IMU data. Since the average of two or more rotation matrices is not guaranteed to be a rotation matrix itself, we then perform a procedure to determine the closest valid rotation matrix, which we then transform (as in Scheme 1) into improved orientation estimates for all i, which we refer to as “reconciled” orientation estimates. These reconciled orientation estimates are consistent across images and integrate IMU data from all images, resulting in a more seamless aerial image (see Fig. 3).
Figure 3.
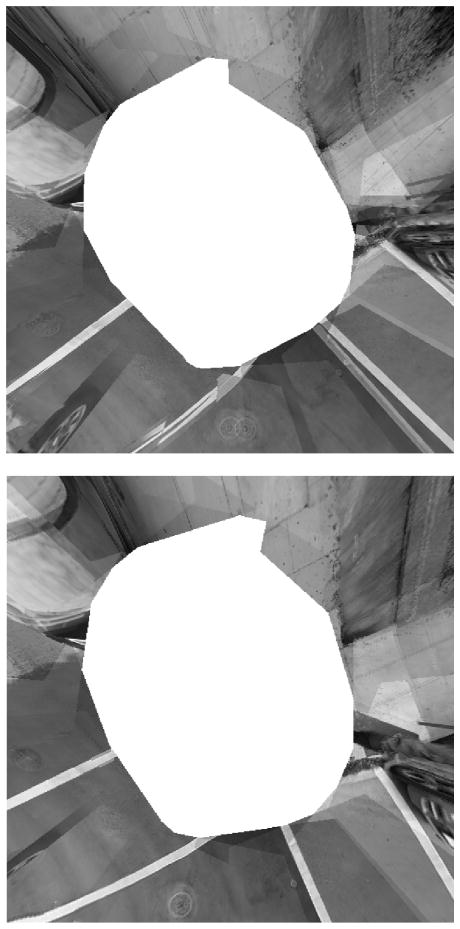
Example of composite aerial view using Scheme 0 (top) and Scheme 2 (bottom). Notice how multiple versions of the same stripe features appear using Scheme 0, which makes the image difficult to intrepret. Scheme 2 results in an aerial view that is much better stitched.
We present quantitative data comparing the performance of Schemes 1 and 2 in Sec. IV. Qualitatively, it is worth noting that distortion in the aerial view (which is due to several factors, including IMU noise and curvature of the ground surface) is less of a problem with Scheme 2, whereas in Scheme 1 parallel stripes often appear non-parallel in the aerial view.
Finally, we point out that the bearing normalization (to make the up direction in the aerial image point north) is only approximate, because of IMU noise (mostly due to the magnetometer, which can be distorted by extraneous metal objects such as cars and poles near the camera). (See Sec. V for discussion.)
F. Stripe detection
For the current version of our algorithm we are specializing to crosswalks with narrow stripes, as illustrated in Fig. 5(a). These stripes appear in the majority of crosswalks, and it will be straightforward to apply our approach to other crosswalk patterns such as zebra stripes. To detect crosswalk stripes, we combine a modified Hough transform with a Haar filtering method. The main idea of the modified Hough transform is as follows: instead of using the standard two-dimensional Hough space, (d, θ), which represents all possible lines, we use a three-dimensional space, (d, θ, w), where w is the width (in pixels) of the stripe we are looking for. The triple (d, θ, w) specifies two parallel lines, with edges of opposite polarity, spaced a distance w apart. (Note that w is given by the template, but in practice we search over a small range of possible w values.)
Voting in the modified Hough space is done using edge pixels determined by a Canny edge map. Given a candidate pixel a, a search for a “mate” pixel b is conducted by following the image gradient direction at a (this direction is appropriate for a bright stripe against a dark background) along a distance w. If a suitable mate pixel is found that lies on an edge and has an appropriate image gradient direction, then a candidate pair of mates is declared.
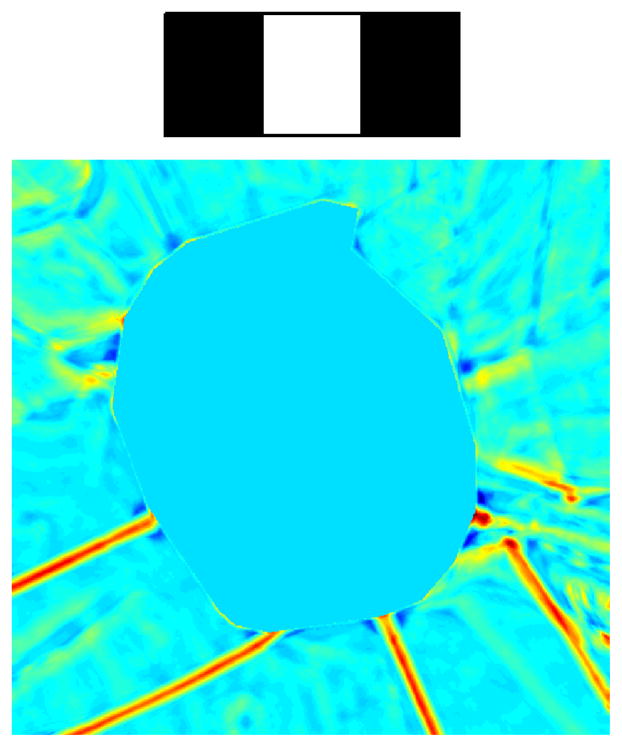
Next the pixel location mid-way between the mates is examined to ensure that it is located in a sufficiently bright local image patch. This is verified by a Haar filtering method, in which a Haar filter is defined to reward a bright region of pixels (with width corresponding to the expected value of w) surrounded on both sides by darker pixels. The filter kernel (see Fig. 4(top)) is tuned to a specific orientation, so multiple kernel orientations are evaluated at each pixel, with the maximum response over orientations recorded at each pixel (Fig. 4(bottom)). The resulting map is used to verify that a candidate pair of mates is suitable for Hough voting. Any candidate that passes this test casts a vote in the (d, θ, w) space. Peaks are located in Hough space, and the pixels that voted for each pixel are identified, thereby determining a binary stripe edge map (see Fig. 5(c)).
Figure 4.
(Top) Haar filter kernel used as intensity-based evidence for stripes in modified Hough transform. (Bottom) Result of the correlation of Haar-like filters with image in Fig. 3 (bottom): stripe features are enhanced (in red).
G. Matching aerial image to template
The binary stripe edge map is translated against a Canny edge map of the template, and the correlation is evaluated at each possible translation. This procedure identifies the most likely translation, which equates to the localization estimate.
Since the bearing estimate is only approximate, we repeat this procedure over a range of bearings (the estimate ±15°, in increments of 1°), and at each pixel take the maximum over all possible bearings.
IV. Experiments
In this section we describe our experimental procedure and evaluate the results of our algorithm on a dataset of intersection images.
A. Procedure
We used an unlocked Android Samsung Galaxy 4 smart-phone in our experiments. One of the authors served as photographer, using our image acquisition app to acquire a total of 19 panoramas, each in a distinct location. The locations were distributed among 3 intersections, two of which were four-way intersections and one of which was a T-junction intersection. Another experimenter estimated the photographer’s location for each panorama, making reference to curbs, crosswalk stripes and other features visible in satellite imagery. (See discussion of this ground truth procedure below.) 17 of the panoramas were constructed from 9 images acquired over a range of roughly 180°, and the remaining 2 were each constructed from 18 images acquired over a range of roughly 360°.
All image analysis was performed offline.
B. Analysis
One of the challenges of this analysis is that it is difficult to obtain precise ground truth localization measurements. We estimated ground truth by combining knowledge of intersection features obtained from satellite imagery with visual inspection of the photographer’s location relative to these features. For instance, most locations were constrained to lie on the curb (since this is a likely location for a blind person to stand when approaching an intersection, and which can be verified using a white cane), which is visible in satellite imagery. We also estimated locations relative to the crosswalk corridor, often using units of corridor width.
While this procedure is far from perfect, we estimate that our ground truth estimates are off by no more than 1 to 2 meters from the true locations. Therefore, in evaluating the performance of an algorithm or sensor, we claim that errors of 1 to 2 meters may not be significant, whereas errors of 5 meters or more are significant.
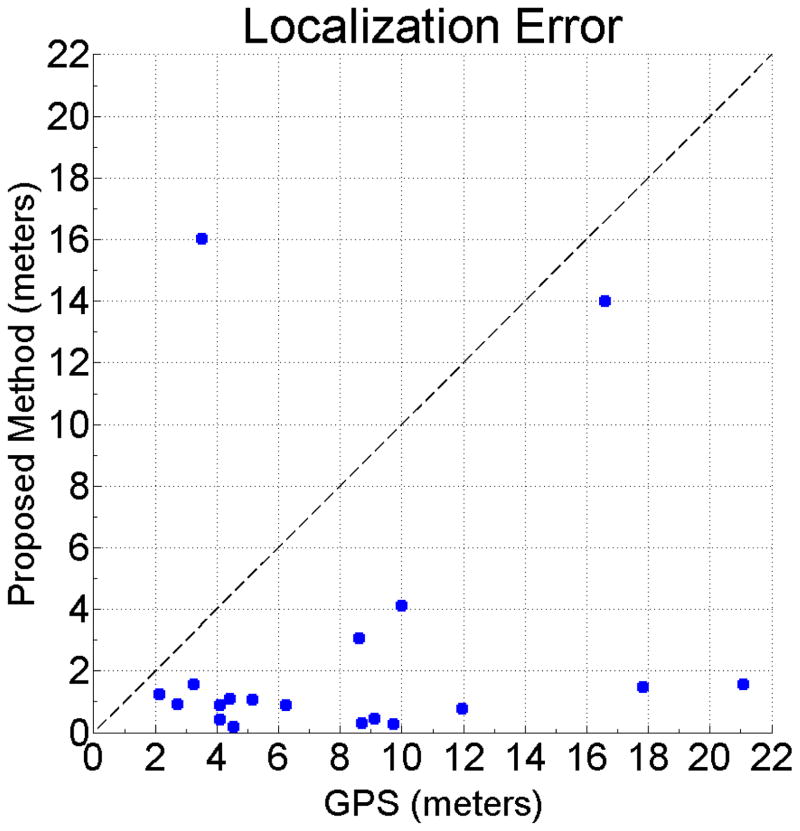
Fig. 6 shows a scatter plot of localization error (in meters), with the localization error for GPS on the x-axis and for our proposed method on the y-axis. Points below the dashed (x = y) line are points for which GPS localization error is worse than the error for our method. Note that our method outperforms GPS for all but one case. In addition, we found that our method was able to determine the correct corner that the user is standing at in all but two cases. The two gross error cases (error around 16 meters) for our method resulted from either a severely distorted magnetometer reading or poor segmentation of the aerial image.
Figure 6.
Scatter plot of localization error (in meters), with the localization error for GPS on the x-axis and for our proposed method on the y-axis. Note that our method outperforms GPS for all but one case.
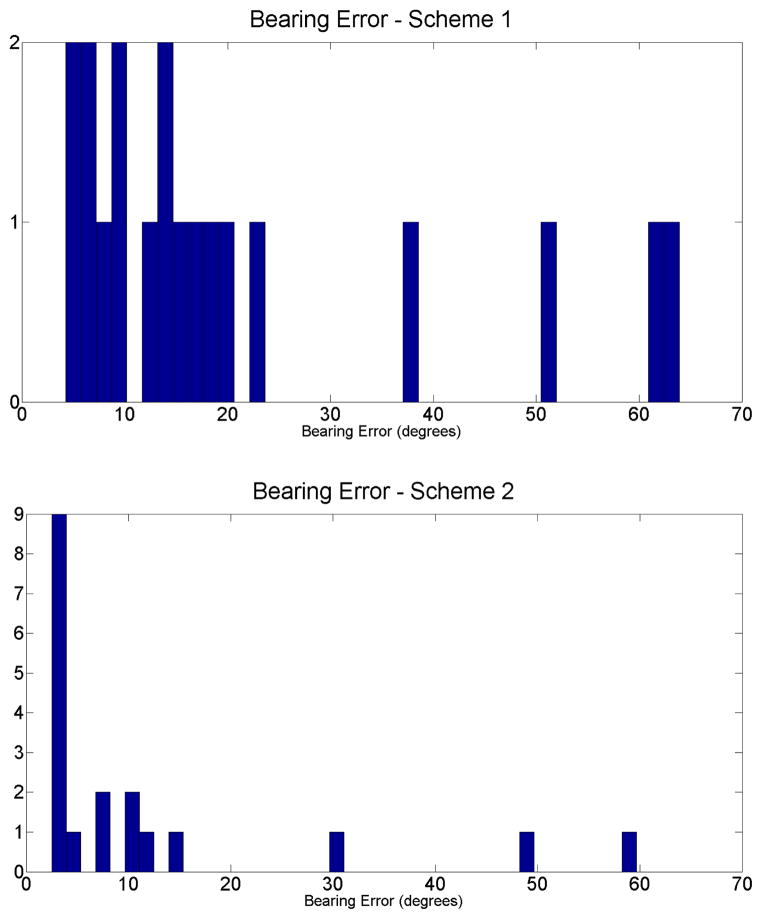
Finally, to compare the effectiveness of Scheme 1 and 2, we manually estimated the bearing error (how misaligned to north the aerial image was) for both schemes, as shown in Fig. 7. The histograms demonstrate that the bearing error is lower for Scheme 2, but that the error is still large (over 20°) in several cases.
Figure 7.
Histograms of the absolute value of bearing estimation error, shown for Scheme 1 (top) and Scheme 2 (bottom). Note that the error is lower for Scheme 2 than for Scheme 1.
V. Discussion
One of the biggest challenges we encountered in our work is the collection of reliable ground truth. We plan to devise a systematic approach to obtaining more precise ground truth in order to perform a quantitative analysis on a larger number of intersections.
We also observe that large localization errors in our experiments are usually associated with either a distorted magnetometer reading (e.g., due to a large metal object near the smartphone) or a segmentation error (e.g., a false positive or false negative crosswalk stripe segmentation). However, since collecting the data for our experiments, we subsequently discovered that we are now able to consistently avoid gross magnetometer distortions by simply launching the Crosswatch smartphone app well before the panoramas are acquired, on the sidewalk in a location far from the curb (where metal objects are likely to appear).
We hypothesize that this improvement arises for the following reason: The IMU orientation estimates fuse information from the magnetometer, accelerometer and gyroscope and integrate them over time, so that the orientation estimates are more robust against momentary distortions of any component sensor. This integration requires sufficient time to produce reliable orientation estimates, which can be facilitated by letting the Crosswatch app run for a longer time.
We also tried using GPS as an additional form of location information, which would augment the computer vision-based localization information. However, we found that significant GPS errors often occurred (and the magnitude of the error was not necessarily well correlated with the GPS uncertainty reported by the GPS sensor). The GPS errors were never great enough to misidentify the current intersection, but were large enough to prevent the GPS information from improving the estimates based on our computer vision algorithm. In the future we will experiment with the use of other location evidence in addition to GPS, including Wi-Fi/cell tower triangulation, etc.
In the future we will focus on improving the crosswalk stripe detection algorithm, to reduce the incidence of false positive and false negative detections. Empirically, most of the false positives we encounter are objects such as fire hydrants, poles and other vertical objects (even the pants leg of a pedestrian), which violate the ground plane assumption used to create the aerial view image, and which appear roughly stripe-like in the aerial view. We will experiment with a stripe hypothesis verification stage that analyzes each stripe hypothesis in the original image (or panorama) in which it appears, where it should be straightforward to distinguish a crosswalk stripe from most false positives.
VI. Conclusion
We have demonstrated a novel image-based self-localization technique for use in the “Crosswatch” project previously conceived by the authors, for providing guidance to blind and visually impaired pedestrians at street intersections. We have quantitatively evaluated our algorithm’s performance on a dataset of image panoramas and have found that our method performs significantly better than GPS.
In future work, we plan to adapt our approach to other types of crosswalks, including zebra crosswalks, and to test our system extensively with blind and visually impaired users. We will explore the possibility of incorporating other localization information such as Wi-Fi/cell tower triangulation. It might be useful to incorporate features (e.g., SIFT) from Google Streetview imagery; while this imagery is limited in the kind of 3D information it provides (for instance, parallax information is severely limited by the fact that the imagery is only acquired by a camera mounted on a car traveling in the street), it might add some useful 3D information. Finally, we will implement the system as an app running entirely on the smartphone, perhaps offloading some calculations to a remote server.
Acknowledgments
The authors acknowledge support by the National Institutes of Health from grant No. 2 R01EY018345-06 and by the Department of Education, NIDRR grant number H133E110004.
Contributor Information
Giovanni Fusco, Email: giofusco@ski.org.
Huiying Shen, Email: hshen@ski.org.
James M. Coughlan, Email: coughlan@ski.org.
References
- 1.Brabyn J, Alden A, SH-PG M.: Gps performance for blind navigation in urban pedestrian settings. Proc Vision. 2002;2002 [Google Scholar]
- 2.Coughlan J, Shen H. Crosswatch: a system for providing guidance to visually impaired travelers at traffic intersections. Journal of Assistive Technologies. 2013;7(2):6–6. doi: 10.1108/17549451311328808. [DOI] [PMC free article] [PubMed] [Google Scholar]
- 3.Arth C, Klopschitz M, Reitmayr G, Schmalstieg D. Real-time self-localization from panoramic images on mobile devices. Mixed and Augmented Reality (ISMAR), 2011 10th IEEE International Symposium on; IEEE; 2011. pp. 37–46. [Google Scholar]
- 4.Kurz D, Meier PG, Plopski A, Klinker G. An outdoor ground truth evaluation dataset for sensor-aided visual handheld camera localization. Proceedings of the 12th International Symposium on Mixed and Augmented Reality; 2013. [Google Scholar]
- 5.Arth C, Mulloni A, Schmalstieg D. Exploiting sensors on mobile phones to improve wide-area localization. Pattern Recognition (ICPR), 2012 21st International Conference on; IEEE; 2012. pp. 2152–2156. [Google Scholar]
- 6.Aranda J, Mares P. Computers Helping People with Special Needs. Springer; 2004. Visual system to help blind people to cross the street; pp. 454–461. [Google Scholar]
- 7.Ahmetovic D, Bernareggi C, Mascetti S. Zebralocalizer: identification and localization of pedestrian crossings. Proceedings of the 13th International Conference on Human Computer Interaction with Mobile Devices and Services; ACM; 2011. pp. 275–284. [Google Scholar]
- 8.Vázquez M, Steinfeld A. Helping visually impaired users properly aim a camera. Proceedings of the 14th international ACM SIGACCESS conference on Computers and accessibility; ACM; 2012. pp. 95–102. [Google Scholar]
- 9.Murali VN, Coughlan JM. Smartphone-based crosswalk detection and localization for visually impaired pedestrians. Proceedings of the ICME 2013 Workshop on Multimodal and Alternative Perception for Visually Impaired People (MAP4VIP); IEEE; 2013. [DOI] [PMC free article] [PubMed] [Google Scholar]
- 10.Kelly J, Sukhatme GS. Visual-inertial sensor fusion: Localization, mapping and sensor-to-sensor self-calibration. The International Journal of Robotics Research. 2011;30(1):56–79. [Google Scholar]
- 11.Szeliski R. Computer vision: algorithms and applications. Springer; 2011. [Google Scholar]
- 12.Brown M, Lowe DG. Automatic panoramic image stitching using invariant features. International Journal of Computer Vision. 2007;74(1):59–73. [Google Scholar]


