

Abstract
The growth and division of Staphylococcus aureus was monitored by atomic force microscopy (AFM) and thin-section transmission electron microscopy (TEM). A good correlation of the structural events of division was found using the two microscopies, and AFM was able to provide new additional information. AFM was performed under water, ensuring that all structures were in the hydrated condition. Sequential images on the same structure revealed progressive changes to surfaces, suggesting the cells were growing while images were being taken. Using AFM small depressions were seen around the septal annulus at the onset of division that could be attributed to so-called murosomes (Giesbrecht et al., Arch. Microbiol. 141:315-324, 1985). The new cell wall formed from the cross wall (i.e., completed septum) after cell separation and possessed concentric surface rings and a central depression; these structures could be correlated to a midline of reactive material in the developing septum that was seen by TEM. The older wall, that which was not derived from a newly formed cross wall, was partitioned into two different surface zones, smooth and gel-like zones, with different adhesive properties that could be attributed to cell wall turnover. The new and old wall topographies are equated to possible peptidoglycan arrangements, but no conclusion can be made regarding the planar or scaffolding models.
The cell wall is an essential structure for almost all bacteria, functioning as a rigid exoskeleton for protection against both mechanical and osmotic lysis and for contouring cellular shape (7). The cell wall is also important in controlling cellular interfacial interactions with the environment, cell-substratum adhesion, and cell-cell aggregation (4, 12).
Over the past decade, much progress has been made in understanding the surface ultrastructure of bacteria. Electron microscopy (EM) has long been recognized as a key technique in microbiology to elucidate such surfaces (7-10), and the development of cryotechniques has just begun to allow high-resolution imaging of vitrified cell structures in conditions close to the native hydrated state (39, 31). Yet, such cryo-methods are technically demanding and possible in only a few laboratories worldwide. Direct observation of a bacterium in aqueous solution is, however, difficult, making direct measurement of molecular interaction forces at the cell surface rare (2, 3, 14, 15, 18-21, 30, 35, 38, 40, 41, 42). Since its discovery in 1986, atomic force microscopy (AFM) has become an important tool for investigating biological materials such as tissues, yeasts, bacteria, and their components (1, 18-20). By imaging bacteria in aqueous solution, AFM can provide real-time in situ quantitative morphological information as well as measurement of the interaction forces between AFM tip (or modified probe) and cell surface.
However, there are a number of practical challenges that must be overcome when such measurements are attempted on bacteria. One problem is that the cells can be deformed under the loading force applied by the AFM tip. This leads to a reduction in lateral resolution and complicates the deconvolution of surface forces and deformation in force curve analysis. Another problem is the difficulty associated with sample preparation; it is crucial that cells be well attached to a solid substrate. Without this strong attachment, cells can move in response to the lateral movement of the tip, and can be pushed across the surface during imaging. Since bacteria adhere to inanimate surfaces via weak-bonding forces that are readily broken by the tip movement, cells are frequently knocked away before imaging. Therefore, various immobilization procedures have been developed, such as air drying, chemical fixation, and immobilization in hydrated gels (18-20, 26, 42, 44). Unfortunately, these methods can artificially alter bacterial surfaces.
One way to solve this problem is to trap bacterial cells in porous polymer membranes (18-20, 38). Using this method, we have employed contact-mode AFM to investigate real-time changes in the staphylococcal cell wall as cells grow and divide in growth medium. To assist interpretation of the resulting AFM images, the data are compared to electron micrographs of thin sections from conventionally embedded staphylococci at similar time points of growth and division. Furthermore, AFM force curves were recorded at different locations on the growing and dividing surfaces of cells. Such curves provide valuable information on the tip-surface interaction, which is sensitive to the chemical nature of cell surface macromolecules.
MATERIALS AND METHODS
Bacteria and growth conditions.
Staphylococcus aureus D2H is a representative staphylococcus and was used for study. It was maintained on Trypticase soy agar slants (Difco) until experimentation. A slant culture initiated an overnight Trypticase soy broth culture that was used for the mid-exponential growth phase (optical density at 600 nm = 0.2) used for study. All liquid cultures were grown at 37°C, whereas the AFM liquid cell was held at 20°C in an attempt to slow growth for better surface visualization.
Cell immobilization.
A 10-ml cell suspension was gently sucked through an isopore polycarbonate filter membrane with a pore size comparable to the cell size (diameter, 1.2 μm). After filtration, the filter was gently rinsed with deionized water to wash cells of surface debris, turned upside down, and attached to a glass substrate using a small piece of double-sided adhesive tape. The mounted sample was then transferred into the AFM liquid cell containing Trypticase soy broth. All manipulations before microscopy were rapidly accomplished so as to ensure cells remained hydrated and were not subjected to high shear (which would dislodge them). This protocol produced many filter pores whose ends were plugged with a single cell. These staphylococci were so strongly entwined with the polycarbonate meshwork of the filter that contact-mode AFM could be performed over a large part of their protruding surfaces.
AFM measurements.
AFM images and force measurements were recorded in contact mode at room temperature using a Molecular Imaging Microscope. Images were recorded in both height and deflection modes. While height images provided quantitative information on sample surface topography, deflection images often exhibited higher contrast of morphological details. Imaging forces were kept between 0.5 and 1.0 nN, and scan rates were between 2 and 4 Hz. V-shaped cantilevers with oxide-sharpened Si3N4 tips (Veeco Co.) were used with spring constants of 8 ± 4 mN/m. Cantilever spring constants were determined by measuring the tip deflections for known applied forces as described by S. K. Jericho et al. (25). All measurements were performed in growth medium, and all images are representative of several different cells, each imaged at the same stage of growth or division.
Transmission EM (TEM).
As with AFM, bacteria were harvested at mid-exponential growth. They were then fixed via a glutaraldehyde-osmium tetroxide protocol, dehydrated using an ethanol-propylene oxide series, and embedded in LR White (London Resins, Marivac, Nova Scotia) according to the method of Beveridge et al. (11). Thin sections were stained with uranyl acetate and lead citrate. Imaging was performed using an FEI CM10 or an LEO 912AB device, both operating at 100 kV under standard conditions.
RESULTS AND DISCUSSION
General views of bacteria.
TEM of thin sections revealed that the staphylococci were in various states of growth and cell division. The cell wall was an amorphous matrix ca. 25 nm thick and lay on top of the plasma membrane (Fig. 1). No high-order structure was seen that could be attributed to molecular arrangements of peptidoglycan or secondary polymeric or proteinaceous components, and no capsule was distinguished. These images correlated well with low-resolution AFM images of the bacteria; single spherical cells were seen studding many of the filter membrane pores (Fig. 2), and these spherical cells had rather featureless surfaces. To ensure little deformation, AFM imaging forces of ca. 1 nN were used and images of the same area of each cell could be repeatedly obtained without detaching the cell or altering surface morphology. The bacteria were easily differentiated from the flat polymer surface of the filter (Fig. 2). The advantage of height imaging is that it provides a quantitative measure of cell dimensions, layer thickness, and surface roughness while the bacterium is hydrated. Each entrapped cell showed an artifactual ridge at one edge attributable to the initial contact between AFM tip and pore (Fig. 2).
FIG. 1.

High-magnification TEM of a thin section of S. aureus D2H showing the cell wall (CW) and plasma membrane (PM). Bar = 50 nm.
FIG. 2.

Three-dimensional AFM image of two S. aureus bacteria trapped in pores of a polycarbonate filter membrane. The raised pore edge (black arrow) is an imaging artifact. The white arrow indicates the flat filter substrate. Image size, 4 by 4 μm; height of bacteria above the filter plane, 600 nm.
Features attributable to growth and division.
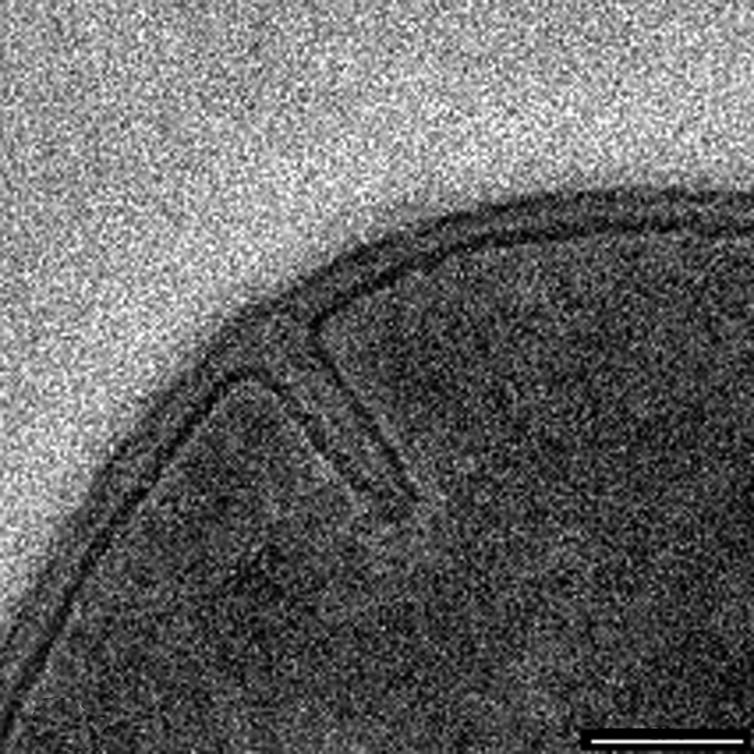
One of the first observable features of growth and division among staphylococci is the onset of septation, which, as seen in thin-section TEM, is a visible growth of wall material into the cytoplasm (Fig. 3A). This septum will continue its inward growth (like the closing of a camera aperture) until a cross-wall is formed that completely separates the two daughter cells (Fig. 3B to D). At this point the cells remain joined together but eventually, through a process called splitting, separate (Fig. 4A and B). During septation a small cleft is seen in the periphery of the wall (Fig. 3C and D). This stage is the first topological feature that is seen by AFM, where a shallow cleft is found in the relatively smooth homogeneous surface at the midpoint of a cell (Fig. 5A). A single x,z scan by the AFM tip at right angles to the division plane (i.e., an AFM cross section) shows this septal depression clearly (Fig. 5B is the scan outlined by the solid line across the cell in Fig. 5A). As septation progresses, the septum grows further inwards into the cytoplasm until the cross-wall is formed (Fig. 3D). The depth of the cleft will depend on the extent to which septation has progressed. Since TEM and AFM images were taken on different cells and at different stages in the division process, a comparison of the depth of the clefts may not be meaningful.
FIG. 3.

(A to D) Sequence of division seen in D2H by thin-section TEM. (A) The septum has just been initiated and can be seen at the upper and lower periphery of the cell. The leading edge of each portion of the septum has a plasm membrane intrusion attached to it. (B and C) These are more advanced stages of septum in-growth, and membrane intrusions can still be seen at the leading edges. (D) Here, the septum is complete and bisects the cell to form (eventually) two daughter cells. (B and C) A dark midline of highly reactive dense staining material can be seen along the center of the septum. (C and D) The arrows point to the peripheral regions where the septum has commenced to split. Bars = 200 nm.
FIG. 4.

(A) The daughter cells are actively splitting away from one another so that only approximately half of the septum remains intact. (B) Here, the cells have actually split away from one another, and now they each can be called a daughter cell. The arrows point to the new regions of the cell wall (approximately half of the total cell wall) that had before formed the septum. Bars = 200 nm.
FIG. 5.

(A) Single bacterium immobilized in a filter pore. The septum furrow shows that the bacterium is in an early stage of cell division. (B) Cross-section along the line in image panel A. The arrow indicates the cleft position. Bar = 140 nm.
Throughout this process a darkly staining middle line (or midline; Giesbrecht et al. [23] refer to this as the “splitting system”) is seen running down the center of the septum by thin-section TEM (Fig. 3B to D). Since staining for TEM requires the binding of heavy metal stains to reactive sites within biomaterials, this midline is a region within the growing septum or cross-wall that is distinctly different from the surrounding wall fabric (Fig. 6), containing more reactive sites (11). At the periphery of the wall, at such advanced septation sites, the cell wall becomes more indented as cell splitting is initiated; here, small fibers are revealed by thin-section TEM (Fig. 7; see the slightly darker strip that appears to span the cleft). A similar darkening is also visible in Fig. 3D (bottom cleft). This more advanced septation, where cell splitting begins, can also be seen as a series of regularly situated perforations by AFM observations spaced approximately 100 nm apart (Fig. 8A). At higher magnification, these perforations were seen as holes approximately 50 to 60 nm in diameter (Fig. 8D), as was confirmed by x,z scans (Fig. 8E is the region in Fig. 8D outlined by the solid line). Correlation between the fibers seen by TEM (Fig. 7) and the holes seen by AFM (Fig. 8A to D) suggest they are one and the same. After approximately 1 h, AFM on the same dividing cell revealed that the holes had enlarged until they merged together to form a single larger perforation (Fig. 8B and C). Two explanations are possible for this occurrence: (i) this is a real-time progression of cell splitting where autolysins are systematically cutting bonds in the peptidoglycan to ensure eventual daughter cell separation, or (ii) this is a tip-induced deformation that enlarges these delicate sites. If it is a deformation, this particular site is clearly more deformable than surrounding wall regions (which also implies autolysin activity). Interestingly, the heavily stained midline seen by TEM just below this region (Fig. 3B to D, 6, and 7) indicates a concentration of reactive sites, thereby implying that bonds have also been broken here. This is where the eventual splitting between cells will eventually progress to. More advanced division stages clearly shows this progression in thin section where the daughter cells are almost separated (Fig. 4A).
FIG. 6.
A high magnification of a developing septum for comparison with Fig. 3B so that the darkly stained midline can be seen. Bar = 100 nm.
FIG. 7.

A high magnification of a more-advanced septum showing the initial phase of splitting. The two arrows point towards small fibers remaining associated with each wall surface after splitting has occurred, thereby forming small holes in the septal fabric. These could be analogous to the small holes also seen by AFM (Fig. 8). Bar = 50 nm.
FIG. 8.

(A to C) AFM deflection images showing advanced stages of septation in a cell. (A) The furrow is perforated by a series of equally spaced holes. (B and C) Hole enlargement over about a 1-h period at room temperature. (D) AFM height image of the cell in panel A. (E) Cross section through the perforation holes parallel to the line shown in panel D. The 50- to 60-nm-diameter holes have a center-to-center spacing of about 100 nm. (A) Bar = 220 nm; (B and C) bar = 120 nm.
Eventually, separation is complete, and what used to be part of the septum now becomes newly formed cell wall (Fig. 4B). As seen by the deflection mode of AFM, this new wall has a high degree of infrastructure that is not apparent by thin-section TEM. Circular or concentric rings are seen enclosing a central depression (Fig. 9A), which are similar to the circular patterns seen by Amako et al. via freeze-etching TEM and scanning EM (SEM) (4, 5), Giesbrecht et al. via thin-sectioning TEM (22, 23), and Beveridge et al. via negative-staining TEM (8). An x,z scan through the central depression showed it to be at least 30 nm deep (Fig. 9B shows a height mode AFM image, and Fig. 9C is the x,z scan of the solid line seen in Fig. 9B). Examination of radial sections, such as that in Fig. 9B, taken in several directions around the central depression, showed a spectrum of spacings between ring structures. A histogram of the spacings measured on several cells is shown in Fig. 9D; spacings of 13 to 25 nm were common, but larger spacings also occurred. Higher magnifications verified the concentricity of the rings (Fig. 10A), and x,z scans revealed that the height of the rings increased as they approached the central depression (from ∼1 to ∼2 nm; Fig. 10B follows the solid line from left to right). Interestingly, each ring also possessed its own topography, with a height and amplitude of 1 to 2 nm (Fig. 10B).
FIG. 9.

(A and B) AFM deflection and height images, respectively, of a newly formed cell wall (4, 5, 8, 22, 23), showing concentric rings that surround a central depression. (C) Cross section along the line indicated in panel B, showing a 30-nm-deep depression at the center. (D) Histogram of the ring periods obtained from many radial cross-sections on image (B). Spacings of 13 to 25 nm were common, but larger spacings were also observed. Bar = 50 nm.
FIG. 10.

(A)AFM height image of a new cell wall showing a portion of the ring structure surrounding the central depression. Image size = 600 by 600 nm. (B) Cross section along the line shown in panel A. The corrugation amplitude increases towards the central depression.
The concentric ring structures were not visible on older regions of the cell walls. High-resolution AFM imaging of these older areas, however, showed what appeared to be a network of fibers with a large number of empty spaces between them (Fig. 11) that was not seen by thin-section TEM. x,z scans through similar regions showed a diversity of infrastructure within this meshwork (Fig. 12A and B) and provided a wealth of dimensional data. Individual fibers, as small as 8 to 14 nm in diameter, could be distinguished (Fig. 12B). If allowance is made for tip convolution effects, these individual fibers may have widths in the order of a few peptidoglycan strands. The spatial resolution in our experiments was, however, insufficient to clearly identify and determine the orientation of individual structural components of the cell surface. The diameter and depth of the depressions within the network were variable but were usually on the order of 2.5 to 4.0 nm (Fig. 12C and D). It is likely that the measured depth was limited by tip geometry. The structures shown in Fig. 11 and 12 were observed over the contoured regions of the cell surface (Fig. 13A, regions a) where negligible tip adhesion was observed. Reproducible imaging of the sponge-like structure could be obtained for different scan speeds, scan directions, and imaging forces between 0.5 and 3 nN. We therefore believe that the images reflect an intrinsic structure of the cell surface and not a tip induced artifact.
FIG. 11.

High-resolution AFM image of an older region of the cell wall. The image shows a network of fibers with large empty spaces. Bar = 50 nm.
FIG. 12.

(A) High-resolution contact mode AFM image of an old wall section. (B) Cross section measurement along the line shown in panel A. Individual fibers as small as 8 to 14 nm can be identified. If allowance for tip convolution is made then such fibers could have widths on the order of a few peptidoglycan strands. (C) High-resolution image of another section of an old cell wall. (D) Cross-section along the line shown in panel C. The depth of some of the depressions in these images were 40 nm and depth measurement was limited by AFM tip geometry.
FIG. 13.

(A) Deflection image of an older section of the bacterial wall. The image shows contoured regions (a) as well as much smoother areas (b); Bar = 40 nm. (B) Force spectra over the contoured regions (a) showed negligible tip adhesion when cantilevers were retracted from the surface. Cantilever retraction curves over the smooth regions, however, showed tip adhesion effects (see double-headed vertical arrow [curve b]), and a force spectrum characteristic for polymer stretching was generally observed. Rupture length, indicated by the horizontal double-headed arrow, was 200 nm.
On a coarser scale, these older cell wall surfaces often showed considerable variation in the way the AFM tip interacted with it. Deflection images revealed that the surface was actually made up of smooth and contoured zones (Fig. 13A). Force curves collected over smooth zones (Fig. 13A, regions b) showed the characteristic force spectrum expected for polymer adhesion (36). After adhesion and during tip retraction, the polymers in these smooth zones stretched until rupture. The maximum stretching force (Fig. 13B, curve b) was ∼300 ± 50 pN and the rupture length is about 200 nm (Fig. 13B, curve b). On the other hand, the more-structured contoured zones only showed force spectra characteristic of nonadhering tips (Fig. 13B, curve a); here, the tip approach and retraction curves were identical. Clearly, there must be considerable physicochemical differences between these two types of zones that are due to their macromolecular composition. Each zone could reflect the degree of surface autolysis or secondary polymer concentration in these regions of the wall. A detailed study of the variation of adhesion force over the bacterial surface is in progress and will include adhesion mapping.
General comments on cell division.
Bacteria, especially gram-positive varieties, must be careful during growth (i.e., the expansion of existing cell wall) and division (i.e., septation and cell splitting) since they are under considerable turgor pressure. Uncontrolled wall turnover or septation could deregulate autolysins resulting in cell lysis. For S. aureus, septation and cell splitting (i.e., the actual separation of one daughter cell from the other) are important events since much of the new wall material is incorporated and remolded at these stages for each cell. According to Giesbrecht et al. (22, 23), cell splitting starts with the creation of a row of holes in the peripheral cell wall directly above the septum (or cross-wall). These holes are thought to be structures in the wall (i.e., murosomes) possessing high autolytic activity, which digest away adjacent peptidoglycan and lead to the splitting. More recent data suggest that a bifunctional autolysin with both amidase and glucosaminidase activity (Atl) forms an initial ring structure on the surface at the septal site (6, 32, 37, 43). It is possible that the holes shown in Fig. 8A are the result of this early autolytic activity eventually producing Giesbrecht's murosomes. Our AFM images show the holes to be 50 to 60 nm in diameter and to have a center-to-center spacing of ∼100 nm. For S. aureus with a diameter of ∼1 μm, this implies about 30 perforation holes initially around the bacterial circumference. As our AFM imaging proceeded, the holes became larger and merged into one other (Fig. 8B and C), thus creating longer cuts in the peripheral wall as splitting proceeded. This action by murosomes would continue from the septum periphery inwards until the daughter cells had completely split. Thin-section TEM showed a heavily stained midline in the septum below the murosomal action (Fig. 3C and D and 6), which suggests that peptidoglycan hydrolysis in septa is already occurring at these regions in advance of murosome activity, possibly to make room for the advancing murosomes and their splitting activity. As murosomes perforate the septum, tension will now develop in the two halves of the cross-wall, and cell separation, in principle, will continue through purely mechanical means provided the two halves of the cross-wall are not too strongly bonded along the midline of the splitting system.
Once the daughter cells have separated, their new walls (that were previously part of the cross-wall) will become accessible to AFM imaging. Here we see the concentric rings that have been seen by other researchers via scanning EM and TEM (4, 5, 8). The question arises as to what this ring pattern actually represents. One possibility is that the ring structure represents structural features of the splitting system created by a synthetic process that produces alternate ridges and grooves. The above-mentioned TEM studies were carried out with S. aureus, Staphylococcus epidermis, and Bacillus anthracis and show the rings on both the inside and outside faces of the cell wall. This strongly suggests to us that the ring pattern is an integral part of the fabric of the new cell wall and that it most likely does not only represent structural features of the splitting system. Since new peptidoglycan is inserted at the inner face of the wall via penicillin-binding proteins (33) and since the splitting system must involve autolysins and the breakdown of peptidoglycan as the daughter cells separate, it is logical to assume that the rings are structural features or remnants of the putting in and taking out of the peptidoglycan during the division of these gram-positive bacteria. For example, if the peptidoglycan strands are oriented perpendicular to the cross wall (see next paragraph), then some circular regions may have the peptidoglycan ends protrude slightly above the plane of the cross-wall while other circular regions might have the ends slightly below this plane, thus generating a landscape of circular grooves and valleys. Peptidoglycan strands are composed of disaccharide units ∼1 nm in length, and a single tessera of the peptidoglycan wall fabric has a characteristic length of ∼4.5 nm (29). These dimensions are comparable to the dimensions of some of the topographic features of the ring structure discussed above and it is possible that the topographic features of the rings reflect structural features of the peptidoglycan strands.
The concentricity of the rings implies that the peptidoglycan strands that help make up the wall are, themselves, oriented in a similar fashion and are added or removed in an orderly manner. There could be three distinct ways of doing this: (i) the glycan strands lie in the plane of the cross-wall and are oriented radially, (ii) the strands are oriented tangentially to the inner surface, or (iii) the strands are oriented perpendicular to the plane of the cross-wall. In cases i and ii, the peptidoglycan strands would end up lying in the plane of the cross wall and hence in the plane of the new cell wall after cell separation. This would imply that after several cycles of division in S. aureus, where new cross-walls are approximately orthogonal to the last division plane, the cell wall would break up into a mosaic of peptidoglycan orientations that would weaken the overall bonding in the wall (i.e., similar to crystal defects in other networks, such as cellulose), thereby affecting the wall's strength. The cell wall has to support a large turgor pressure (28), and it is not clear that this in-plane arrangement of peptidoglycan could provide the necessary mechanical strength to contain this pressure (34). It therefore seems that the third possibility, in which strands are oriented perpendicular to the cell wall to form a scaffolding, may be the preferred option. The possibility of a scaffolding-like peptidoglycan arrangement in gram-positive walls has recently been suggested by Dmitriev et al. (16, 17), but clearly more definitive data beyond what we have found here will be necessary for this model's confirmation.
In a three-dimensional peptidoglycan network, as exists in the S. aureus wall, all peptide stems (i.e., the peptide portion of the glycan strand) can, in principle, participate in cross-linking and a complex multilayered wall structure is possible. Unlike Enterococcus hirae, where all new wall material emanates from the cross wall (24), some turnover of preexisting wall in S. aureus is possible (13, 23). Accordingly, old cell wall material should be shed from the outer wall surface, making it less cross-linked and less tightly bound than the underlying regions. It was, therefore, interesting that preexisting wall had a loosely arrayed network on its surface, consisting of fibrils and holes (Fig. 11 and 12A to D). Indeed, this loose meshwork resembled a gel-like matrix that would be highly hydrated; our impression is that the fibrils consisted of linear aggregates of two or more peptidoglycan strands of low bonding order. At this time it is impossible to determine if the strands would be planar (Koch's tessera model [27]) or perpendicular (scaffolding model of Dmitriev et al. [17]) to the flat axis of the surface since we could not image individual strands by AFM because of tip convolution effects. Yet, our gel-like topography would be consistent with active hydrolysis of the surface by autolysins and wall turnover.
Differential AFM provided better contrast to the old wall surface and revealed that it did not entirely consist of the gel-like topography. Some regions were relatively smooth (Fig. 13A). Force curves of both zones (Fig. 13B) revealed that the smooth zones possessed more adhesiveness than the gel-like zones, suggestive of macromolecular differences or rearrangements between the zones. It is possible that the more loosely arranged zones (Fig. 13A, region a) are soft zones with little structural integrity because of wall turnover. They would therefore have no stretching capacity once stuck to the AFM tip because of reduced polymer bonding and this would be consistent with our explanations above.
In summary, the data produced by AFM on S. aureus correlate well with the thin-section TEM data and considerably expand it. AFM was able to follow the division process with precision and confirm the initial splitting of the septum, presumably by murosomes. After daughter cells had separated, concentric rings were found on the surface of the new wall. The old wall contained two surface zones, a smooth zone that had a high degree of adhesive properties and a gel-like zone that was less adhesive. These results on division, new walls, and old walls are interpreted at the macromolecular level so as to implicate peptidoglycan assembly and turnover and are consistent with either the planar or scaffolding models of peptidoglycan arrangement.
Acknowledgments
We are indebted to V. Matias for the processing of the S. aureus culture for thin-section analysis, D. Moyles for thin sectioning, R. Harris for assisting with image formatting, and A. Saxena for the supplying the culture (all four are members of T.J.B.'s laboratory).
This research was supported by an NSERC-CIHR collaborative grant to M.J. and T.J.B. The EM was performed in the NSERC Guelph Regional STEM Facility, which is partially supported by an NSERC Major Facilities Access grant to T.J.B.
REFERENCES
- 1.Ahimou, F., A. Touhami, and Y. F. Dufrêne. 2003. Real-time imaging of the surface topography of living yeast cells by atomic force microscopy. Yeast 20:25-30. [DOI] [PubMed] [Google Scholar]
- 2.Ahimou, F., F. A. Denis, A. Touhami, and Y. F. Dufrêne. 2002. Probing microbial cell surface charges by atomic force microscopy. Langmuir 18:9937-9941. [Google Scholar]
- 3.Alonso, J. L., and W. H. Goldmann. 2003. Feeling the forces: atomic force microscopy in cell biology. Life Sci. 72:2553-2560. [DOI] [PubMed] [Google Scholar]
- 4.Amako, K., and A. Umeda. 1977. Scanning electron microscopy of Staphylococcus aureus. J. Ultrastruct. Res. 58:34-40. [DOI] [PubMed] [Google Scholar]
- 5.Amako, K., A. Umeda, and K. Murata. 1982. Arrangement of peptidoglycan in the cell wall of Staphylococcus spp. J. Bacteriol. 150:844-850. [DOI] [PMC free article] [PubMed] [Google Scholar]
- 6.Baba, T., and O. Schneewind. 1998. Targeting of muralytic enzymes to the cell division site of Gram-positive bacteria: repeat domains direct autolysin to the equatorial surface ring of Staphylococcus aureus. EMBO J. 17:4639-4646. [DOI] [PMC free article] [PubMed] [Google Scholar]
- 7.Beveridge, T. J. 1981. Ultrastructure, chemistry and function of the bacterial cell wall. Int. Rev. Cytol. 72:229-317. [DOI] [PubMed] [Google Scholar]
- 8.Beveridge, T. J. 1999. The ultrastruture of gram-positive cell walls, p. 3-10. In V. Fischetti, R. Novick, J. Ferretti, D. Portnoy, and J. Rood (ed.), Gram-positive pathogens. American Society for Microbiology, Washington, D.C.
- 9.Beveridge, T. J., and L. L. Graham. 1991. Surface layers of bacteria. Microbiol. Rev. 55:684-705. [DOI] [PMC free article] [PubMed] [Google Scholar]
- 10.Beveridge, T. J. 1999. Structures of gram-negative cell walls and their derived membrane vesicles. J. Bacteriol. 181:4725-4733. [DOI] [PMC free article] [PubMed] [Google Scholar]
- 11.Beveridge, T. J., T. J. Popkin, and R. M. Cole. 1993. Electron microscopy, p. 42-71. In P. Gerhardt (ed.), Methods for general and molecular bacteriology. American Society for Microbiology, Washington, D.C.
- 12.Beveridge, T. J., S. A. Makin, J. L Kadurugamuwa, and Z. Li. 1997. Interactions between biofilms and the environment. FEMS Microbiol. Rev. 20:291-303. [DOI] [PubMed] [Google Scholar]
- 13.Boneca, I. V., Z-H. Huang, D. A. Gage, and A. Tomasz. 2000. Characterization of Staphylococcus aureus cell wall glycan strands, evidence for a new β-N-acetylglucosaminidase activity. J. Biol. Chem. 275:9910-9918. [DOI] [PubMed] [Google Scholar]
- 14.Boonaert, C. J. P., P. G. Rouxhet, and Y. F. Dufrêne. 2000. Surface properties of microbial cells probed at the nanometer scale with atomic force microscopy. Surf. Interface Anal. 30:32-35. [Google Scholar]
- 15.Camesano, T. A., and B. E. Logan. 2000. Probing bacterial electrostatic interactions using atomic force microscopy. Environ. Sci. Technol. 34:3354-3362. [Google Scholar]
- 16.Dmitriev, B. A., S. Ehlers, and E. T. Riestschel. 1999. Layered muein revisited: a fundamentally new concept of bacterial cell wall structure, biogenesis and function. Med. Microbiol. Immunol. 187:173-181. [DOI] [PubMed] [Google Scholar]
- 17.Dmitriev, B. A., F. V. Toukach, K.-J. Schaper, O. Holst, E. T. Rietschel, and S. Ehlers. 2003. Tertiary structure of bacterial murein: the scaffold model. J. Bacteriol. 185:3458-3468. [DOI] [PMC free article] [PubMed] [Google Scholar]
- 18.Dufrêne, Y. F. 2003. Atomic force microscopy provides a new means of looking at microbial cells. ASM News 69:438-442. [Google Scholar]
- 19.Dufrêne, Y. F. 2003. Recent progress in the application of atomic force microscopy imaging and force spectroscopy to microbiology. Curr. Opin. Microbiol. 6:317-323. [DOI] [PubMed] [Google Scholar]
- 20.Dufrêne, Y. F. 2002. Atomic force microscopy, a powerful tool in microbiology. J. Bacteriol. 184:5205-5213. [DOI] [PMC free article] [PubMed] [Google Scholar]
- 21.Gad, M., A. Itoh, and A. Ikai. 1997. Mapping cell wall polysaccharides of living microbial cells using atomic force microscopy. Cell Biol. Int. 21:697-706. [DOI] [PubMed] [Google Scholar]
- 22.Giesbrecht, P., H. Labischinski, and J. Wenke. 1985. A special morphogenic wall defect and the subsequent activity of “murosomes” as the very reason for penicillin-induced bacteriolysis in staphylococci. Arch. Microbiol. 141:315-324. [DOI] [PubMed] [Google Scholar]
- 23.Giesbrecht, P., T. Kersten, H. Maidhof, and J. Wecke. 1998. Staphylococcal cell wall: morphogenesis and fatal variations in the presence of penicillin. Microbiol. Mol. Biol. Rev. 62:1371-1414. [DOI] [PMC free article] [PubMed] [Google Scholar]
- 24.Higgins, M. L., and G. D. Shockman. 1970. Model for cell wall growth of Streptococcus faecalis. J. Bacteriol. 101:643-648. [DOI] [PMC free article] [PubMed] [Google Scholar]
- 25.Jericho, S. K., and M. H. Jericho. 2002. Device for the determination of spring constants of atomic force microscope cantilevers and micromachined springs. Rev. Sci. Instrum. 73:2483-2485. [Google Scholar]
- 26.Kasas, S., and A. Ikai. 1995. A method for anchoring round shaped cells for atomic force microscope imaging. Biophys. J. 68:1678-1680. [DOI] [PMC free article] [PubMed] [Google Scholar]
- 27.Koch, A. L. 1998. The three-for-one model for Gram-negative wall growth: a problem and a possible solution. FEMS Microbiol. Lett. 162:127-134. [DOI] [PubMed] [Google Scholar]
- 28.Koch, A. L. 2000. The bacterium's way for safe enlargement and division. Appl. Environ. Microbiol. 66:3657-3663. [DOI] [PMC free article] [PubMed] [Google Scholar]
- 29.Labischinski, H., and H. Maidhof. 1994. Bacterial peptidoglycan: overview and evolving concepts, p. 23-28. In J.-M. Ghuysen and R. Hackenbeck (ed.), Bacterial cell wall. Elsevier, Amsterdam, The Netherlands.
- 30.Lower, S. K., M. F. Hochella, and T. J. Beveridge. 2001. Bacterial recognition of mineral surfaces: nanoscale interactions between Shewanella and α-FeOOH. Science 292:1360-1363. [DOI] [PubMed] [Google Scholar]
- 31.Matias, V. R. F., A. Al Amoudi, J. Dubochet, and T. J. Beveridge. 2003. Cryo-transmission electron microscopy of frozen-hydrated sections of Escherichia coli and Pseudomonas aeruginosa. J. Bacteriol. 185:6112-6118. [DOI] [PMC free article] [PubMed] [Google Scholar]
- 32.Oshida, T., M. Sugai, H. Komatsuzawa, Y.-M. Hong, H. Suginaka, and A. Tomasz. 1995. A Staphylococcus aureus autolysin that has an N-acetylmuranoyl-L-alanine amidase domain and an endo-β-N-acetylglucosaminidase domain: cloning, sequence analysis and characterization. Proc. Natl. Acad. Sci. USA 92:285-289. [DOI] [PMC free article] [PubMed] [Google Scholar]
- 33.Paul, T. R., A. Venter, L. C. Blaszcczak, T. R. Parr, Jr., H. Labischinski, and T. Beveridge. 1995. Localization of penicillin-binding proteins to the splitting system of Staphylococcus aureus septa by using a mercury-penicillin V derivative. J. Bacteriol. 177:3631-3640. [DOI] [PMC free article] [PubMed] [Google Scholar]
- 34.Pink, D., J. Moeller, B. Quinn, M. Jericho, and T. Beveridge. 2000. On the architecture of the gram-positive bacteria murein sacculus. J. Bacteriol. 182:5925-5930. [DOI] [PMC free article] [PubMed] [Google Scholar]
- 35.Poggi, M. A., L. A. Bottomely, and P. T. Lillehei. 2002. Scanning probe microscopy. Anal. Chem. 74:2851-2862. [DOI] [PubMed] [Google Scholar]
- 36.Rief, M., F. Oesterhelt, B. Heymann, and H. E. Gaub. 1997. Single molecule force spectroscopy on polysaccharides by atomic force microscopy. Science 275:1295-1297. [DOI] [PubMed] [Google Scholar]
- 37.Sugai, M., S. Yamada, S. Nakashima, H. Komatsuzawa, A. Matsumoto, T. Oshida, and H. Suginaka. 1997. Localized perforation of the cell wall by major autolysin: atl gene products and the onset of penicillin-induced lysis of Staphylococcus aureus. J. Bacteriol. 179:2958-2962. [DOI] [PMC free article] [PubMed] [Google Scholar]
- 38.Touhami, A., B. Hoffmann, A. Vasella, F. A. Denis, and Y. F. Dufrêne. 2003. Aggregation of yeast cells: direct measurement of discrete lectin-carbohydrate interactions. Microbiology 149:2873-2878. [DOI] [PubMed] [Google Scholar]
- 39.Umeda, A., Y. Ueki, and K. Amako. 1987. Structure of the Staphylococcus aureus cell wall determined by the freeze-substitution method. J. Bacteriol. 169:2482-2487. [DOI] [PMC free article] [PubMed] [Google Scholar]
- 40.Velegol, S. B., and B. E. Logan. 2002. Contributions of bacterial surface polymers, electrostatics, and cell elasticity to the shape of AFM force curves. Langmuir 18:5256-5262. [Google Scholar]
- 41.Velegol, S. B., S. Pardi, X. Li, D. Velegol, and B. E. Logan. 2003. AFM imaging artifacts due to bacterial cell height and AFM tip geometry. Langmuir 19:851-857. [Google Scholar]
- 42.Xu, W., B. L. Blackford, J. G. Cordes, M. H. Jericho, D. A. Pink, V. G. Levadny, and T. Beveridge. 1997. Atomic force microscope measurements of long-range forces near lipid-coated surfaces in electrolytes. Biophys. J. 27:1404-1413. [DOI] [PMC free article] [PubMed] [Google Scholar]
- 43.Yamada, S., M. Sugai, H. Komatsuzawa, S. Nakashima, T. Oshida, A. Matsumoto, and H. Suginaka. 1996. An autolysin ring associated with cell separation of Staphylococcus aureus. J. Bacteriol. 178:1565-1571. [DOI] [PMC free article] [PubMed] [Google Scholar]
- 44.Yao, X., J. Walter, S. Burke, S. Stewart, M. H. Jericho, D. Pink, R. Hunter, and T. J. Beveridge. 2002. Atomic force microscopy and theoretical considerations of surface properties and turgor pressures of bacteria. Coll. Surf. B Biointerfaces 23:213-230. [Google Scholar]