

Abstract
The epithelial-to-mesenchymal transition (EMT) is a crucial program for the invasion and metastasis of epithelial tumors that involves loss of cell–cell adhesion and increased cell mobility; however, mechanisms underlying this transition are not fully elucidated. Here, we propose a novel mechanism through which the nicotinamide adenine dinucleotide-dependent histone deacetylase SIRT1 regulates EMT in prostate cancer cells through cooperation with the EMT inducing transcription factor ZEB1. We found that forced expression of SIRT1 in non-transformed PZ-HPV-7 prostate epithelial cells disrupts the epithelial morphology concomitant with decreased expression of the epithelial marker, E-cadherin, and increased expression of mesenchymal markers. In contrast, silencing SIRT1 in metastatic prostate tumor cells restores cell–cell adhesion and induces a shift toward an epithelial morphology concomitant with increased expression of E-cadherin and decreased expression of mesenchymal markers. We also found that SIRT1 has a physiologically relevant role in endogenous EMT induced by EGF signaling in prostate cancer cells. We propose that the regulation of EMT by SIRT1 involves modulation of, and cooperation with, the EMT inducing transcription factor ZEB1. Specifically, we show that SIRT1 silencing reduces expression of ZEB1 and that SIRT1 is recruited to the E-cadherin proximal promoter by ZEB1 to deacetylate histone H3 and to reduce binding of RNA polymerase II, ultimately suppressing E-cadherin transcription. We thus identify a necessary role for ZEB1 in SIRT1-mediated EMT. Finally, we show that reduction of SIRT1 decreases prostate cancer cell migration in vitro and metastasis in vivo in immunodeficient mice, which is largely independent of any general effects of SIRT1 on prostate cancer growth and survival. We therefore identify SIRT1 as a positive regulator of EMT and metastatic growth of prostate cancer cells and our findings implicate overexpressed SIRT1 as a potential therapeutic target to reverse EMT and to prevent prostate cancer progression.
Keywords: SIRT1, EMT, prostate cancer, migration, metastasis, E-cadherin
INTRODUCTION
The mortality of cancer, including prostate cancer, in many individuals is correlated with the progression of localized primary tumors to advanced stages which ultimately metastasize to multiple organs.1,2 The epithelial to mesenchymal transition (EMT) is considered an important step in metastasis, during which non-motile, polarized epithelial cells dissolve their cell–cell junctions and convert into individual, motile mesenchymal cells.3–5 Reduction or a loss of E-cadherin is a well-established hallmark of EMT, and E-cadherin downregulation is associated with a poor clinical prognosis of many cancers.6,7 Dissecting the molecular mechanisms that regulate EMT and E-cadherin expression has thus become pivotal for understanding tumor invasiveness and metastasis.
The family of EMT-inducing transcription factors, such as ZEB1, ZEB2, Snail, and Slug, have been identified as direct repressors of E-cadherin transcription and are among the most potent inducers of EMT in a variety of physiological and pathological contexts.8,9 EMT transcription factors repress E-cadherin transcription by binding to E-box sequences in the promoter region.10,11 Previous work has shown that elevated levels of EMT transcription factors are associated with tumor invasiveness in various cancer cells, including prostate cancer cells.10–12
SIRT1 is a nicotinamide adenine dinucleotide (NAD)-dependent histone deacetylase, which has been reported to have an important role in a variety of physiological processes such as stress responses,13 metabolism,14 apoptosis,15 and calorie restriction and aging,16,17 owing to its ability to deacetylate both histone and non-histone substrates. SIRT1 regulates transcription of many genes through interactions with transcription factors.18–20 Upon recruitment to chromatin by transcription factors, SIRT1 deacetylates histones and suppresses gene transcription.21 Despite the implications of SIRT1 in the transcriptional regulation of a variety of transcription factors and physiological processes, the role of SIRT1 in regulating cancer metastasis and EMT remains unknown.
In this study, we report, for the first time, a role for SIRT1 in EMT regulation and metastasis in prostate cancer cells. We show that SIRT1 overexpression induces EMT in epithelial prostate cells, and, conversely, that SIRT1 knockdown in prostate cancer cells restores cell–cell adhesion and reverses EMT. In addition, we show that SIRT1 regulates the expression of the epithelial markers E-cadherin and γ-catenin, and the mesenchymal markers fibronectin and N-cadherin. Furthermore, we demonstrate a mechanism whereby SIRT1 regulates EMT through modulation of, and cooperation with, the EMT transcription factor ZEB1. We show not only that SIRT1 silencing reduces the expression of ZEB1, but also that SIRT1 is recruited by ZEB1 to the E-cadherin promoter to deacetylate histone H3 and to suppress E-cadherin transcription. Finally, we demonstrate that SIRT1 silencing reduces prostate cancer cell migration in vitro and metastasis in vivo in immunodeficient mice, which is largely independent of any general effects of SIRT1 on prostate cancer growth and survival. We thus identify SIRT1 as a novel positive regulator of EMT and metastasis in prostate cancer cells, and we identify a new transcriptional mechanism for regulating E-cadherin expression by the cooperation of SIRT1 with ZEB1.
RESULTS
SIRT1 represses the epithelial morphology of prostate cancer cells through its deacetylase activity
Epithelial morphology is critical for maintaining epithelial cell integrity. To study the role of SIRT1 in regulating epithelial cell morphology, we ectopically expressed SIRT1 in the prostate epithelial cell line PZ-HPV-7, taking advantage of its low SIRT1 expression and epithelial morphology (Figures 1a and b). The overexpression of SIRT1 in PZ-HPV-7 cells induced a loose cell contact and spindle-shaped morphology reminiscent of EMT, while cells transfected with an empty vector maintained the cobblestone-like morphology (Figure 1c). This result indicates that SIRT1 levels have an important role in EMT morphology regulation. SIRT1 is a histone/protein deacetylase, and many studies show that SIRT1 is involved in the regulation of various processes through its deacetylase activity.18 In order to understand whether SIRT1 deacetylase activity is required for this EMT morphology change, we transfected a catalytically inactive SIRT1 HY mutant into primary prostate PZ-HPV-7 cells. The results show that while overexpression of wild-type SIRT1 induces an EMT morphology (Figure 1c), overexpression of SIRT1 HY mutant does not produce this effect (Figure 1d). Deacetylase activity is thus required for the SIRT1-mediated EMT morphology change.
Figure 1.


SIRT1 regulates prostate epithelial morphology. (a) SIRT1 is overexpressed in prostate carcinoma cell lines. Equal amounts of proteins (10 μg) from the normal prostate epithelial cell line PZ-HPV-7, and the prostate carcinoma cell lines DU145 and PC3 cells were analyzed by immunoblot analysis with antibodies against SIRT1 and β-actin. (b) Phase-contrast images of the normal prostate epithelial cell line PZ-HPV-7 and the prostate carcinoma cell lines DU145 and PC3 cells. The sub-confluent cultures are shown to underline the morphological differences between the normal prostate cells and prostate cancer cells. (c) SIRT1 overexpression PZ-HPV-7 cell lines were established by transfecting pcDNA3.1-SIRT1 or pcDNA3.1 vector into PZ-HPV-7 cells, and stably transfected colonies were selected for 10 days in the presence of G418 and pooled. Light microscopic images show SIRT1 ectopic expression changes the morphology of normal prostate PZ-HPV-7 cells, with an epithelial to mesenchymal morphology transition (upper panels). Western blots show the ectopic expression of SIRT1 in PZ-HPV-7 cells (lower panel). (d) Catalytically inactive SIRT1 HY mutant (SIRT1 H363Y) or pcDNA3.1 vector control were transfected into PZ-HPV-7 cells, and stably transfected colonies were selected for 10 days in the presence of G418 and pooled. Light microscopic images show ectopic expression of catalytically inactive SIRT1 HY mutant (SIRT1 H363Y) does not change the morphology of normal prostate PZ-HPV-7 cells (upper panels). Western blots show the ectopic expression of SIRT1 H363Y in PZ-HPV-7 cells (lower panel). (e) SIRT1 knockdown DU145 and PC3 cell lines were established by infection of retrovirus that contain SIRT1 RNAi vector (pSUPER.retro.puro-SIRT1) or an RNAi vector control (pSUPER.retro vectors). The stably infected colonies were selected with puromycin for 10 days and the stably infected cells were pooled. Representative light microscopic images show SIRT1 knockdown (siSIRT1) induces epithelial cell morphology in DU145 and PC3 prostate cancer cell lines (upper panel). Western blots show SIRT1 expression level in SIRT1 knockdown (siSIRT1) and empty-vector-infected DU145 and PC3 cells (siVector) (lower panel). (f) SIRT1 knockdown reduces cell scattering. DU145 cells were infected with pSUPER.retro.puro-SIRT1 (siSIRT1) or the pSUPER.retro virus (siVector) and puromycin selected for 10 days. Cells were plated in 10 cm plates and allowed to form small colonies for 5 days and then categorized by observing whether colonies maintained compact, loose or scattered contact with neighboring cells. Representative light microscopic images show compact, loose and scattered colonies (upper panel). The number of each type of colony in SIRT1 knockdown (siSIRT1) and vector control (siVector) DU145 cells were counted and the data is plotted as percentage of compact, loose, and scattered colonies in each culture (lower panel). Each experiment was performed in triplicate and repeated three times. The error bars represent the s.e.m. (g) SIRT1 and E-cadherin are inversely expressed in normal prostate and carcinoma cell lines. Equal amounts of proteins (10 μg) from the normal prostate epithelial cell line PZ-HPV-7 and prostate carcinoma cell lines DU145 and PC3 cells were analyzed by immunoblot with antibodies against SIRT1, E-cadherin and β-actin. (h) Ectopic expression of SIRT1 reduces E-cadherin and increases fibronectin and N-cadherin expression. Equal amounts of proteins (10 μg) from PZ-HPV-7 cells that stably express SIRT1 (pcDNA3.1-SIRT1) or vector alone (pcDNA3.1) were analyzed by immunoblot with antibodies against SIRT1, E-cadherin, fibronectin, N-cadherin and β-actin. (i) SIRT1 knockdown upregulates E-cadherin and downregulates fibronectin and N-cadherin expression. Equal amounts of proteins (10 μg) from DU145 and PC3 cells with stable SIRT1 knockdown (siSIRT1) or vector-alone-infected DU145 cells (siVector) were analyzed by immunoblot with antibodies against SIRT1, E-cadherin, fibronectin, N-cadherin and β-actin. (j) Immunofluorescence study showing the regulation of SIRT1 on the expression and localization of EMT markers. The SIRT1 knockdown (siSIRT1) and empty-vector control (siVector) DU145 and PC3 cells were cultured in the chamber slide with DMEM + 10% FBS. Cells were fixed, immunostained with anti-E-cadherin (24E10, 1:200, 4 °C overnight), anti-γ-catenin (2309, 1:400, 4 °C overnight), anti-Fibronectin (F3648, 1:400, 4 °C overnight) and anti-N-cadherin ( H63, 1:50, 4 °C overnight ). Secondary antibodies used Alexa Fluor 488 anti-Rabbit (Invitrogen, 1:200, RT 1 h). Nuclear protein was stained with DAPI (1:10 000).
In contrast to the normal prostate cell line PZ-HPV-7, advanced prostate cancer cell lines such as PC3 and DU145 have elevated SIRT1 expression (Figure 1a), and the cells are spindle-shaped and exhibit reduced cell–cell contact (Figure 1b). We sought to determine whether SIRT1 silencing in advanced prostate cancer cells could increase cell–cell adhesion and induce an epithelial morphology. The results show that SIRT1 knockdown resulted in a dramatic shift in the cell morphology from loose cell growth to a tighter cell–cell adherence characteristic of epithelial cells (Figure 1e). In order to quantitatively measure the effect of SIRT1 knockdown on cell–cell adhesion, we performed a colony-scattering assay to determine the ability of cells to detach from colonies in culture. The SIRT1 knockdown or RNAi control cells were plated at a very low density and the morphology of colonies was analyzed 5 days after plating. Colonies were divided into three categories: compact, loose and scattered (Figure 1f). The results show that SIRT1 RNAi-infected cells formed ten times more compact colonies and three times fewer scattered colonies than control RNAi infected cells (Figure 1f). Taken together, these results suggest that SIRT1 is an important regulator of EMT morphology and cell–cell adhesion in prostate cancer cells.
SIRT1 regulates epithelial and mesenchymal protein markers
As loss of E-cadherin is a well-established hallmark of EMT,5 we sought to determine whether E-cadherin expression is altered. Interestingly, we found that SIRT1 and E-cadherin are inversely expressed at basal conditions in the normal prostate cell line PZ-HPV-7 and in the prostate cancer cell lines DU145 and PC3 (Figure 1g). To further investigate the possible regulation of E-cadherin expression by SIRT1, we ectopically expressed SIRT1 in PZ-HPV-7 cells and found that SIRT1 overexpression suppresses E-cadherin protein level (Figure 1h). A similar reciprocal relationship was observed with SIRT1 silencing in prostate cancer cells, which increased E-cadherin expression (Figure 1i). Given that reduced E-cadherin is necessary for EMT and that SIRT1 regulates E-cadherin expression, we sought to determine whether SIRT1 could also regulate the expression of mesenchymal markers, which are also important for EMT. We found that SIRT1 overexpression increased expression of the mesenchymal proteins N-cadherin and fibronectin, while SIRT1 knockdown reduced it (Figures 1h and i). Furthermore, we performed immunofluorescence to examine the localization and expression of a set of key EMT markers. The immunoflorescence results show that SIRT1 knockdown greatly increased the membrane localization and expression of the epithelial marker E-cadherin, while it decreased the membrane localization and expression of the mesenchymal marker fibronectin (Figure 1j). In addition, SIRT1 knockdown increased the expression of epithelial marker γ-catenin and decreased the expression of N-cadherin (Figure 1j), but had no effects on β-catenin and vimentin, with respect to expression and localization (data not shown). These results demonstrate that SIRT1 has a role in epithelial and mesenchymal marker expression and that E-cadherin, γ-catenin, fibronectin, and N-cadherin are major targets of SIRT1 during the regulation of EMT in prostate cancer cells.
Endogenous EMT upregulates SIRT1 expression
Finding that ecotopic expression of SIRT1 induces EMT in epithelial prostate cells while knockdown of SIRT1 reverses EMT in metastatic prostate cancer cells, we sought to determine whether SIRT1 is involved in endogenously induced EMT. Previous studies show that a variety of signal transduction pathways can induce EMT including EGF, FGF, IGF and TGFβ.22 We therefore treated PZ-HPV-7 epithelial prostate cells with various growth factors to identify which signal transduction pathways could induce EMT in this cell line. Our results show that EGF dramatically induced EMT morphology of PZ-HPV-7 cells (Figure 2a) while downregulating the expression of the epithelial marker E-cadherin and upregulating the expression of mesenchymal marker fibronectin (Figure 2b). Most importantly, in this manipulated model of EMT by the EGF signaling pathway, immunoblot analysis shows that SIRT1 is greatly upregulated (Figure 2b). This result reveals a physiologically relevant role of SIRT1 in endogenously induced EMT.
Figure 2.
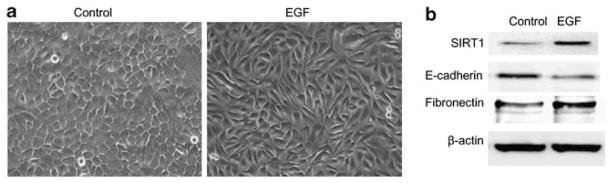
SIRT1 is upregulated in endogenous EMT induced by EGF. The PZ-HPV-7 cells were cultured in keratinocyte serum-free medium (KSFM) plus additives for 24 h. The culture medium was changed with KSFM for 4 h, then the cells were treated without (control) or with EGF (50 ng/ml) for 48 h. (a) Light microscopic images show EGF treatment induces EMT morphology of normal prostate PZ-HPV-7 cells. (b) Western blots show SIRT1 is upregulated in EGF-induced EMT, along with a downregulation of epithelial marker E-cadherin and upregulation of mesenchymal marker Fibronectin.
SIRT1 represses the activity of the E-cadherin proximal promoter in an E-box-dependent mechanism
Transcriptional repression of E-cadherin by a family of zinc-finger transcription factors, via interactions with specific E-boxes in the proximal E-cadherin promoter,8 is thought to be the most important mechanism of E-cadherin downregulation.23 To elucidate the mechanism of SIRT1-mediated E-cadherin repression during EMT, we first performed quantitative RT–PCR analysis of E-cadherin mRNA in SIRT1-knockdown and SIRT1-proficient prostate cancer cells. The results show that the number of E-cadherin transcripts was increased significantly, ~50-fold and 10-fold in SIRT1 knockdown cells over the SIRT1-proficient DU145 and PC3 cells, respectively (Figures 3a and b). To further investigate SIRT1 transcriptional regulation of E-cadherin, we used a luciferease assay whereby we transfected an E-cadherin–luciferase-reporter construct in SIRT1-knockdown and control RNAi prostate cancer cells. The results show that E-cadherin luciferase activity was increased in the SIRT1-knockdown cells relative to the control RNAi prostate cancer cells (Figure 3c). These results demonstrate that SIRT1 transcriptionally regulates E-cadherin expression in prostate cancer cells.
Figure 3.

SIRT1 regulation of E-cadherin transcription is E-box-dependent. a & b: SIRT1 silencing by SIRT1 siRNA upregulates E-cadherin mRNA levels. The mRNA levels of E-cadherin were measured by quantitative RT–PCR analysis of 5 μg RNA extracted from SIRT1 siRNA (siSIRT1) or control siRNA (siVector) DU145 (a) and PC3 cells (b). The mRNA levels of E-cadherin are expressed relative to β-actin transcripts. Each experiment was performed in triplicate and repeated three times. The error bars represent the s.e.m. (c) SIRT1 silencing by SIRT1 siRNA upregulates E-cadherin luciferase reporter activity. SIRT1 siRNA (siSIRT1) or control siRNA (siVector) DU145 cells were co-transfected with the E-cadherin-LUC reporter vector (pGL2Basic-EcadK1) and β-gal constructs, using Lipofectamine 2000 (Invitrogen, Carlsbad, CA, USA) for 48 h before measuring luciferase activity (Promega Luciferase Assay System, #E1500). Cells were harvested after 48 h and lysates were assayed for luciferase activity. (d) SIRT1 suppresses E-cadherin transcription in an E-box-dependent mechanism. DU145 cells were co-transfected with SIRT1 expression vector (pcDNA3.1-SIRT1) or vector control (pcDNA3.1) together with the E-box wild-type (pGL2Basic-EcadK1) or E-box mutant (pGL2Basic-EcadK1-Ebox2MUT) E-cadherin-LUC reporter. Cells were harvested after 48 h and lysates were assayed for luciferase activity. In experiments c & d, the relative luciferase activities are expressed in arbitrary units, and were normalized to co-transfected β-gal activity to control for transfection efficiency. Each experiment was performed in triplicates and repeated a minimum of three times. The error bars represent the s.e.m. Asterisks indicate significant differences between two groups (*P < 0.05).
As mentioned previously, a family of zinc-finger transcription factors is implicated in E-box-dependent transcriptional repression of E-cadherin in EMT.8,24 We sought to determine whether SIRT1 transcriptional repression of E-cadherin also occurs in an E-box-dependent manner by co-transfecting SIRT1 with E-box wt 25 or E-box mutated E-cadherin–luciferase reporters 26 in prostate cancer cells. Our results show that while SIRT1 inhibits the E-box wt E-cadherin promoter, SIRT1 has a reduced effect on the mutant E-box E-cadherin promoter (Figure 3d). SIRT1 repression of E-cadherin transcription in an E-box-dependent manner indicates that SIRT1 may act in conjunction with other zinc finger transcription factors.
Previous reports demonstrate that the aberrant expression of EMT transcription factors contributes to the onset of an invasive phenotype by suppressing E-cadherin and inducing EMT in a wide variety of human cancers.8,24 In order to determine whether SIRT1 transcriptional repression of E-cadherin in EMT may occur through the regulation of these EMT transcription factors, we performed qRT–PCR to determine whether changes in SIRT1 levels would affect the expression of these transcription factors. Our results show that SIRT1 silencing by RNAi reduces the expression of ZEB1, ZEB2, Snail and Slug in DU145 and PC3 cells (Figure 4) but has no effect on Twist and E47 (data not shown). On the basis of these results, we propose that the EMT-inducing transcription factors ZEB1, ZEB2, Snail and Slug may have a role in SIRT1-mediated E-cadherin transcriptional repression during EMT.
Figure 4.

SIRT1 silencing by siRNA reduces EMT-inducing transcription factor expression. The mRNA levels of EMT-inducing transcription factors including ZEB1, ZEB2, Snail and Slug were measured by quantitative RT–PCR analysis of 5 μg RNA extracted from DU145 and PC3 cells with stable knockdown of SIRT1 (siSIRT1) or RNAi vector control-infected cells (siVector). The mRNA levels of ZEB1, ZEB2, Snail and Slug are expressed relative to β-actin transcripts. Each experiment was performed in triplicate and repeated three times. The error bars represent the s.e.m. Asterisks indicate significant differences between two groups (*P < 0.05).
SIRT1 is recruited to the E-cadherin promoter by ZEB1
Finding that SIRT1 regulates E-cadherin transcription in an E-box-dependent manner and that the SIRT1 expression level parallels that of EMT transcription factors, we sought to determine whether SIRT1 and these EMT transcription factors have a cooperative effect at the E-cadherin promoter. We first performed a co-immunoprecipitation experiment to observe the interaction of SIRT1 with EMT transcription factors. Our results show that SIRT1 was able to complex with ZEB1 (Figure 5a) but not Snail, Slug or ZEB2 (data not shown), which may indicate the formation of a complex of SIRT1 with ZEB1 at the E-cadherin promoter to influence transcription. We thus performed a chromatin immunoprecipitation (ChIP) assay to determine whether SIRT1 and ZEB1 could be co-binding in the E-box region of the E-cadherin promoter.27 The results show that both SIRT1 and ZEB1 bind in the same DNA fragment of the E-cadherin promoter (Figure 5b). Next, we wanted to determine whether SIRT1 occupancy at the E-cadherin promoter requires ZEB1. We transfected DU145 cells with or without ZEB1 RNAi and performed a ChIP assay using anti-SIRT1 and anti-ZEB1 antibodies. We found that knockdown of ZEB1 not only decreased binding of ZEB1 to E-cadherin promoter, as expected, but also inhibited binding of SIRT1 (Figure 5c). Because of the well-established mechanism of SIRT1 transcriptional regulation via HDAC activity, we wanted to determine whether SIRT1 transcriptional repression at the E-cadherin promoter involved histone deactylation. We performed a parallel ChIP assay examining acetylated H3K9, a target of SIRT1, and RNA Polymerase (Pol II), a marker of active transcription in response to ZEB1 and SIRT1 binding to the promoter. We found that acetylated H3K9 and Pol II levels were inversely related to the occupancy of SIRT1 and ZEB1 (Figure 5c), and that the knockdown of ZEB1 increased E-cadherin expression in prostate cancer cells (Figure 5c). Our results demonstrate a cooperation between SIRT1 and ZEB1 at the E-cadherin promoter that leads to the deacetylation of histone H3 and reduced binding of Pol II, thereby suppressing E-cadherin transcription.
Figure 5.

SIRT1 is recruited by ZEB1 to the E-cadherin promoter to deacetylate histone H3 and suppress E-cadherin transcription. (a) SIRT1 interacts with ZEB1. DU145 cell lysates were immunoprecipitated with anti-SIRT1 antibody and the coimmunoprecipitated ZEB1 was detected by immunoblot with anti-ZEB1 antibody. (b) ChIP assays of SIRT1 and ZEB1 in the endogenous E-cadherin promoter. Cross-linked chromatin was extracted from DU145 cells, anti-SIRT1, anti-ZEB1 or IgG control was used for ChIP, and PCR was performed with primers that amplified the E-cadherin promoter region. The amplified fragments of the E-cadherin promoter detected in the input and in the immunoprecipitated fractions and in the IgG control are shown. (c) The effects of ZEB1 knockdown on SIRT1, H3K9Ac and Pol II enrichment at the E-cadherin promoter. DU145 cells were transfected with ZEB1 siRNA (Sc-38643) or scrambled sequence for 72 h and then ChIP assays were performed. Cross-linked chromatin was extracted from both ZEB1 knockdown (siZEB1) or scrambled sequence transfected (siControl) DU145 cells, the chromatin immunoprecipitation was performed with anti-ZEB1, anti-SIRT1, anti-AcH3K9, anti-pol II antibodies, or IgG control. The PCR was performed with primers that amplified the E-cadherin promoter region and the amplified fragments of the E-cadherin promoter are shown (upper panel). ZEB1 knockdown efficiency and E-cadherin upregulation by ZEB1 knockdown were confirmed by immunoblot with anti-ZEB1, anti-E-cadherin and β-actin antibodies (lower panel). The ChIP experiments were performed in triplicate and repeated three times. (d) ZEB1 knockdown blocks SIRT1-overexpression-induced EMT. PZ-HPV-7 cells with ecotopic SIRT1 expression were transfected with ZEB1 siRNA (Sc-38643) or scrambled sequence for 72 h; light microscopic images show ZEB1 knockdown reverses SIRT1 overexpression-induced EMT morphology in PZ-HPV-7 cells. (e) ZEB1 overexpression reverses the epithelial morphology induced by SIRT1 knockdown. SIRT1 knockdown DU145 cells were transfected with pcDNA3.1-Neo-ZEB1 vector and stably transfected colonies were G418 selected for 14 days and pooled. Light microscopic images show ZEB1 overexpression reverses SIRT1 knockdown-induced epithelial morphology in DU145 cells.
To further characterize the interaction between SIRT1 and ZEB1, we performed an experiment to test whether knocking down ZEB1 could prevent SIRT1-induced EMT in PZ-HPV-7 cells, and we found that ZEB1 knockdown results in a reversal of EMT morphology induced by SIRT1 overexpression (Figure 5d). Conversely, we transfected a ZEB1 expression vector into DU145 cells to determine whether ZEB1 overexpression could reverse the epithelial morphology induced by SIRT1 knockdown. The result shows that overexpression of ZEB1 greatly inhibited the reversal of EMT morphology due to SIRT1 knockdown (Figure 5e). Taken together, these results reveal a key biological role of ZEB1 in SIRT1-mediated EMT.
SIRT1 silencing or inhibition reduces prostate cancer cell migration in vitro and in vivo
In order to study the role of SIRT1 in prostate cancer cell migration and metastasis, we first examined the effect of SIRT1 silencing on cell migration using polycarbonate membrane inserts coated with Collagen I assay system. When SIRT1 was silenced, there was a marked attenuation of prostate cancer cell migration of both PC3 cells and DU145 cells (Figure 6a). Similarly, when prostate cancer cells were treated with the pharmacological SIRT1 inhibitor, Sirtinol, the treated cells exhibited decreased migration as compared with the control PC3 and DU145 cells (Figure 6b). These findings demonstrate that SIRT1 reduction or pharmacological inhibition can significantly reduce prostate cancer cell migration in vitro.
Figure 6.

SIRT1 silencing by siRNA or pharmacological inhibition reduces cell migration in vitro and reduces PC3 metastasis in vivo. 1 × 10⁵ of SIRT1 siRNA (siSIRT1) and control siRNA (siVector) DU145 and PC3 cells (a) or SIRT1 inhibitor Sirtinol (25 μM) treated DU145 and PC3 (b) cells were loaded into chamber inserts containing an 8-μm pore size membrane coated with Collagen I. The migrated cells were stained after 24 h incubation at 37 °C and the migrated cells were calculated based on the cell density read at 560 nm. Each experiment was performed in triplicate and repeated a minimum of three times. The error bars represent the s.e.m. Asterisks indicate significant differences between two groups (*P < 0.01). (c) Representative fluorescent and light microscopic images show the expression efficiency of TomatoRed in SIRT1 siRNA and control siRNA PC3 cells. The TomatoRed-tagged PC3 SIRT1 knockdown (PC3siSIRT1) or PC3 vector control cells (PC3siVector) cells were established by infection with the pHAGE2 lentivirus that is produced by co-transfection of 293T packaging cell line with the TomatoRed vector EF1a-m-tomato-w and lentivirus helper plasmids including VSV-G, gag/pol, Rev, and Tat (Vector Core - Center for Regenerative Medicine Boston University). (d) Representative fluorescent imaging of nude mice injected with PC3 cells stably expressing control siRNA and SIRT1 siRNA on day 21 after inoculation. The fluorescence imaging data is displayed as the photon flux (p/s). (e) Quantification of fluorescence imaging data acquired at day 1, 7, 14 and 21. The data is displayed as the photon flux (p/s) and was presented as the mean ± s.e.m. (n = 4).
To extend these studies to an animal model, we studied the metastasis of PC3 human prostate cancer cells in immunodeficient nude mice by comparing the metastatic ability of SIRT1 siRNA and control siRNA-treated PC3 cells. In this in vivo study, PC3 tumor cells expressing the TomatoRed fluorescence reporter gene were injected into immunodeficient mice through the tail vein (Figure 6c). Fluorescence-based noninvasive imaging was used to monitor the metastasis of PC3 cells. The results show that SIRT1 knockdown led to a dramatic reduction of lung metastasis compared with control siRNA cells (Figures 6d and e). The quantification of fluorescent photons shows there is an attenuation of fluorescent signal at day 7 for both SIRT1 siRNA- and control siRNA-PC3 cells compared with day 1 (Figure 6e), indicating that cells that failed to metastasize were not able to survive. Progressively increasing signals were detected in mice with control siRNA- rather than SIRT1 siRNA-tumor cells from days 7 to 21, indicating that control siRNA-cells had succeeded in metastasizing and proliferating whereas the SIRT1 siRNAi-cells that failed to metastasize died (Figure 6e). This data suggests that the reduction of SIRT1 expression inhibits prostate cancer metastasis in this tail vein mouse model of metastasis.
Some studies suggest that the tail vein injection model can detect both the cell metastasis through the vessel wall (extravasation) and the ability of cells to grow and survive in the lung.28 In order to separate the effects of SIRT1 silencing on metastatic potential from the effects on general growth and survival of cells in the tail vein model, we examined the effect of SIRT1 knockdown on prostate cancer cell growth in vitro and in vivo in an immunodeficient mouse model. The in vitro (MTS) [(3-(4,5-dimethylthiazol-2-yl)-5-(3-carbox-ymethoxyphenyl)-2-(4-sulfophenyl)-2H-tetrazolium] cell survival analysis shows that SIRT1 knockdown represses 20% of PC3 cell growth compared with vector-infected cells and has little effect on DU145 cell growth (Figure 7a). Furthermore, we injected PC3 cells into nude mice subcutaneously to study the effects of SIRT1 knockdown on tumor formation and growth. We found there was no significant difference in tumor formation or tumor growth between SIRT1 wild-type and SIRT1 knockdown PC3 cells (Figure 7b). These results demonstrate that SIRT1-mediated migration and invasion (extravasation), rather than general effects of SIRT1 on growth and survival, have a role in suppression of metastasis in SIRT1 knockdown prostate cancer cells in the tail vein mouse model.
Figure 7.

Effects of SIRT1 knockdown on prostate cancer cell growth and survival in vitro and in vivo. (a) 1 × 10⁴ cells of PC3 and DU145 in which SIRT1 had been knocked down by siRNA expression (siSIRT1) or empty-vector-transfected cells (siVector) were seeded in 96-well plates. Viable cells were quantified at 48 h by MTS cell survival assay. The error bars represent the s.e.m. (b) PC3 SIRT1 knockdown and control cells were injected in the dorsal flanks of nude mice (2 × 10⁶ in 100ul serum-free medium with matrigel, n = 4). Tumors were measured weekly and the graph indicates the tumor volumes generated by the control vs the SIRT1 knockdown cell line.
DISCUSSION
SIRT1 is a class III histone deacetylase capable of deacetylating both histone and non-histone substrates.18,29 Although SIRT1 has been shown to have multiple functions, a role of SIRT1 in EMT and metastasis remains unclear. In this study, we show for the first time that SIRT1 is a critical positive regulator of EMT and cell migration in vitro and in tumor metastasis in vivo in immunodeficient mice. We show that SIRT1 deacetylase activity is required for the regulation of EMT, and we propose a molecular mechanism whereby SIRT1 regulates cell migration by modulation of and cooperation with the EMT-inducing transcription factor ZEB1 to suppress E-cadherin expression. We also demonstrate a critical role for ZEB1 in SIRT1-mediated EMT. We examined the effects of SIRT1 knockdown on tumor growth in a subcutaneous xenograft model, and also analyzed cell extravasation through the vessel wall and metastatic growth in the lung by using a tail vein mouse model. However, it should be noted that the intravenous injection bypassed several initial steps of metastasis. Our results show that SIRT1 silencing reduces prostate cancer cell migration and metastasis, which is largely independent of any general effects of SIRT1 on prostate cancer growth and survival. Given that EMT represents the critical event in the transition from early to invasive carcinomas 2,30 and that E-cadherin downregulation is associated with poor prognosis and lower survival in prostate cancer,6,7,31 our finding that SIRT1 is involved in the regulation of prostate cancer progression and metastasis is clinically relevant. Recently, SIRT1 has been shown to increase angiogenesis 32 and to deacetylate cortactin to regulate cell migration.33 In addition, SIRT1 has been shown to be an important target of miR-200 in regulating breast cancer cell migration.34,35 Moreover, high levels of SIRT1 are found in various cancers, including prostate cancer,36,37 and high SIRT1 expression levels are associated with poor prognosis in gastric carcinomas, B-cell lymphoma, breast cancer and lung cancer.38–41 Our data builds upon these other studies as we further elucidate SIRT1 as a critical regulator of cancer progression, and an important target for cancer treatment.
The molecular mechanism by which SIRT1 regulates prostate cancer cell EMT and migration involves the suppression of E-cadherin expression via its regulation of, and cooperation with, the EMT transcription factor ZEB1. We propose that the EMT-inducing transcription factor ZEB1 is required for SIRT1 recruitment to the E-cadherin promoter, and this recruitment leads to the deacetylation of histone H3, reduced Pol II binding, and ultimately the suppression of E-cadherin transcription. Our results provide a strong indication that SIRT1 functions as a corepressor with ZEB1 to suppress E-cadherin transcription. In addition, our finding of SIRT1-occupancy-dependent changes on the acetylation of histone H3K9, a known target of SIRT1, at the E-cadherin promoter strongly suggests H3 as a direct target of SIRT1. We also propose that SIRT1 may cooperate with ZEB1 to regulate mesenchymal protein expression, as fibronectin and N-cadherin are thought to be important targets of ZEB1 in prostate cancer cells.12 Taken together, our findings elucidate a cooperative role of SIRT1 and ZEB1 in the suppression of E-cadherin transcription and in the upregulation of mesenchymal markers during EMT in prostate cancer.
In addition to ZEB1, other members of this zinc finger transcription factor family including Snail, Slug and ZEB2 have been identified as direct repressors of E-cadherin transcription and central mediators of EMT.8,24 In our study, we could not detect a physical interaction between SIRT1 and ZEB2, Snail, or Slug in co-IP experiments, despite showing a strong interaction with ZEB1. This result suggests that SIRT1 and ZEB1 interact specifically, but we cannot not exclude the possibility that SIRT1 interacts with these other EMT transcription factors in a cell type- or cell-context-dependent manner; for example, ZEB1 and ZEB2 belong to the same family and can both bind to the E-cadherin promoter, but they also can function individually in a cell-type and tissue-specific manner.42
SIRT1 appears to regulate E-cadherin expression and EMT through direct cooperation with ZEB1 at the E-cadherin promoter, but our data also demonstrated that SIRT1 knockdown down-regulates expression of other EMT transcription factors including ZEB1, ZEB2, Snail and Slug (Figure 4). In order to determine whether these EMT transcription factors have any causal role in SIRT1-mediated EMT, we overexpressed ZEB1, ZEB2, Snail and Slug individually in SIRT1-knockdown DU145 cells to determine whether their expression could reverse the epithelial morphology induced by SIRT1 knockdown. Our results show that, in addition to ZEB1 (Figures 5d and e), Snail overexpression can also partially reverse SIRT1 knockdown-mediated epithelial morphology (data not shown), suggesting a functional consequence of SIRT1 regulation of Snail expression. However, we did not detect any effects of ZEB2 or Slug reconstitution on the morphology of the cells (data not shown). Nonetheless, we still cannot completely exclude ZEB2 or Slug from having a role in SIRT1-mediated EMT, under specific culture conditions and cell contexts not studied here, given that the expression levels of ZEB2 and Slug are consistently downregulated by SIRT1 silencing. The mechanism of how SIRT1 might regulate the expression of these EMT-inducing transcription factors warrants further investigation.
Overall, our study demonstrates that SIRT1 is a positive regulator of EMT and prostate tumor metastasis, specifically through transcriptional repression of E-cadherin via cooperation with ZEB1. SIRT1 is thus an attractive therapeutic target for reversing EMT and tumor metastasis, both key events in prostate cancer progression that lead to mortality.
MATERIALS AND METHODS
Cells, plasmids and antibodies
PC3 and DU145 prostate cancer cell lines were maintained in 1 × DMEM plus 10% FBS. PZ-HPV-7 cells were maintained in keratinocyte serum-free medium (K-SFM) with required supplements (Invitrogen, Grand Island, NY, USA, 17005–042). All cells were obtained from the American Type Culture Collection (Manassas, Virginia).
The human SIRT1 expression vector pcDNA3.1-SIRT1, SIRT1 H363Y and the SIRT1 RNAi vectors (pSUPER.retro.puro-SIRT1 and pSUPER.retro.neo-SIRT1) were generated or acquired as previously described.43 The reporter plasmids E-cadherin-LUC (pGL2Basic-EcadK1) or E-cadherin-LUC with E-box mutants (pGL2Basic-EcadK1-Ebox2MUT), and Snail and Slug expression constructs (pBabepuroSnail and pPGS-hSLUG.fl.flag) were purchased from Addgene (Cambridge, MA, USA). The pcDNA3.1-Neo-ZEB1 plasmid was generated by subcloning a Sal I (blunted)/XbaI fragment from pTRE-6Myc-ATGhZEB1 (ref. [44]) into the HindIII/xba1-cut pcDNA3.1 vector.
SIRT1 antibody (07–131) and acetyl-histone H3 (06–599) were purchased from Millipore (Billerica, MA, USA). E-cadherin (K20), Pol II (H224) and N-cadherin (H63) antibodies were purchased from Santa Cruz Biotechnology (Santa Cruz, CA, USA). Fibronectin (F3648) and β-actin (A-1978) were purchased from Sigma Aldrich (St Louis, MO, USA). E-cadherin (24E10), γ-catenin (2309) and ZEB1 (D80D3) antibodies were purchased from Cell Signaling Technology (Danvers, MA, USA).
Immunofluorescence assay
Cells (103–104) were seeded in a Chamber Slide and incubated for 24 h. Cells were fixed with 4% paraformaldehyde, treated with 0.1% Sodium Citrate + 0.1% Triton-X 100 and with Image-iT FX Signal Enhancer (Invitrogen). Cells were blocked with 3% BSA, treated with primary antibodies, then incubated with Alexa Fluor secondary antibodies (Invitrogen) and stained with DAPI.
Real-time RT–PCR
The method was used as previously described.45 The primers used were: E-cadherin forward: 5′-TGCTGCAGGTCTCCTCTTGG-3′; E-cadherin reverse: 5′-AGTCCCAGGCGTAGACCAAG-3′; β-actin forward: 5′-AAGGCCAACCGCGAGAAGAT-3′; β-actin reverse: 5′-CACAGCCTGGATAGCAACGTACA-3′; Snail forward: 5′-GACTACCGCTGCTCCATTCCA-3′; Snail reverse: 5′-TCCTCTTCATCACTAATGGGGCTTT-3′; Slug forward: 5′-CCATTCCACGCCCAGCTA-3′; Slug reverse: 5′-GGACTCACTCGCCCCAAA-3′; ZEB1 forward: 5′-GAAAATGAGCAAAACCATGATCCTA-3′; ZEB1 reverse: 5′-CAGGTGCCTCAGGAAAAATGA-3′; ZEB2 forward: 5′-TTCCATTGCTGTGGGCCTT-3′; ZEB2 reverse: 5′-TTGTGGGAGGGTTACTGTTGG-3′.
Cell colony scattering assay
This protocol was adapted from Shtutman et al.46 Briefly, cells were plated in 10 cm plates and allowed to form small colonies for 5 days. Cells were categorized by observing whether colonies maintained compact (>90% of cells in the colony have cell–cell contact), loose (50–90% cell contact), or scattered (<50% cell contact) contact with neighboring cells. Each experiment was performed in triplicate and repeated three times.
Cell migration assay
The cell migration assay was performed using the CytoSelect Haptotaxis Assay (Cell Biolabs, Inc, San Diego, CA, USA), according to the manufacturer’s instructions. PC3 or DU145 cells were resuspended at 5 × 10⁵/ml, and 1 × 10⁵ cells were loaded into chamber inserts. Cells were incubated at 37 °C for 24 h, after which the migrated cells in the inserts were washed, stained and extracted. A sample of 150 μl was transferred to a 96-well plate and the migrated cell density was acquired at optical density 560 nm. Each experiment was performed in triplicate and repeated three times.
Chromatin immunoprecipitation
ChIP assays were performed as previously described,45 with modifications. Briefly, 2 × 10⁷ cells were cross-linked and lysed, followed by sonication (Fisher Scientific Sonic Dismembrator, Pittsburgh, PA, USA, Model 550). The immunoprecipitation was performed for overnight at 4 °C with specific antibodies, or irrelevant control antibody. The protein A/G-Sepharose was added for two hours at 4 °C for immunoprecipitation. For PCR, a 2-μl aliquot of the total 50 μl of extracted DNA was amplified in 21–25 PCR cycles for gel analysis. Primers for PCR analysis for ChIP of a proximal fragment of the human E-cadherin promoter (−86 to +60) that contain ZEB1 binding sites were: 5′-GGCCGGCAGGTGAAC-3′ (forward) and 5′-GGGCTGGAGTCTGAACTGAC-3′ (reverse).11,47 Triplicate PCR reactions for each sample were preformed and each ChIP assay was performed in at least three independent experiments.
In vivo experiments
The mouse work was performed in the Animal Core Facilities of the Boston University School of Medicine after approval by the Institutional Animal Care and Use Committee (IACUC).
Tail vein injection
Briefly, 1 × 10⁶ TomatoRed-tagged PC3 SIRT1 knockdown or PC3 vector control cells in 200-ul serum-free DMEM were injected into the tail vein of 6-week-old male nude mice (Charles River, MA, USA). Each group contained 4 mice, which were imaged for fluorescence intensity using the IVIS Spectrum System 200 Series weekly for 3 weeks starting day 1 after tumor cell implantation (Caliper Life Sciences, Hopkinton, MA, USA). Imaging acquisition and processing was accomplished using the Living Image software. The ability of metastatic growth between PC3-siVector and PC3-siSIRT1 cell groups were compared. The fluorescence image data is displayed as the photon flux (p/s).
Subcutaneous injection
PC3 SIRT1 knockdown or PC3 vector control cells (2 × 10⁶) were diluted in 100 μl serum-free medium containing Matrigel (BD Biosciences, Bedford, MA, USA). Cells were injected s.c. into the right flank of nude/nude male mice (The Charles River). The mice were observed every 3 days for the presence of tumors and the tumors were measured weekly with calipers. Each group contained four mice.
Acknowledgments
We thank Dr F Picard (Laval University, Canada), Dr Michael Korn (USCF, CA), Dr M Ott (UCSF, CA) for providing plasmid constructs. We greatly thank the technical support in tumor cell s.c. injection from Dr Zhijun Luo (Boston University School of Medicine). We thank Lora Forman for the technical assistant (Boston University) and Christine Chiao (Boston University) for the proofreading of this manuscript. This work was supported by grants from the National Cancer Institute (1R21CA141036) (YD), the Clinical and Translational Science Institute award of NIH (UL1RR025771) (YD), the National Cancer Institute (CA101992) (DVF), the Karin Grunebaum Cancer Research Foundation (YD and DVF), the American Cancer Society (IRG-72-001-27-IRG) (YD), and the Department of Medicine Pilot Project Grant Award (YD).
Footnotes
CONFLICT OF INTEREST
The authors declare no conflict of interest.
References
- 1.Mimeault M, Batra SK. Recent advances on multiple tumorigenic cascades involved in prostatic cancer progression and targeting therapies. Carcinogenesis. 2006;27:1–22. doi: 10.1093/carcin/bgi229. [DOI] [PubMed] [Google Scholar]
- 2.Thiery JP. Epithelial-mesenchymal transitions in development and pathologies. Curr Opin Cell Biol. 2003;15:740–746. doi: 10.1016/j.ceb.2003.10.006. [DOI] [PubMed] [Google Scholar]
- 3.Thiery JP, Sleeman JP. Complex networks orchestrate epithelial-mesenchymal transitions. Nat Rev Mol Cell Biol. 2006;7:131–142. doi: 10.1038/nrm1835. [DOI] [PubMed] [Google Scholar]
- 4.Savagner P. Leaving the neighborhood: molecular mechanisms involved during epithelial-mesenchymal transition. Bioessays. 2001;23:912–923. doi: 10.1002/bies.1132. [DOI] [PubMed] [Google Scholar]
- 5.Voulgari A, Pintzas A. Epithelial-mesenchymal transition in cancer metastasis: mechanisms, markers and strategies to overcome drug resistance in the clinic. Biochim Biophys Acta. 2009;1796:75–90. doi: 10.1016/j.bbcan.2009.03.002. [DOI] [PubMed] [Google Scholar]
- 6.Ross JS, Figge HL, Bui HX, del Rosario AD, Fisher HA, Nazeer T, et al. E-cadherin expression in prostatic carcinoma biopsies: correlation with tumor grade, DNA content, pathologic stage, and clinical outcome. Mod Pathol. 1994;7:835–841. [PubMed] [Google Scholar]
- 7.Richmond PJ, Karayiannakis AJ, Nagafuchi A, Kaisary AV, Pignatelli M. Aberrant E-cadherin and alpha-catenin expression in prostate cancer: correlation with patient survival. Cancer Res. 1997;57:3189–3193. [PubMed] [Google Scholar]
- 8.Peinado H, Portillo F, Cano A. Transcriptional regulation of cadherins during development and carcinogenesis. Int J Dev Biol. 2004;48:365–375. doi: 10.1387/ijdb.041794hp. [DOI] [PubMed] [Google Scholar]
- 9.Wallerand H, Robert G, Pasticier G, Ravaud A, Ballanger P, Reiter RE, et al. The epithelial-mesenchymal transition-inducing factor TWIST is an attractive target in advanced and/or metastatic bladder and prostate cancers() Urol Oncol. 2010;28:473–479. doi: 10.1016/j.urolonc.2008.12.018. [DOI] [PubMed] [Google Scholar]
- 10.Vandewalle C, Van Roy F, Berx G. The role of the ZEB family of transcription factors in development and disease. Cell Mol Life Sci. 2009;66:773–787. doi: 10.1007/s00018-008-8465-8. [DOI] [PMC free article] [PubMed] [Google Scholar]
- 11.Sanchez-Tillo E, Lazaro A, Torrent RM, Vaquero EC, Castells A, et al. ZEB1 represses E-cadherin and induces an EMT by recruiting the SWI/SNF chromatin-remodeling protein BRG1. Oncogene. 2010;29:3490–3500. doi: 10.1038/onc.2010.102. [DOI] [PubMed] [Google Scholar]
- 12.Graham TR, Zhau HE, Odero-Marah VA, Osunkoya AO, Kimbro KS, Tighiouart M, et al. Insulin-like growth factor-I-dependent up-regulation of ZEB1 drives epithelial-to-mesenchymal transition in human prostate cancer cells. Cancer Res. 2008;68:2479–2488. doi: 10.1158/0008-5472.CAN-07-2559. [DOI] [PubMed] [Google Scholar]
- 13.Smith J. Human Sir2 and the ‘silencing’ of p53 activity. Trends Cell Biol. 2002;12:404–406. doi: 10.1016/s0962-8924(02)02342-5. [DOI] [PubMed] [Google Scholar]
- 14.Bordone L, Guarente L. Calorie restriction, SIRT1 and metabolism: understanding longevity. Nat Rev Mol Cell Biol. 2005;6:298–305. doi: 10.1038/nrm1616. [DOI] [PubMed] [Google Scholar]
- 15.Giannakou ME, Partridge L. The interaction between FOXO and SIRT1: tipping the balance towards survival. Trends Cell Biol. 2004;14:408–412. doi: 10.1016/j.tcb.2004.07.006. [DOI] [PubMed] [Google Scholar]
- 16.Guarente L. Sirtuins in aging and disease. Cold Spring Harb Symp Quant Biol. 2007;72:483–488. doi: 10.1101/sqb.2007.72.024. [DOI] [PubMed] [Google Scholar]
- 17.Guarente L, Picard F. Calorie restriction–the SIR2 connection. Cell. 2005;120:473–482. doi: 10.1016/j.cell.2005.01.029. [DOI] [PubMed] [Google Scholar]
- 18.Liu T, Liu PY, Marshall GM. The critical role of the class III histone deacetylase SIRT1 in cancer. Cancer Res. 2009;69:1702–1705. doi: 10.1158/0008-5472.CAN-08-3365. [DOI] [PubMed] [Google Scholar]
- 19.Saunders LR, Verdin E. Sirtuins: critical regulators at the crossroads between cancer and aging. Oncogene. 2007;26:5489–5504. doi: 10.1038/sj.onc.1210616. [DOI] [PubMed] [Google Scholar]
- 20.Yamamoto H, Schoonjans K, Auwerx J. Sirtuin functions in health and disease. Mol Endocrinol. 2007;21:1745–1755. doi: 10.1210/me.2007-0079. [DOI] [PubMed] [Google Scholar]
- 21.Dai Y, Faller DV. Transcription Regulation by Class III Histone Deacetylases (HDACs)—Sirtuins. Transl Oncogenomics. 2008;3:137–149. doi: 10.4137/tog.s483. [DOI] [PMC free article] [PubMed] [Google Scholar]
- 22.Larue L, Bellacosa A. Epithelial-mesenchymal transition in development and cancer: role of phosphatidylinositol 3′ kinase/AKT pathways. Oncogene. 2005;24:7443–7454. doi: 10.1038/sj.onc.1209091. [DOI] [PubMed] [Google Scholar]
- 23.Peinado H, Olmeda D, Cano A. Snail, Zeb and bHLH factors in tumour progression: an alliance against the epithelial phenotype? Nat Rev Cancer. 2007;7:415–428. doi: 10.1038/nrc2131. [DOI] [PubMed] [Google Scholar]
- 24.Moreno-Bueno G, Portillo F, Cano A. Transcriptional regulation of cell polarity in EMT and cancer. Oncogene. 2008;27:6958–6969. doi: 10.1038/onc.2008.346. [DOI] [PubMed] [Google Scholar]
- 25.Hajra KM, Ji X, Fearon ER. Extinction of E-cadherin expression in breast cancer via a dominant repression pathway acting on proximal promoter elements. Oncogene. 1999;18:7274–7279. doi: 10.1038/sj.onc.1203336. [DOI] [PubMed] [Google Scholar]
- 26.Hajra KM, Chen DY, Fearon ER. The SLUG zinc-finger protein represses E-cadherin in breast cancer. Cancer Res. 2002;62:1613–1618. [PubMed] [Google Scholar]
- 27.Eger A, Aigner K, Sonderegger S, Dampier B, Oehler S, Schreiber M, et al. DeltaEF1 is a transcriptional repressor of E-cadherin and regulates epithelial plasticity in breast cancer cells. Oncogene. 2005;24:2375–2385. doi: 10.1038/sj.onc.1208429. [DOI] [PubMed] [Google Scholar]
- 28.Michael E, Israel V. Tail vein assay of cancer metastasis. Curr Protoc Cell Biol. 2001:19.2.1–19.2.7. doi: 10.1002/0471143030.cb1902s12. [DOI] [PubMed] [Google Scholar]
- 29.Kim EJ, Um SJ. SIRT1: roles in aging and cancer. BMB Rep. 2008;41:751–756. doi: 10.5483/bmbrep.2008.41.11.751. [DOI] [PubMed] [Google Scholar]
- 30.Baum B, Settleman J, Quinlan MP. Transitions between epithelial and mesenchymal states in development and disease. Semin Cell Dev Biol. 2008;19:294–308. doi: 10.1016/j.semcdb.2008.02.001. [DOI] [PubMed] [Google Scholar]
- 31.Umbas R, Schalken JA, Aalders TW, Carter BS, Karthaus HFM, Schaafsma HE, et al. Expression of the cellular adhesion molecule E-cadherin is reduced or absent in high-grade prostate cancer. Cancer Res. 1992;52:5104–5109. [PubMed] [Google Scholar]
- 32.Potente M, Ghaeni L, Baldessari D, Mostoslavsky R, Rossig L, Dequiedt F, et al. SIRT1 controls endothelial angiogenic functions during vascular growth. Genes Dev. 2007;21:2644–2658. doi: 10.1101/gad.435107. [DOI] [PMC free article] [PubMed] [Google Scholar]
- 33.Zhang Y, Zhang M, Dong H, Yong S, Li X, Olashaw N, et al. Deacetylation of cortactin by SIRT1 promotes cell migration. Oncogene. 2009;28:445–460. doi: 10.1038/onc.2008.388. [DOI] [PubMed] [Google Scholar]
- 34.Eades G, Yao Y, Yang M, Zhang Y, Chumsri S, Zhou Q. MiR-200a regulates SIRT1 and EMT-like transformation in mammary epithelial cells. J Biol Chem. 2011;286:25992–26002. doi: 10.1074/jbc.M111.229401. [DOI] [PMC free article] [PubMed] [Google Scholar]
- 35.Tryndyak VP, Beland FA, Pogribny IP. E-cadherin transcriptional down-regulation by epigenetic and microRNA-200 family alterations is related to mesenchymal and drug-resistant phenotypes in human breast cancer cells. Int J Cancer. 2010;126:2575–2583. doi: 10.1002/ijc.24972. [DOI] [PubMed] [Google Scholar]
- 36.Huffman DM, Grizzle WE, Bamman MM, Kim JS, Eltoum IA, Elgavish A, et al. SIRT1 is significantly elevated in mouse and human prostate cancer. Cancer Res. 2007;67:6612–6618. doi: 10.1158/0008-5472.CAN-07-0085. [DOI] [PubMed] [Google Scholar]
- 37.Kwon HS, Ott M. The ups and downs of SIRT1. Trends Biochem Sci. 2008;33:517–525. doi: 10.1016/j.tibs.2008.08.001. [DOI] [PubMed] [Google Scholar]
- 38.Cha EJ, Noh SJ, Kwon KS, Kim CY, Park BH, Park HS, et al. Expression of DBC1 and SIRT1 is associated with poor prognosis of gastric carcinoma. Clin Cancer Res. 2009;15:4453–4459. doi: 10.1158/1078-0432.CCR-08-3329. [DOI] [PubMed] [Google Scholar]
- 39.Jang KY, Hwang SH, Kwon KS, Kim KR, Choi HN, Lee NR, et al. SIRT1 expression is associated with poor prognosis of diffuse large B-cell lymphoma. Am J Surg Pathol. 2008;32:1523–1531. doi: 10.1097/PAS.0b013e31816b6478. [DOI] [PubMed] [Google Scholar]
- 40.Lee H, Kim KR, Noh SJ, Park HS, Kwon KS, Park BH, et al. Expression of DBC1 and SIRT1 is associated with poor prognosis for breast carcinoma. Hum Pathol. 2011;42:204–213. doi: 10.1016/j.humpath.2010.05.023. [DOI] [PubMed] [Google Scholar]
- 41.Tseng RC, Lee CC, Hsu HS, Tzao C, Wang YC. Distinct HIC1-SIRT1-p53 loop deregulation in lung squamous carcinoma and adenocarcinoma patients. Neoplasia. 2009;11:763–770. doi: 10.1593/neo.09470. [DOI] [PMC free article] [PubMed] [Google Scholar]
- 42.Ellis AL, Wang Z, Yu X, Mertz JE. Either ZEB1 or ZEB2/SIP1 can play a central role in regulating the Epstein-Barr virus latent-lytic switch in a cell-type-specific manner. J Virol. 84:6139–6152. doi: 10.1128/JVI.02706-09. [DOI] [PMC free article] [PubMed] [Google Scholar]
- 43.Dai Y, Ngo D, Forman LW, Qin DC, Jacob J, Faller DV. Sirtuin 1 is required for antagonist-induced transcriptional repression of androgen-responsive genes by the androgen receptor. Mol Endocrinol. 2007;21:1807–1821. doi: 10.1210/me.2006-0467. [DOI] [PMC free article] [PubMed] [Google Scholar]
- 44.Lacher MD, Shiina M, Chang P, Keller D, Tiirikainen MI, Korn WM. ZEB1 limits adenoviral infectability by transcriptionally repressing the Coxsackie virus and Adenovirus Receptor. Mol Cancer. 2011;10:91. doi: 10.1186/1476-4598-10-91. [DOI] [PMC free article] [PubMed] [Google Scholar]
- 45.Dai Y, Ngo D, Jacob J, Forman LW, Faller DV. Prohibitin and the SWI/SNF ATPase subunit BRG1 are required for effective androgen antagonist-mediated transcriptional repression of androgen receptor-regulated genes. Carcinogenesis. 2008;29:1725–1733. doi: 10.1093/carcin/bgn117. [DOI] [PMC free article] [PubMed] [Google Scholar]
- 46.Shtutman M, Levina E, Ohouo P, Baig M, Roninson IB. Cell adhesion molecule L1 disrupts E-cadherin-containing adherens junctions and increases scattering and motility of MCF7 breast carcinoma cells. Cancer Res. 2006;66:11370–11380. doi: 10.1158/0008-5472.CAN-06-2106. [DOI] [PubMed] [Google Scholar]
- 47.Vandewalle C, Comijn J, De Craene B, Vermassen P, Bruyneel E, Andersen H, et al. SIP1/ZEB2 induces EMT by repressing genes of different epithelial cell-cell junctions. Nucleic Acids Res. 2005;33:6566–6578. doi: 10.1093/nar/gki965. [DOI] [PMC free article] [PubMed] [Google Scholar]