

Abstract
Candidate gene studies have revealed limited genetic bases for opioid analgesic response variability. Genome-wide association studies (GWAS) facilitate impartial queries of common genetic variants, allowing identification of novel genetic contributions to drug effect. Illumina single nucleotide polymorphism (SNP) arrays were used to investigate SNP associations with total morphine requirement as a quantitative trait locus and with postoperative pain in a retrospective population of opioid-naïve children age 4 – 18 y who had undergone day surgery tonsillectomy and adenoidectomy. In an independent replication cohort, significant GWAS-identified SNPs were assayed using Taqman probes. Among 617 comprehensively phenotyped children, the 277 subjects of European Caucasian (EC) ancestry demonstrated nominal association between morphine dose and a series of novel SNPs (top rs795484, p=1.01×10⁻⁶ and rs1277441, p=2.77×10⁻⁶) at the TAOK3 locus. Age, body mass index, and physical status were included covariates. Morphine requirement averaged 132.4 mcg/kg (SD 40.9). Each minor allele at rs795484 (G>A) contributed +17.6 mcg/kg (95% CI=10.7-24.4) to dose. Effect direction and magnitude were replicated in an independent cohort of 75 EC children (p<0.05). No association with morphine dose was detected in African Americans (AA) (n=241). Postoperative pain scores ≥ 7/10 were associated with rs795484 (G>A) in the EC cohort (OR=2.35, 95% CI=1.56-3.52, p<0.00005) and this association replicated in AA children (OR=1.76, 95% CI=1.14-2.71, p<0.01). Variants in TAOK3 encoding the serine/threonine-protein kinase, TAO3, are associated with increased morphine requirement in children of EC ancestry and with increased acute postoperative pain in both EC and AA subjects.
Keywords: pharmacogenomics, morphine, pediatric anesthesia
1. Introduction
Despite its extensive history as an effective postoperative analgesic [21], morphine sulfate exhibits inconsistent relationships between dosage and analgesic efficacy in both adults [3,5] and children [19,30,31]. Indeed, clinical response variability to morphine may be greater than that seen with other opioids [10]. Genetic and environmental factors contribute to inter-individual variability on multiple levels, from pain processing and perception to specific alterations in opioid pharmacokinetics and pharmacodynamics, and interactions among all factors are highly complex [14,35,41,60,62]. Genetic research on opioid analgesic response has focused on select single nucleotide polymorphisms (SNPs) in candidate genes encoding proteins associated with known opioid pharmacokinetics and pharmacodynamics and those associated with alternate pain-related pathways [32,40,46]. Several studies have demonstrated differing analgesic responses associated with candidate gene SNPs, notably increased postoperative morphine requirements in adults homozygous for μ opioid receptor (MOR) variants encoded by OPRM1 A118G [11,12], but the findings do not carry across all patient populations [14,26]. To date, no major candidate gene or select combination of genetic variants has substantially explained the heritable component of opioid response variability, which may comprise 12-60% of overall inter-individual variance [2]. Current candidate gene approaches give clear evidence of the polygenic nature of postoperative pain and opioid analgesic requirement [14,42], but continue to limit findings to known pain pathway elements.
GWAS (genome-wide association study) methodology and, increasingly, whole exome or whole genome sequencing, facilitate exploration of disease risk [43] and drug effects [16] beyond known mechanisms and candidate genes, furthering “hypothesis-generating,” as compared to “hypothesis-driven” research [65]. Recent pharmacogenomic research using this approach has revealed and/or prioritized important genetic determinants of drug response, such as SNPs at the vitamin K epoxide reductase complex subunit 1 (VKORC1), cytochrome P450 2C9 (CYP2C9) and cytochrome P450 4F2(CYP4F2) loci which individually explain 10-30% of warfarin maintenance dose variability [7,13,63]. In the quest to understand and improve predictability of drug response in adult surgical populations, researchers have just begun to apply GWAS methodology to anesthetic-relevant phenotypes such as postoperative nausea/vomiting [27] and/analgesia associated with ketorolac [33] and fentanyl [49]. GWAS has not yet been used to examine polygenic liability associated with morphine response disparities in pediatric populations, however. Using a GWAS approach in retrospective cohorts of opioid-naïve children, we sought to identify and replicate the most significant SNPs associated with total morphine dose requirements for pediatric day surgery tonsillectomy and adenoidectomy (T & A). Secondary outcomes included identification of the most significant SNPs associated with high (≥7/10) and low (≤3/10) maximum postoperative pain scores.
2. Materials and Methods
2.1. Human subjects protection
This retrospective study was approved by the Children's Hospital of Philadelphia (CHOP) Institutional Review Board with waiver of consent. Final study subjects, genotyped at the Center for Applied Genomics (CAG), previously had been consented and enrolled in the Institutional Review Board-approved Study of the Genetic Causes of Complex Pediatric Disorders.
2.2. Case ascertainment
We queried our Anesthesia Information Management System (AIMS) data warehouse (CompuRecord, Phillips Medical Systems, Andover, MA) to identify day surgery T&A cases between 11/1/2001 and 12/18/2009 (discovery cohort) and again between 12/19/2009 and 11/10/2011 (replication cohort) in which morphine was used as the sole intravenous analgesic. Figure 1 outlines subject selection. Primary inclusion criteria: 1) scheduled for T&A with same day discharge from CHOP surgical facilities; 2) male or female, age 4 - 18 y, all races and ethnicities; 3) documented intraoperative intravenous morphine administration. Primary exclusion criteria: 1) patients with moderate to severe obstructive sleep apnea (OSA) who were scheduled for admission following T&A; 2) patients who had T&A revision or combination surgery with another painful procedure; 3) patients who received alternate intraoperative opioids (fentanyl, hydromorphone, remifentanil), ketamine, flumazenil, or naloxone and those who had surgical site local anesthetic infiltration. Abstracted data for each subject included medical record number, birth date, date of surgery, procedure, day surgery status, sex, weight, and intraoperative morphine dose (in mg).
Figure 1.

Discovery and replication cohort subject selection. AA=African-American, AIMS=Anesthesia Information Management System, CAG=Center for Applied Genomics, EC=European Caucasian ancestry, T&A=tonsillectomy and adenoidectomy.
Querying the CAG database by medical record number, we identified those subjects who had biobanked DNA specimens. We then conducted a comprehensive manual review of the scanned patient chart using Chartmaxx (MedPlus, Mason, OH). Patient age, gender, American Society of Anesthesiologists physical status, procedure, intraoperative morphine, and absence of exclusionary medications were confirmed on the scanned version of the patient record (Compurecord and Sunrise Clinical Manager, Chicago, IL) and in the recently implemented electronic version of Epic Care Clinical System (Epic, Verona, WI). Surgical indications were classified as tonsillar and adenoidal hypertrophy, sleep disordered breathing (SDB), and/or recurrent infection. A review of available polysomnograms done within a year prior to surgery (n=33) confirmed that we had selected out cases with severe OSA, and the known potential for 50% reductions in morphine dose requirement. [8] Discovery cohort subjects with SDB had at most moderate OSA with a median apnea hypopnea index of 4.1 events per hour, interquartile range (IQR)=2.46-9.7; a median SpO2 nadir of 90%, IQR=84-92, and a median total sleep time with SpO2 < 90% of 0 and a maximum of 2.6%. Routine preoperative documentation included assessment of pain and all medications taken within the previous week. No subject had pain on admission and none had taken opioids. Weight and height on the day of surgery were recorded. Whenever heights within 3 mo of surgery were unavailable, height on day of surgery was extrapolated from the most proximate clinic visit measurement (n=12) based on continued percentile height using the 5/30/2000 Centers for Disease Control Growth Charts, Stature-for-Age Percentiles: Boys 2 to 20 y and Girls 2 to 20 y. (www.cdc.gov/growthcharts/data/set1clinical/cj41l022.pdf and cj41C021.pdf) Reported race and ethnicity were noted. Preoperative oral medications including acetaminophen (10-15 mg/kg, maximum 650 mg) and midazolam (0.5 mg/kg, maximum 10 mg) and anesthetic technique including intravenous (thiopental or propofol) versus mask induction were recorded. Sevoflurane in oxygen/nitrous oxide inhalation induction followed by maintenance with either sevoflurane or desflurane in an oxygen/air mixture was favored. Specific administration of propofol, morphine sulfate (averaging 50-100 mcg/kg), ondansetron (50-100 mcg/kg, maximum 4 mg) and dexamethasone (0.5 mg/kg, maximum 10 mg) were verified. Surgical technique employed standard electrocautery with the following average maximal power settings as abstracted from 50 random discovery cohort charts: adenoid hemostasis, 33 watts (range 20-40); tonsil removal, 18 watts (range 15-20); and tonsil hemostasis, 20 watts (range 15-30.) Postanesthesia Care Unit (PACU) documentation included: pain scale (The Children's Hospital of Eastern Ontario Pain Scale (CHEOPS); modified Wong-Baker FACES; Face, Legs, Activity, Cry and Consolability (FLACC); or 10 point numerical) [22,47,65] and scores (at 15 min intervals up to discharge); postoperative intravenous morphine administration (25-50 mcg/kg every 5-10 min to 100-200 mcg/kg in the PACU); time of oxycodone (or codeine, n=8) administration following PACU admission; exclusionary opioids (fentanyl, hydromorphone or meperidine); time to discharge and unanticipated hospital admission. Children who were admitted or who received postoperative intravenous opioid other than morphine were excluded. All data were entered on case report forms and then transcribed to a password-protected Excel spreadsheet (Microsoft, Redmond, WA). Because CHEOPS scores range from 4 to 13, they were normalized to a 0-10 scale. Maximum and minimum postoperative pain scores (0-10), body mass index (BMI) in kg/m2, and postoperative and total (intraoperative plus postoperative) morphine in mcg/kg were calculated.
2.3. SNP genotyping
DNA had been collected from whole blood (n=873) or saliva (n=5) and all samples were genotyped at CAG. Among the 293 unrelated European Caucasian (EC) participants in the discovery cohort, 136 samples were genotyped on the Illumina HumanHap550 SNP array (Illumina, San Diego, CA, USA); and 157 samples were genotyped on the Illumina Human610-Quad version 1 SNP array, overlapping in 535,752 common SNPs. Genotyping signals were processed and genotype calls generated by using Illumina's standard data normalization procedures and canonical genotype, as previously described [20]. SNP genotyping information was similarly obtained from 251 African American (AA) discovery cohort participants. Subject ancestry was verified by the use of multidimensional scaling implemented in PLINK and entered into the datasets [54]. Using Hapmap subjects as references, samples with mixed European and African ancestries were classified as AA subjects or excluded from analysis if not clustering with either the EC or AA group. For the 76 subjects in the EC replication cohort, Taqman SNP genotyping assay (Life Technologies, Carlsbad, CA, USA) was performed for SNPs rs795484 and rs1277441 (assay identification numbers C__1427766_10 and C__7524604_10, respectively) according to the manufacturer's standard protocol. One EC replication cohort sample failed SNP genotyping. Cryptic related samples were detected and one from each pair was removed based on whole genome identity-by-descent (IBD) scores > 0.25. Only SNP markers common to both 550k and 610k chips were used for analysis. We further removed 5173 SNPs for missing rate > 5%, 456 SNPs for deviating from Hardy-Weinberg equilibrium (Hardy-Weinberg test p < 0.0001), and 20497 SNPS for minor allele frequency < 0.01, leaving 509904 SNPs for association testing. Additional quality control statistics for the top 6 TAOK3 SNPs in the EC discovery cohort showed similar minor allele frequencies (p=NS) and SNP missingness (p=NS) between the HumanHap550 (n=130) and Human610 Quad (n=147) arrays, discounting the possibility that the association between TAOK3 SNPs and total morphine dose could be due to batch effect between the two genotyping platforms.
2.4. Phenotype measurements
Phenotypes were chosen to be clinically relevant and unequivocal. The primary outcome, total (intraoperative plus postoperative) morphine in mcg/kg absolute body weight titrated within one to two drug half-lives [5,30,31], is studied as a quantitative trait locus. This outcome/phenotype features a robust clinical endpoint that reduces varying individual pain scores to a specific functional level, namely, comfort sufficient to go home. Secondary outcomes addressed normalized maximal pain scores and were divided into two binary traits: low maximum pain (≤3/10), where recovery room personnel would be unlikely to administer further intravenous analgesics, and high maximum pain (≥7/10), where staff administer additional intravenous analgesics by protocol. While there is no consensus cut-off for severe pain in children [66], we chose a high maximal pain score threshold of ≥ 7 (equivalent to a visual analog score of 70) for a secondary outcome, to be consistent with the definition of severe pain in adult pain research [3].
2.5. Association analysis
Regression analyses were used to examine whether outcomes were dependent on age, gender, BMI, surgical indication (stratified by a primary diagnosis of hypertrophy/SDB versus recurrent infection), physical status, analgesic exposure (+/- preoperative acetaminophen, time to postoperative oxycodone administration) or anesthetic technique (+/- propofol exposure.) Characteristics of significance were included as covariates for analysis of association between SNP genotypes and outcomes. The GWAS between SNP genotypes and the traits of interest were conducted using PLINK software version 1.07 [54]. For the primary outcome of total morphine dose, which was approximately normally distributed, a linear regression model was applied to assess associations between subject characteristics and SNP genotypes. For the binary traits of high and low maximum pain scores, chi-squared and Fisher Exact tests were applied to assess the association if no covariate was included in the analysis and logistic regression models were used to evaluate the association when covariates were included. To control for genetic structure in our study population [50,52], separate associations were conducted by race. The largest subpopulations, those of EC and AA ancestry, were examined for significant associations. A regional association plot was generated using LocusZoom [53].
2.6. Genotype imputation
Referencing the 1000 Genome Phase I integrated variant set (http://mathgen.stats.ox.ac.uk/impute/data_download_1000G_phase1_integrated.html), we utilized the IMPUTE2 package [23,44] to conduct imputation of the TAOK3 region. We performed an additional association analysis on the imputed variants in the TAOK3 region using the missing data likelihood score test implemented in SNPTEST v2 package [44].
3. Results
3.1. Case ascertainment
Querying 10 years of operative caseload contained within the AIMS data warehouse and including only those with CAG biobank specimens, the final retrospective discovery and replication cohorts were established based on the flow chart shown in Figure 1. The replication cohorts were assembled and studied after the discovery cohort GWAS analyses were complete. Primary data were abstracted from and verified in ChartMaxx and/or Epic. Protocol violations, most often found in the narrative sections of scanned electronic records, included: intravenous fentanyl, remifentanil, flumazenil or ketamine administration; tonsil bed local anesthetic infiltration; or an additional painful procedure (myringotomy with tympanostomy tube placement) recorded. Several children with significant co-morbidities, including severe OSA, had planned admissions though the case had been booked incorrectly for day surgery. Children with unanticipated admissions were excluded. This group was heterogeneous in nature with one or more of the following admission reasons: ongoing supplemental oxygen requirement, episodes of oxyhemoglobin desaturation, mild to moderate airway obstruction, presence of a nasopharyngeal airway (collectively, respiratory complications (n = 17)); persistent nausea and vomiting (n = 5); lethargy (n = 3); and observation after excessive surgical bleeding (n = 5). One child in the replication cohort was admitted for nausea/vomiting and intractable pain.
3.2. Demographics and phenotypes
Patient characteristics for the entire discovery and replication cohorts, then separated by predominant races, are shown in Table 1. The replication group was older by a year (p<0.001) and had a shift in physical status distribution, with a higher percentage of physical status 2 and 3 patients (p<0.005). The range of total morphine sulfate administered was 35.2-320.8 mcg/kg across the entire discovery cohort. Total dose was significantly higher in EC than in AA children by an average of 13.7 mcg/kg (p<0.00005). Combining full phenotype EC and AA discovery and replication cohorts (n=663), and regressing total morphine dose requirement on race and BMI, the Beta coefficient for race was -9.14 (p<0.005) and that for BMI was -2.56 (p<10-16). High maximum pain was not different between AA and EC children. However, more AA than EC children in the discovery cohort had ≤3/10 maximum pain (26.7 versus 15.7%, p<0.005) with a similar trend in the smaller replication cohort.
Table 1. Demographics and Phenotypes.
| Discovery | Replication | |||||
|---|---|---|---|---|---|---|
|
|
|
|||||
| Total n=617 | EC n=277 | AA n=241 | Total n=165 | EC n=75 | AA n=70 | |
|
| ||||||
| Age (mo) | 99.8 (42.0)a | 100.9 (45.2) | 102.6 (40.2) | 112.6 (43.4)a | 111.9 (42.2) | 110.3 (42.5) |
|
| ||||||
| Sex M/F (%) | 48.5/51.5 | 49.1/50.9 | 45.6/54.4 | 43.0/57.0 | 41.3/58.7 | 44.3/55.7 |
|
| ||||||
| Weight (kg) | 35.7 (20.7) | 33.7 (18.9) | 40.1 (23.3) | 39.2 (19.3) | 38.4 (20.8) | 39.6 (17.3) |
|
| ||||||
| Height (cm) | 131.3 (20.1) | 129.6 (20.7) | 134.1 (19.4) | 135.9 (19.0) | 135.2 (19.5) | 136.2 (18.2) |
|
| ||||||
| BMI (kg/m2) | 19.4 (5.5) | 18.6 (4.5)b | 20.6 (6.5)b | 20.0 (5.5) | 19.5 (5.8) | 20.3 (4.8) |
|
| ||||||
| ASA PS (%) | ||||||
| 1 2 3 |
19.3c 77.4 3.3 |
20.9 75.1 4.0 |
15.8 81.3 2.9 |
11.5c 80.0 8.5 |
14.7 78.7 6.7 |
11.4 78.6 10.0 |
|
| ||||||
| Morphine (mcg/kg) | 128.2 (41.4) | 132.4 (40.9)d | 118.6 (39.8)d | 123.3 (43.8) | 129.8 (43.1)e | 116.2 (46.0)e |
|
| ||||||
| Pain ≤ 3* (%) | 20.3 | 15.7f | 26.7f | 20.5 | 18.9g | 22.1g |
|
| ||||||
| Pain ≥ 7* (%) | 47.0 | 49.3h | 46.6h | 48.5 | 50.0i | 45.6i |
Age, weight, height, BMI and total morphine dose are reported as mean followed by SD in parentheses. Specific statistical comparisons are indicated with lettered superscripts:
p=5.61×10⁻⁴ (t-test for equal means);
p=4.38×10⁻⁵ (t-test for equal means);
p=2.34×10⁻³ (Fisher's exact test);
p=1.28×10⁻⁴ (t-test for equal means);
p=0.0672 (t-test for equal means);
p=3.42×10³ (Fisher's exact test);
p=0.681 (Fisher's exact test);
p=0.586 (Fisher's exact test);
p=0.618 (Fisher's exact test.)
Maximum pain scores (normalized to a 0 – 10 scale) were not reported in all children: for discovery cohort, 553 subjects had consistently documented numerical scores, and for replication, 161. AA = African-American ancestry, ASA PS = American Society of Anesthesiologists' physical status, BMI = body mass index, EC = European Caucasian ancestry, SD = standard deviation.
3.3. Covariate determination
Regression analysis revealed age, BMI, and physical status to be the significant GWAS covariates for total morphine dose in all children. (Table 2) The regression adjusted R2 values for these combined factors were 0.091 for EC subjects and 0.129 for AA children. For high maximal pain, age was the only relevant covariate and only in the EC population (ß=6.78×10⁻³, p<0.05). Total morphine dose data were consistently distributed along sex-specific regression lines throughout the study age range. There were no aberrancies for those ≥ 12 y of age, suggesting that no dose changes were associated specifically with puberty. Importantly, regression analysis did not identify sex, oral analgesic (+/- preoperative acetaminophen, or time to postoperative oxycodone), anesthetic technique (+/- propofol) or surgical indication (stratified by SDB +/- hypertrophy, n=314, and by infection +/- hypertrophy, n=122) as significant covariates in EC subjects. However, average total morphine for children presenting with recurrent infection trended higher than that for children with a primary diagnosis of SDB (137.3 mcg/kg versus 126.1 mcg/kg, respectively.) In the 16 subjects study-wide who had polysomnograms in advance of surgery demonstrating SpO2 nadirs < 85%, the average total morphine was 127.7 mcg/kg. With regard to acetaminophen: in the combined cohorts, a total of 30 subjects received no preoperative acetaminophen and required an average morphine sulfate dose of 124.9 mcg/kg. Anesthetic variation by presence (n = 282) or absence (n = 335) of bolus propofol, with its potential for persistent sedation and prevention of nausea and vomiting, did not affect outcomes (for total morphine dose, ß=0.527, p=NS in EC; ß=0.866, p=NS in AA subjects.) Intraoperative morphine averaged 88.2 mcg/kg (SD 26.9, range 24.8 - 272.7 mcg/kg) and postoperative morphine averaged 40.0 mcg/kg (SD 34.6, range 0 - 240.2 mcg/kg), with no significant intercorrelation (Pearson correlation coefficient -0.098). Oxycodone was most commonly given for prophylactic pain control beyond hospital discharge with median time of 50 min (IQR=26-79 min) from PACU admission to oral administration. Comparing the 25 discovery cohort children who received no oral opioids in the PACU to those who did, postoperative morphine averaged 22.7 versus 40.6 mcg/kg and total morphine sulfate was 115.9 versus 128.8 mcg/kg, respectively. Maximum postoperative pain scores (4.1 versus 6.1) were less in these subjects who received no oxycodone. PACU stay averaged 2.3 (SD 0.8) h for discovery cohort subjects and 2.0 (SD 0.6) h for those in the replication cohorts.
Table 2. GWAS covariate determination: linear regression analyses for total morphine sulfate dose requirement in children of European Caucasian and African-American ancestry.
| EC (n=293) | AA (n=251) | ||||
|---|---|---|---|---|---|
| Beta | P-value | Beta | P-value | ||
| Age | -0.115 | 3.23×10⁻² | -0.209 | 8.24×10⁻⁴ | |
| Sex | +3.99 | 0.407 | -3.10 | 0.541 | |
| BMI | -2.52 | 2.80×10⁻⁶ | -2.23 | 3.84×10⁻⁹ | |
| ASA PS | -11.59 | 2.36×10⁻² | -14.54 | 1.65×10⁻² | |
| Oxycodone* | -1.30x10⁻³ | 0.977 | +7.10×10⁻² | 0.156 | |
Analyses included all those subjects for whom full phenotype information was available.
Oxycodone refers to oral opioid administration time after postanesthesia recovery room admission. AA=African-American, ASA PS = American Society of Anesthesiologists' physical status, Beta = regression coefficient, BMI=body mass index, EC=European Caucasian ancestry, GWAS = genome-wide association study.
3.4. GWAS results for total morphine dose in the EC population
The top SNPs (p<1×10⁴) associated with total morphine sulfate requirement in EC children are shown in Table 3. Those residing at the TAOK3 locus on chromosome 12 feature most prominently in the Manhattan plot (Figure 2). The top SNPs, rs795484 (ß=17.6, 95% CI=10.7-24.4; p=1.01×10⁻⁶) and rs1277441 (ß=17.0, 95% CI=10.0-23.9; p=2.77×10⁻⁶) are both intronic and their nominally significant associations, of the same direction and magnitude, (ß=12.0, 95% CI=-0.87-24.8; one-sided p=0.036; ß=11.7, 95% CI=-1.6-24.9; one-sided p=0.044) replicated in a subsequent independent cohort also of EC ancestry. Combining EC discovery and replication cohorts: ß=16.1, 95% CI=10.0-21.1; p=2.96×10⁻⁷ for rs795484 and ß=15.6, 95% CI=9.5-21.7; p=7.99×10⁻⁷ for rs1277441. Bias-reduced ß estimates using a bootstrap re-sampling technique [61] are 14.0 and 11.6 for these top 2 SNPs, respectively. One associated SNP is located in the coding region of TAOK3, rs428073 (p=9.13×10⁵), resulting in a Serine to Asparagine missense mutation. None of these SNPs showed association with total morphine dose in the AA population and a meta-analysis of combined EC and AA discovery cohorts demonstrated signal attenuation: ß=11.1, SE=2.6, p=1.55×10⁻⁵ for rs 795484 and ß=11.2, SE=2.6, p=1.41×10⁻⁵ for rs 1277441. However, the intronic TAOK3 SNPs are associated with the secondary outcome of high maximum pain scores ≥ 7/10 in both the EC and AA discovery cohorts (Table 4). Figure 3 shows the morphine dose requirement associated with genotype at rs795484 and rs1277441 for the combined EC discovery and replication cohorts. Mean total morphine doses for rs795484 variants were: 123.5 mcg/kg (SD 38.9) for GG (n=163); 137.3 mcg/kg (SD 41.7) for AG (n=168); and 153.1 mcg/kg (SD 41.4) for AA (n=37). Means for rs1277441 variants were: 123.8 mcg/kg (SD 39.2) for TT (n=161); 137.0 mcg/kg (SD 41.6) for CT (n=170); and 153.0 mcg/kg (SD 42.0) for CC (n=36). Averaging linked allelic contributions of rs795484 and rs1277441, each minor variant increased total morphine requirement by 11.4%. Regression of the residuals (that variance unexplained by the combination of age, BMI, and physical status) on these top two TAOK3 SNPs yielded an adjusted R2 of 0.0798.
Table 3. Top GWAS-identified SNPs associated with total morphine sulfate dose requirement in the discovery cohort of European Caucasian ancestry.
| SNP | Closest Gene | CHR | BP (hg18) | Minor/Major Allele | MAF | Beta | CI 95% | P-value |
|---|---|---|---|---|---|---|---|---|
| rs795484 | TAOK3 | 12 | 117074245 | A/G | 0.34 | 17.55 | (10.68, 24.43) | 1.01×10⁻⁶ |
| rs1277441 | TAOK3 | 12 | 117090372 | C/T | 0.34 | 16.96 | (10.02, 23.9) | 2.77×10⁻⁶ |
| rs7680282 | TEC | 4 | 47891251 | T/C | 0.23 | 17.38 | (10.15, 24.62) | 3.95×10⁻⁶ |
| rs4916453 | MFI2 | 3 | 198210436 | A/G | 0.42 | -14.6 | (-20.95, -8.26) | 9.60×10⁻⁶ |
| rs917634 | NCAPD2 | 12 | 6501430 | A/C | 0.46 | -14.75 | (-21.21, -8.29) | 1.13×10⁻⁵ |
| rs904661 | PEBP1 | 12 | 117066243 | T/C | 0.40 | 15.34 | (8.48, 22.2) | 1.66×10⁻⁵ |
| rs1699160 | TAOK3 | 12 | 117240719 | G/T | 0.33 | 14.9 | (8.00, 21.8) | 3.16×10⁻⁵ |
| rs353897 | TAOK3 | 12 | 117124224 | T/C | 0.33 | 14.84 | (7.95, 21.74) | 3.35×10⁻⁵ |
| rs10519525 | ATP10A | 15 | 23560464 | T/C | 0.33 | 14.83 | (7.92, 21.73) | 3.50×10⁻⁵ |
| rs4745639 | GNA14 | 9 | 79255890 | G/A | 0.16 | -19.02 | (-27.93, -10.12) | 3.80×10⁻⁵ |
| rs1532763 | SORL1 | 11 | 121010533 | C/T | 0.43 | 13.76 | (7.30, 20.21) | 3.95×10⁻⁵ |
| rs2590943 | NEGR1 | 1 | 72647044 | T/C | 0.19 | 17.34 | (9.21, 25.48) | 3.98×10⁻⁵ |
| rs782257 | NEGR1 | 1 | 72671647 | T/C | 0.19 | 17.34 | (9.21, 25.48) | 3.98×10⁻⁵ |
| rs689395 | SPP2 | 2 | 234632725 | C/T | 0.14 | 19.92 | (10.54, 29.3) | 4.25×10⁻⁵ |
| rs12303303 | TRHDE | 12 | 71028636 | C/T | 0.094 | 22.8 | (12.06, 33.54) | 4.26×10⁻⁵ |
| rs1925432 | HDGFL1 | 6 | 23401987 | T/C | 0.32 | 14.27 | (7.53, 21.02) | 4.49×10⁻⁵ |
| rs2447026 | FRMD4A | 10 | 14042149 | A/G | 0.25 | 15.57 | (8.21, 22.94) | 4.58×10⁻⁵ |
| rs1360548 | BNC2 | 9 | 16279143 | A/C | 0.29 | 15.9 | (8.33, 23.46) | 5.05×10⁻⁵ |
| rs7404450 | PARN | 16 | 14358155 | T/C | 0.25 | 15.42 | (8.07, 22.77) | 5.23×10⁻⁵ |
| rs1545821 | CSMD1 | 8 | 3593993 | T/C | 0.049 | 31.5 | (16.43, 46.58) | 5.56×10⁻⁵ |
| rs12240404 | FRMD4A | 10 | 14028904 | T/C | 0.13 | 19.32 | (10.07, 28.57) | 5.57×10⁻⁵ |
| rs10920099 | CACNA1S | 1 | 199270229 | G/A | 0.48 | -12.94 | (-19.16, -6.71) | 6.07×10⁻⁵ |
| rs6844153 | STIM2 | 4 | 26553412 | T/C | 0.21 | 15.17 | (7.85, 22.5) | 6.39×10⁻⁵ |
| rs11737218 | STIM2 | 4 | 26494871 | T/G | 0.27 | 14.25 | (7.34, 21.16) | 6.86×10⁻⁵ |
| rs1328247 | MYO16 | 13 | 108917530 | C/T | 0.21 | 15.48 | (7.95, 23) | 7.20×10⁻⁵ |
| rs906751 | FBXO39 | 17 | 6622460 | C/T | 0.20 | -16.52 | (-24.55, -8.49) | 7.23×10⁻⁵ |
| rs8083908 | DOK6 | 18 | 65295141 | A/C | 0.46 | 12.14 | (6.24, 18.05) | 7.28×10⁻⁵ |
| rs4069861 | DCTD | 4 | 184153668 | C/A | 0.22 | -15.03 | (-22.35, -7.72) | 7.29×10⁻⁵ |
| rs7745737 | ESR1 | 6 | 152029499 | A/C | 0.14 | -18.73 | (-27.86, -9.61) | 7.44×10⁻⁵ |
| rs892015 | LOC342897 | 19 | 44376749 | G/T | 0.37 | -13.34 | (-19.85, -6.83) | 7.67×10⁻⁵ |
| rs3792685 | STIM2 | 4 | 26568305 | G/A | 0.22 | 14.66 | (7.50, 21.83) | 7.87×10⁻⁵ |
| rs4925811 | KIAA1688 | 8 | 145773255 | G/T | 0.48 | -13.6 | (-20.27, -6.94) | 8.11×10⁻⁵ |
| rs10277969 | CNTNAP2 | 7 | 147666125 | G/A | 0.33 | -14.69 | (-21.89, -7.49) | 8.27×10⁻⁵ |
| rs673382 | ADAM2 | 8 | 39727788 | C/T | 0.45 | -13.1 | (-19.54, -6.67) | 8.41×10⁻⁵ |
| rs17413451 | KIAA1026 | 1 | 15223870 | A/G | 0.15 | 18.47 | (9.40, 27.53) | 8.44×10⁻⁵ |
| rs1294573 | TTC7B | 14 | 90078557 | A/G | 0.46 | 13.81 | (7.02, 20.59) | 8.51×10⁻⁵ |
| rs7686567 | KIT | 4 | 55345524 | A/G | 0.12 | -20.88 | (-31.14, -10.62) | 8.53×10⁻⁵ |
| rs2940564 | FAM173B | 5 | 10198831 | G/A | 0.13 | -20.33 | (-30.32, -10.33) | 8.61×10⁻⁵ |
| rs9628003 | BRD1 | 22 | 48186086 | T/C | 0.052 | 28.72 | (14.59, 42.84) | 8.70×10⁻⁵ |
| rs2305744 | HPN | 19 | 40247963 | G/A | 0.28 | -14.3 | (-21.33, -7.26) | 8.76×10⁻⁵ |
| rs708868 | TAOK3 | 12 | 117114152 | G/A | 0.34 | 14.16 | (7.18, 21.13) | 8.91×10⁻⁵ |
| rs7300263 | SLC16A7 | 12 | 59186140 | C/T | 0.21 | -15.3 | (-22.85, -7.76) | 8.93×10⁻⁵ |
| rs428073 | TAOK3 | 12 | 117167134 | C/T | 0.33 | 14.19 | (7.19, 21.19) | 9.13×10⁻⁵ |
| rs6815719 | STIM2 | 4 | 26490952 | A/G | 0.28 | 13.9 | (7.04, 20.76) | 9.19×10⁻⁵ |
| rs6475028 | BNC2 | 9 | 16280269 | T/C | 0.29 | 15.19 | (7.68, 22.7) | 9.41×10⁻⁵ |
| rs1176493 | TCERG1L | 10 | 132361595 | C/T | 0.074 | -25.58 | (-38.23, -12.92) | 9.57×10⁻⁵ |
| rs1505931 | IPMK | 10 | 59250064 | T/G | 0.16 | -16.63 | (-24.86, -8.39) | 9.63×10⁻⁵ |
| rs7243619 | FHOD3 | 18 | 32139089 | C/T | 0.39 | 13.06 | (6.59, 19.53) | 9.69×10⁻⁵ |
| rs12642922 | STIM2 | 4 | 26636716 | C/T | 0.24 | 13.96 | (7.05, 20.88) | 9.69×10⁻⁵ |
| rs13399908 | ETAA1 | 2 | 67159662 | A/G | 0.25 | -14.56 | (-21.78, -7.34) | 9.88×10⁻⁵ |
Reported SNPs limited to those with p<1×10⁴ for the primary outcome of total morphine sulfate dose in the 277 subject discovery cohort of European Caucasian ancestry. A= adenine; Beta = regression coefficient in mcg/kg morphine; BP = base pairs; C = cytosine; CHR = chromosome; CI 95%= 95% confidence interval; G = guanine; GWAS = genome-wide association study; MAF = minor allele frequency; SNP = single nucleotide polymorphism; T = thymine
Figure 2.
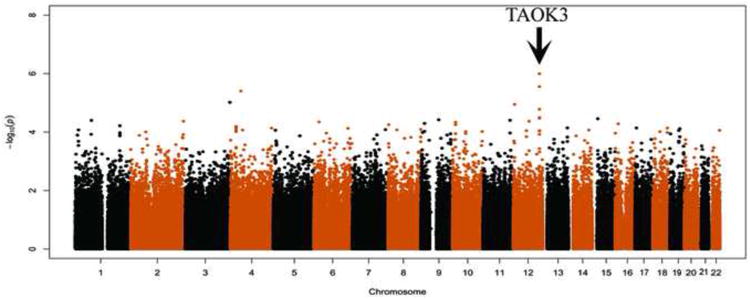
Manhattan plot showing the association between single nucleotide polymorphism (SNP) genotype and total morphine sulfate dose in the discovery cohort of European Caucasian ancestry. Chromosome coordinates are indicated on the X axis and negative logarithms of the P-values are shown on the Y axis. Significant SNPs at the TAOK3 locus on chromosome 12 are indicated by the arrow.
Table 4. Top TAOK3 SNPs associated with maximum postoperative pain ≥ 7/10 in children of European Caucasian and African-American ancestry.
| EC discovery cohort (n=277) | AA discovery cohort (n=241) | |||||||||||
|---|---|---|---|---|---|---|---|---|---|---|---|---|
| SNP | Gene | Minor/Major allele | MAF (cases) | MAF (controls) | OR | CI 95% | P-value | MAF (cases) | MAF (controls) | OR | CI 95% | P-value |
| rs795484 | TAOK3 | A/G | 0.42 | 0.25 | 2.35 | (1.56, 3.52) | 4.10x10⁻⁵ | 0.32 | 0.21 | 1.76 | (1.14, 2.71) | 9.69×10⁻³ |
| rs1277441 | TAOK3 | C/T | 0.42 | 0.26 | 2.24 | (1.49, 3.36) | 1.03x10⁻⁴ | 0.34 | 0.23 | 1.71 | (1.12, 2.61) | 1.21×10⁻² |
Relationship of GWAS-identified top TAOK3 SNPs for primary outcome of morphine dose with secondary outcome of high maximum pain scores. There were 132 cases with high maximum pain score ≥7 and 136 controls with maximum pain score <7 in the EC discovery cohort; 103 cases and 118 controls in the AA discovery cohort. AA = African-American, CI 95%= 95% confidence interval, EC = European Caucasian; GWAS = genome-wide association study, MAF = minor allele frequency, OR = odds ratio, SNP = single nucleotide polymorphism.
Figure 3.
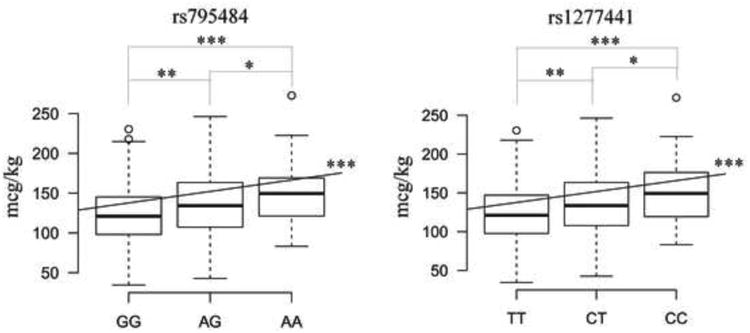
Box plots showing the distribution of total morphine dose according to single nucleotide polymorphism (SNP) genotype in the combined discovery and replication cohorts of European Caucasian ancestry. The X axes represent each SNP genotype group: GG, AG, AA for rs 795484; TT, CT, CC for 1277441 with the nucleoside base abbreviations: A=adenine, C=cytosine, G=guanine, and T=thymine. The Y axes show total morphine dose required in mcg/kg. The bottom border of each box represents the first quartile of data (total morphine administered in each SNP genotype group), the top border is the third quartile, and the thick horizontal segment within each box indicates the median. The end of the lower whisker and that of the upper whisker represent the lowest datum and the highest datum within 1.5 interquartile range (IQR) of the lower quartile and 1.5 IQR of the upper quartile respectively. Open dots beyond the whiskers indicate outliers. Asterisks indicate significance levels: * p-value <0.05, ** p-value < 0.005, and *** p-value < 1×10⁻⁴ for two-sided t-tests or linear regressions.
3.5. Locus analysis and imputation results
While TAOK3 fit the best association profile for these SNPs, a regional association plot for rs795484 (Figure 4) demonstrated 3 genes in linkage disequilibrium with TAOK3, namely v-set and immunoglobulin domain containing 10 (VSIG10), phosphatidylethanolamine binding protein 1 (PEBP1), and suppressor of defective silencing 3 homolog (SUDS3). We conducted imputation and though no SNPs showed genome-wide significance, we identified additional 29 variants that were nominally associated with total morphine sulfate requirement in EC subjects (E-supplement).
Figure 4.
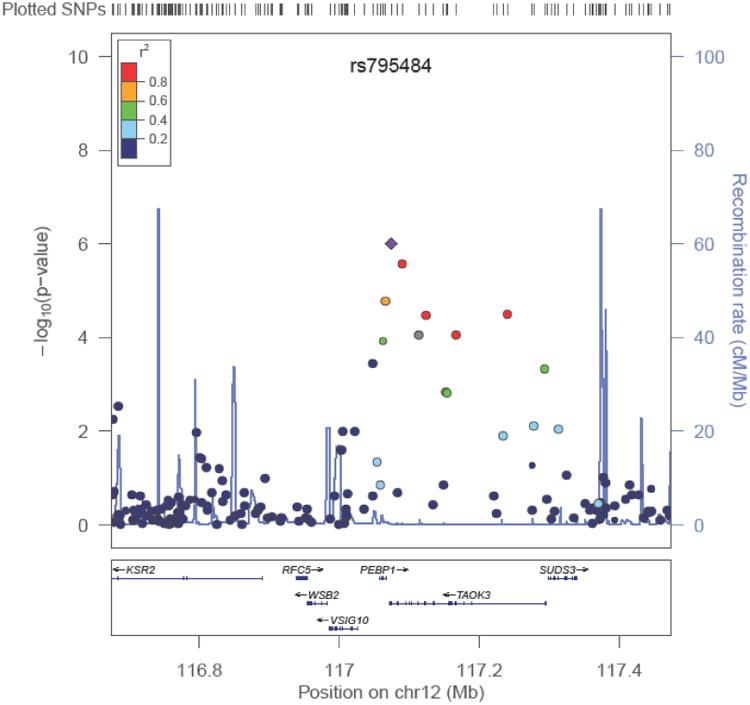
Regional association plot for rs795484. SNPs are plotted by chromosomal position in a 400-kb window against their negative logarithm of P-values for association with total morphine sulfate dose in the European Caucasian discovery cohort. The color of each SNP reflects its LD with rs795484. The r2 values were estimated from the Hapmap CEU data.
3.6. GWAS analyses for AA population and secondary outcomes
The GWAS results for the top SNPs with p < 5×10⁻⁵ for total morphine requirement in the AA population are shown in Table 5. Unlike the strongly supported series of SNPs at the TAOK3 locus in the EC population (Table 3 and Figure 2), no set of SNPs associated with a single gene and/or in linkage disequilibrium with one another were identified in subjects of AA ancestry. The only known candidate gene SNPs reaching the top 500 for any GWAS analysis were 3 SNPs tagging OPRM1, specifically rs1892359 (ß=12.4, SE=3.6; p=6.65×10⁻⁴), rs1892356 (ß=12.4, SE=3.6; p=6.93×10⁻⁴), and rs1937622 (ß=12.4, SE=3.6; p=6.93×10⁻⁴) for total morphine as a quantitative trait locus in AA children. Presentation of full candidate gene findings is beyond the scope of this manuscript and is being published separately. GWAS analysis for high maximum pain revealed no SNPs reaching p<1×10⁻⁶ significance with supporting SNPs in linkage disequilibrium. However, in the EC cohort queried for low maximum pain (≤ 3/10) versus all others, the top 2 SNPs associated with transmembrane protein 117 (TMEM117) and cell division cycle 5-like (CDC5L) genes at 10-6 significance levels: rs1322650 (p=1.21×10⁶) and rs736259 (p=5.41×10⁻⁶).
Table 5. Top GWAS-identified SNPs associated with total morphine sulfate dose requirement in the African-American discovery cohort.
| SNP | Closest Gene | CHR | BP (hg18) | Minor/Major Allele | MAF | Beta | CI 95% | P-value |
|---|---|---|---|---|---|---|---|---|
| rs1875227 | MT4 | 16 | 55156116 | T/C | 0.015 | 60.09 | (36.68, 83.49) | 9.61×10⁻⁷ |
| rs1872270 | DMP1 | 4 | 88828705 | T/C | 0.34 | 16.33 | (9.742, 22.92) | 2.18×10⁻⁶ |
| rs1503245 | C1D | 2 | 68078248 | T/C | 0.060 | 31.39 | (18.55, 44.24) | 2.96×10⁻⁶ |
| rs10515902 | ODZ2 | 5 | 165002573 | A/G | 0.029 | 46.55 | (27.28, 65.82) | 3.80×10⁻⁶ |
| rs4620271 | CPA6 | 8 | 68904031 | T/C | 0.18 | 18.82 | (11.03, 26.62) | 3.86×10⁻⁶ |
| rs9457743 | PNLDC1 | 6 | 160193689 | G/T | 0.36 | -15.73 | (-22.44, -9.03) | 6.83×10⁻⁶ |
| rs6930229 | PNLDC1 | 6 | 160203429 | A/C | 0.36 | -15.63 | (-22.35, -8.91) | 8.22×10⁻⁶ |
| rs10915528 | AJAP1 | 1 | 4371234 | C/T | 0.075 | 27.88 | (15.88, 39.89) | 8.46×10⁻⁶ |
| rs2869703 | DMP1 | 4 | 88845302 | C/T | 0.29 | 16.56 | (9.44, 23.69) | 8.50×10⁻⁶ |
| rs12566055 | USP24 | 1 | 56033402 | T/C | 0.012 | 67.45 | (38.37, 96.53) | 8.74×10⁻⁶ |
| rs234348 | PSMC4 | 19 | 45159823 | G/A | 0.21 | 18.28 | (10.34, 26.21) | 1.00×10⁻⁵ |
| rs1106561 | IGSF9B | 11 | 133282598 | C/T | 0.017 | 51.82 | (29.26, 74.38) | 1.06×10⁻⁵ |
| rs329665 | IGSF9B | 11 | 133262385 | T/C | 0.017 | 51.82 | (29.26, 74.38) | 1.06×10⁻⁵ |
| rs7996854 | SPRY2 | 13 | 80075599 | A/G | 0.14 | 19.84 | (10.92, 28.75) | 1.93×10⁻⁵ |
| rs2052369 | KCNMB2 | 3 | 179226332 | C/T | 0.15 | 20.03 | (11.02, 29.04) | 1.96×10⁻⁵ |
| rs5921071 | DIAPH2 | 23 | 97524912 | A/G | 0.17 | 21.13 | (11.61, 30.66) | 2.03×10⁻⁵ |
| rs2629812 | SYT6 | 1 | 114454559 | G/A | 0.40 | 14.12 | (7.69, 20.56) | 2.50×10⁻⁵ |
| rs726403 | TGM3 | 20 | 2154591 | G/T | 0.040 | 35.11 | (19.1, 51.12) | 2.52×10⁻⁵ |
| rs4238351 | RORA | 15 | 59231778 | G/A | 0.47 | -14.89 | (-21.68, -8.09) | 2.56×10⁻⁵ |
| rs2268550 | TBX19 | 1 | 166615795 | A/G | 0.18 | 18.36 | (9.97, 26.75) | 2.62×10⁻⁵ |
| rs11997612 | SGCZ | 8 | 14246099 | C/T | 0.16 | -20.72 | (-30.24, -11.2) | 2.90×10⁻⁵ |
| rs10770826 | PEX5 | 12 | 7276760 | A/G | 0.41 | -14.05 | (-20.54, -7.57) | 3.14×10⁻⁵ |
| rs11157432 | FANCM | 14 | 44688967 | G/A | 0.017 | 55.09 | (29.56, 80.62) | 3.36×10⁻⁵ |
| rs16859092 | NOS1AP | 1 | 160491174 | C/T | 0.083 | -25.57 | (-37.42, -13.72) | 3.36×10⁻⁵ |
| rs2473594 | LRFN2 | 6 | 40658416 | T/C | 0.32 | 15.48 | (8.29, 22.68) | 3.54×10⁻⁵ |
| rs16851279 | ALCAM | 3 | 106748964 | C/T | 0.081 | 23.7 | (12.64, 34.76) | 3.80×10⁻⁵ |
| rs2195349 | COX7C | 5 | 85978500 | C/T | 0.10 | 20.59 | (10.92, 30.27) | 4.24×10⁻⁵ |
| rs2959777 | MCph1 | 8 | 6421343 | G/A | 0.48 | 14.04 | (7.43, 20.65) | 4.46×10⁻⁵ |
| rs2191888 | NEUROD6 | 7 | 31349029 | C/A | 0.093 | 23.45 | (12.36, 34.54) | 4.76×10⁻⁵ |
| rs717252 | LPHN3 | 4 | 60846313 | C/T | 0.40 | -14.06 | (-20.72, -7.40) | 4.84×10⁻⁵ |
Reported SNPs limited to those with p<5×10⁵ for the primary outcome of total morphine sulfate dose in the 241 subject discovery cohort of African-American ancestry with full phenotype. A= adenine, Beta = regression coefficient in mcg/kg morphine, BP = base pairs, C = cytosine, CHR = chromosome, CI 95% = 95% confidence interval, G = guanine, GWAS = genome-wide association study, MAF = minor allele frequency, SNP = single nucleotide polymorphism, T = thymine.
4. Discussion
4.1. Principal GWAS finding
We performed a GWAS on a retrospective comprehensively phenotyped, opioid-naïve pediatric day surgery population and discovered a nominal association between SNPs related to the novel gene TAOK3 and morphine requirement in children of EC ancestry. While not reaching significance at p < 5×10⁻⁸, our collective evidence implicates the TAOK3 locus. The Manhattan plot (Figure 2) demonstrated multiple supporting SNPs in linkage disequilibrium with p = 10-5 - 10-7 (Table 3). A subsequent independent replication cohort confirmed both direction and effect size for the top 2 SNPs, rs795484 and rs 1277441. Imputation at the TAOK3 region identified 29 additional variants (E-supplement) associated with morphine requirement [45]. Significantly, minor allele variants showed clear gene dose effects (Figure 3) and, with regard to the interrelated ≥7/10 postoperative pain outcome, minor allele frequencies were enriched in both AA and EC cohorts. (Table 4) Finally, we show mechanistic plausibility of TAOK3 regulating pain/analgesic pathways.
4.2. Study population and GWAS methodology
GWAS mandates strict phenotypic definitions; management of confounding variables through population selection, regression analyses, and pertinent covariate inclusion; large sample sizes to find and measure associations with significance; and replication cohorts to validate findings. We chose unequivocal phenotypes for which we could accurately retrieve retrospective data and drew on a common surgical population [55]. With procedure and preexisting pain proven to influence postoperative pain and analgesic consumption [25], we studied pain-free, opioid-naïve children undergoing a single surgery. As seen in our study, ethnic background can alter postoperative analgesic requirement, [9,58,72] and because genetic structure differences can lead to spurious associations, [50,52] we conducted separate GWAS analyses by race. We found no gender differences and while gender may affect opioid requirement [4,15,24], morphine-specific differences may be limited to adults and/or ≥ 4 h drug exposure [48]. Anxiety and psychological distress increase postoperative pain and analgesic consumption in adults [25], but pain-sensitive temperament [34] plays a variable role in pediatrics and, for children recovering from T&A, in-hospital total analgesic dosages are independent of preoperative anxiety [29] leading us to believe that absence of study subject psychological measures was of minor consequence. Finally, there was no correlation between postoperative oxycodone administration and acute morphine requirement, consistent with primary morphine titration and with delayed effects of oral oxycodone following pediatric surgery [36].
Regression analyses left age, BMI, and physical status as EC primary outcome GWAS covariates, together accounting for 9.1% of phenotypic variation. Because morphine dose was measured in mg/kg, an adjustment for age and growth is fundamentally incorporated into outcome. Other studies have used height-based adjustments, which in the case of warfarin contribute to 30% of maintenance dose variability [7]. Choosing standard weight-based units for morphine administration, we included BMI as a covariate, accounting for dosing toward ideal body weight. The 2.0 kg/m2 BMI difference between EC and AA discovery cohort subjects contributed 5 mcg/kg (37%) to the race-related morphine requirement difference. Children of higher physical status were dosed more conservatively with an average decrement of 11.6 mcg/kg per physical status category.
4.3. Allelic effect size
Typical for GWAS discoveries the TAOK3 locus effect size is small and consistent with a single component of a polygenic quantitative trait [51]. The top two SNPs at TAOK3 explained 8.0% of morphine dose variance, comparable to that portion of variance attributed to age, BMI, and physical status combined. For postoperative pain in children, the response to opioid analgesia is undoubtedly polygenic [42], with each locus contributing limited effect as seen for experimental pain [18]. The gene-dose effect shown in Figure 3 supports an additive model wherein each minor allele increases morphine requirement by 11.4%. For minor allele homozygotes, this constitutes ∼35 mcg/kg of morphine that could be administered earlier, thereby reducing postoperative pain and analgesic titration need. The genetic effect of TAOK3 eclipses known candidate gene-associated contributions in our study population, but demonstrates similar magnitude to increased postoperative morphine requirements (22.2% over 24 h and 58.4% over 48 h) in adults homozygous for the OPRM1 A118G minor allele [11,12]. Inheritance pattern, cumulative dose phenotype and agonist-specific differences are important in comparing effect sizes, however. For example, in a recessive model, rs 2952768-associated minor variants near methyltransferase like 21A and cyclic adenosine 3′,5′-monophosphate (cAMP) responsive element binding protein are associated with a > 250% increase in fentanyl requirement over 24 h [49].
4.4. Potential mechanisms of action
TAOK3, cDNA cloned in 1999, encodes the serine/threonine-protein kinase thousand and one amino acid protein 3, TAO3 [64]. TAO3 is a member of the large and diverse Ste20 subfamily of mammalian kinases [17]. Located in the cytoplasm and cell membrane, it is ubiquitously expressed at low levels and highly expressed in the thymus and spleen and in peripheral blood leukocytes [64,69]. TAO kinases have been shown to acutely function as mitogen-activated protein kinase kinase kinases (MAP3Ks) regulating the p38 stress-activated mitogen-activated protein kinase (MAPK) cascade, the c-jun n-terminal/stress-activated protein kinase cascade (JNK), and the extracellular regulated kinase pathway ERK1/ERK2 [57,64,70].
TAO3 may be similar to known pain/analgesic-modulating proteins within serine/threonine kinase domains such as those in the MAPK cascade [68] and protein kinase C family [71]. Opioid receptors, particularly the MOR, play central roles in morphine-induced analgesia [38,67], and the established molecular mechanisms of MOR-dependent signaling [1] and MOR functional selectivity [56] highlight several points at which the molecular pharmacologies of MOR and TAO3 could intersect. The MOR has > 15 serine/threonine residues accessible to protein kinases [1,39,56,67], with several essential for normal receptor function [6,37,59]. Morphine-specific multisite phosphorylation at the 375STANT379 motif of individual MORs [37] and hierarchical phosphorylation of S375-flanking threonines [28] are emerging as important mechanisms driving differential ß-arrestin decoding, endocytic activity, and ligand-directed signaling. TAO3 variants could alter MOR phosphorylation patterns, promote MOR desensitization, and yield morphine-resistant phenotypes. Furthermore, MOR activation affects multiple MAPK pathways each with its own phosphorylation patterns and potential for TAO3 regulation [1,38,56,67].
Although GWAS methodology does not assure causal variant identification, the known function of TAO3 and its potential interactions with pain and MOR/agonist-MOR signaling pathways highlights TAOK3 as a likely new candidate gene. The regional association plot for rs795484 (Figure 4) demonstrates that VSIG10, PEBP1, and SUDS3) could contribute to phenotype and that TAOK3 SNP could regulate the transcription of WD repeat and SOCS box containing 2 (WSB2) and kinase suppressor of ras 2 (KSR2). However, none of their known functions, which include regulation of oncologic processes and the ubiquitin-modified proteome, is compelling.
4.5. Study limitations
This retrospective study is subject to selection bias, unknown population heterogeneities, pain measurement variations, and temporal change. We acknowledge the biases associated with our inclusion/exclusion criteria and also with the simple generosity of those who provided blood specimens for unspecified future CAG investigations. However, in comparison with prospective studies that might bring increased recruitment of subjects with special interest in pain/analgesia, our retrospective approach may provide more objective data on pain and morphine administration. Our design favored discovery of morphine resistant associations: in excluding children who received naloxone, we excluded those perhaps most sensitive to morphine and, because study subjects had an average of 88.2 mcg/kg intraoperative morphine, we likely ascribed higher doses to some who might have had adequate pain control with less. Most importantly, to minimize bias, we included all CAG database cases that survived strict phenotyping and only then conducted GWAS analyses.
Our study is small by GWAS standards and only capable of screening for loci with larger genetic effects. GWAS significance based on conventionally corrected p-values is difficult to achieve in pharmacogenomics [16], and like us, other researchers have used composite evidence and replicative study designs, such as a consecutive three-stage analysis, to validate subthreshold pharmacogenomic associations [49]. Discovery effect size may overestimate effect magnitude, but our comparable replication cohort results and bias-reduced ß calculations [61] are suggestive of only a minor “winners curse” phenomenon. With no child having postsurgical pain assessments in the absence of morphine, it is impossible to determine whether TAOK3 directly influences pain, morphine analgesia, or both. Finally, our principal finding is most relevant to children of EC ancestry, and we reiterate the importance of conducting studies in multiple racial/ethnic cohorts.
4.6. Summary
This first exploratory GWAS in a pediatric day surgery population demonstrates nominal associations between rs795484 and rs1277441 at the TAOK3 locus and total morphine requirement in EC children. Contributing an 11.4% dose increase per minor allele, the significance of this locus is further supported by increased minor allele frequency in both EC and AA subjects with high maximum postoperative pain. Our data are consistent with a polygenic model of morphine response variability and indicate that, at least within this population, common variants with larger effect sizes are unlikely to be found. A prospective study with larger sample sizes and pharmacokinetic profiles will be essential to further validate these findings, distinguish pharmacokinetic versus pharmacodynamic effects, assure better testing in each racial cohort, and reveal associations of smaller magnitude. The molecular pharmacology behind TAOK3 variant-associated effects – specifically, whether phosphorylation patterns of the MOR and/or other signaling proteins are altered – remains to be explored.
Supplementary Material
Acknowledgments
We wish to thank the patients and their families for participating in our study. Dr. Jin Li contributed as co-first author in data analysis and manuscript preparation. We thank Lisa Morse, data analyst for the Department of Anesthesiology and Critical Care Medicine, for compiling data from Compurecord (Phillips Medical Systems, Andover, MA, USA.) Carole A. Marcus, M.D., Professor of Pediatrics, Department of Pediatrics, Division of Pulmonary Medicine, kindly provided us with access to and interpretation of the CHOP Sleep Laboratory database. Research assistants Renata Pellegrino, PhD., and Tiancheng Wang from the Center for Applied Genomics were invaluable for their help in completing the Taqman assays (Life Technologies, Carlsbad, CA, USA). Finally, we gratefully recognize the help of Professor Gordon Barr, PhD., Associate Professor Lynne G. Maxwell, M.D., Clinical Professor Alan Jay Schwartz, M.D., and Assistant Professor Paul A. Stricker, M.D. from the Department of Anesthesiology and Critical Care Medicine for their thoughtful review and suggestions in preparing the manuscript. All acknowledged are staff members at the Children's Hospital of Philadelphia (Philadelphia, PA, USA.) Funding provided by The Department of Anesthesiology and Critical Care Medicine through Children's Anesthesia Associates, Ltd. (Philadelphia, PA, USA) and by The Children's Hospital of Philadelphia (Philadelphia, PA, USA) through a grant from the Institutional Development Fund to The Center for Applied Genomics.
Footnotes
Attributions: Department of Anesthesiology and Critical Care Medicine and the Center for Applied Genomics at the Children's Hospital of Philadelphia, Department of Anesthesiology and Critical Care, Perelman School of Medicine at the University of Pennsylvania
Conflict of interest statement: The authors have no conflicts of interest to report.
Publisher's Disclaimer: This is a PDF file of an unedited manuscript that has been accepted for publication. As a service to our customers we are providing this early version of the manuscript. The manuscript will undergo copyediting, typesetting, and review of the resulting proof before it is published in its final citable form. Please note that during the production process errors may be discovered which could affect the content, and all legal disclaimers that apply to the journal pertain.
Contributor Information
Scott D. Cook-Sather, Department of Anesthesiology and Critical Care, The Perelman School of Medicine at the University of Pennsylvania, Department of Anesthesiology and Critical Care Medicine, The Children's Hospital of Philadelphia.
Jin Li, Center for Applied Genomics, Abramson Research Center, The Children's Hospital of Philadelphia.
Theodora K. Goebel, Department of Anesthesiology and Critical Care Medicine, The Children's Hospital of Philadelphia.
Emily M. Sussman, Department of Anesthesiology and Critical Care Medicine The Children's Hospital of Philadelphia.
Mohamed A. Rehman, Department of Anesthesiology and Critical Care, The Perelman School of Medicine at the University of Pennsylvania, Director of Hospital Information Management, Department of Anesthesiology and Critical Care Medicine, The Children's Hospital of Philadelphia.
Hakon Hakonarson, The Perelman School of Medicine at the University of Pennsylvania, Director, Center for Applied Genomics, The Children's Hospital of Philadelphia.
References
- 1.Al-Hasani R, Bruchas M. Molecular mechanisms of opioid receptor-dependent signaling and behavior. Anesthesiology. 2011;115:1363–81. doi: 10.1097/ALN.0b013e318238bba6. [DOI] [PMC free article] [PubMed] [Google Scholar]
- 2.Angst M, Phillips N, Drover D, Tingle M, Ray A, Swan G, Lazzeroni L, Clark J. Pain sensitivity and opioid analgesia: A pharmacogenomics twin study. PAIN. 2012;153:1397–1409. doi: 10.1016/j.pain.2012.02.022. [DOI] [PMC free article] [PubMed] [Google Scholar]
- 3.Aubrun F, Langeron O, Quesnel C, Coriat P, Riou B. Relationships between measurement of pain using visual analog score and morphine requirements during postoperative intravenous morphine titration. Anesthesiology. 2003;98:1415–21. doi: 10.1097/00000542-200306000-00017. [DOI] [PubMed] [Google Scholar]
- 4.Aubrun F, Salvi N, Coriat P, Riou B. Sex and age-related differences in morphine requirements for postoperative pain relief. Anesthesiology. 2005;103:156–60. doi: 10.1097/00000542-200507000-00023. [DOI] [PubMed] [Google Scholar]
- 5.Aubrun F, Mazoit J, Riou B. Postoperative intravenous morphine titration. Br J Anaesth. 2012;108:193–201. doi: 10.1093/bja/aer458. [DOI] [PubMed] [Google Scholar]
- 6.Befort K, Filliol D, Decaillot F, Gaveriaux-Ruff C, Hoehe M, Kieffer B. A single nucleotide polymorphic mutation in the human mu-opioid receptor severely impairs receptor signaling. J Biol Chem. 2001;276:3130–7. doi: 10.1074/jbc.M006352200. [DOI] [PubMed] [Google Scholar]
- 7.Biss T, Avery P, Brandao L, Chalmers E, Williams M, Grainger J, Leathart J, Hanley J, Daly A, Kamali F. VKORC1 and CYP2C9 genotype and patient characteristics explain a large proportion of the variability in warfarin dose requirement among children. Blood. 2012;119:868–73. doi: 10.1182/blood-2011-08-372722. [DOI] [PubMed] [Google Scholar]
- 8.Brown K, Laferriere A, Lakheeram I, Moss I. Recurrent hypoxemia in children is associated with increased analgesic sensitivity to opiates. Anesthesiology. 2006;105:665–9. doi: 10.1097/00000542-200610000-00009. [DOI] [PubMed] [Google Scholar]
- 9.Cepeda M, Farrar J, Roa J, Boston R, Meng Q, Ruiz F, Carr D, Strom B. Ethnicity influences morphine pharmacokinetics and pharmacodynamics. Clin Pharmacol Ther. 2001;70:351–61. [PubMed] [Google Scholar]
- 10.Chapman C, Hill H, Saeger L, Gavrin J. Profiles of opioid analgesia in humans after intravenous bolus administration: Alfentanil, fentanyl, and morphine compared on experimental pain. PAIN. 1990;43:47–55. doi: 10.1016/0304-3959(90)90049-J. [DOI] [PubMed] [Google Scholar]
- 11.Chou W, Wang C, Liu P, Liu C, Tseng C, Jawan B. Human opioid receptor A118G polymorphism affects intravenous patient-controlled analgesia morphine consumption after total abdominal hysterectomy. Anesthesiology. 2006;105:334–7. doi: 10.1097/00000542-200608000-00016. [DOI] [PubMed] [Google Scholar]
- 12.Chou W, Yang L, Lu H, Ko J, Wang C, Lin S, Lee T, Concejero A, Hsu C. Association of mu-opioid receptor gene polymorphism (A118G) with variations in morphine consumption for analgesia after total knee arthroplasty. Acta Anaesthesiol Scand. 2006;50:787–92. doi: 10.1111/j.1399-6576.2006.01058.x. [DOI] [PubMed] [Google Scholar]
- 13.Cooper G, Johnson J, Langaee T, Feng H, Stanaway I, Schwarz U, Ritchie M, Stein C, Roden D, Smith J, Veenstra D, Rettie A, Rieder M. A genome-wide scan for common genetic variants with a large influence on warfarin maintenance dose. Blood. 2008;112:1022–7. doi: 10.1182/blood-2008-01-134247. [DOI] [PMC free article] [PubMed] [Google Scholar]
- 14.Coulbault L, Beaussier M, Verstuyft C, Weickmans H, Dubert L, Tregouet D, Descot C, Parc Y, Lienhart A, Jaillon P, Becquemont L. Environmental and genetic factors associated with morphine response in the postoperative period. Clin Pharmacol Ther. 2006;79:316–24. doi: 10.1016/j.clpt.2006.01.007. [DOI] [PubMed] [Google Scholar]
- 15.Dahan A, Kest B, Waxman A, Sarton E. Sex-specific responses to opiates: Animal and human studies. Anesth Analg. 2008;107:83–95. doi: 10.1213/ane.0b013e31816a66a4. [DOI] [PubMed] [Google Scholar]
- 16.Daly A. Genome-wide association studies in pharmacogenomics. Nat Rev Genet. 2010;11:241–6. doi: 10.1038/nrg2751. [DOI] [PubMed] [Google Scholar]
- 17.Delpire E. The mammalian family of sterile 20p-like protein kinases. Pflugers Arch Eur J Physiol. 2009;458:953–67. doi: 10.1007/s00424-009-0674-y. [DOI] [PubMed] [Google Scholar]
- 18.Doehring A, Kusener N, Fluhr K, Neddermeyer T, Schneider G, Lötsch J. Effect sizes in experimental pain produced by gender, genetic variants, and sensitization procedures. PLoS ONE. 2011;6:e17724. doi: 10.1371/journal.pone.0017724. [DOI] [PMC free article] [PubMed] [Google Scholar]
- 19.Duedahl T, Hansen E. A qualitative systematic review of morphine treatment in children with postoperative pain. Paediatr Anaesth. 2007;17:756–74. doi: 10.1111/j.1460-9592.2007.02213.x. [DOI] [PubMed] [Google Scholar]
- 20.Hakonarson H, Grant S, Bradfield J, Marchand L, Kim C, Glessner J, Grabs R, Casalunovo T, Taback S, Frackelton E, Lawson M, Robinson L, Skraban R, Lu Y, Chiavacci R, Stanley C, Kirsch S, Rappaport E, Orange J, Monos D, Devoto M, Qu H, Polychronakos C. A genome-wide association study identifies KIAA0350 as a type 1 diabetes gene. Nature. 2007;448:591–4. doi: 10.1038/nature06010. [DOI] [PubMed] [Google Scholar]
- 21.Hamilton G, Baskett T. In the arms of Morpheus: The development of morphine for postoperative pain relief. Can J Anesth. 2000;47:367–74. doi: 10.1007/BF03020955. [DOI] [PubMed] [Google Scholar]
- 22.Hicks C, Von Baeyer C, Spafford P, Van Korlaar I, Goodenough B. The faces pain scale-revised: Toward a common metric in pediatric pain measurement. PAIN. 2001;93:173–83. doi: 10.1016/S0304-3959(01)00314-1. [DOI] [PubMed] [Google Scholar]
- 23.Howie B, Donnelly P, Marchini J. A flexible and accurate genotype imputation method for the next generation of genome-wide association studies. PLos Genet. 2009;5:e1000529. doi: 10.1371/journal.pgen.1000529. [DOI] [PMC free article] [PubMed] [Google Scholar]
- 24.Hurley R, Adams M. Sex, gender, and pain: An overview of a complex field. Anesth Analg. 2008;107:309–17. doi: 10.1213/01.ane.0b013e31816ba437. [DOI] [PMC free article] [PubMed] [Google Scholar]
- 25.Ip H, Abrishami A, Peng P, Wong J, Chung F. Predictors of postoperative pain and analgesic consumption: A qualitative systematic review. Anesthesiology. 2009;111:657–77. doi: 10.1097/ALN.0b013e3181aae87a. [DOI] [PubMed] [Google Scholar]
- 26.Janicki P, Schuler G, Francis D, Bohr A, Gordin V, Jarzembowski T, Ruiz-Velasco V, Mets B. A genetic association study of the functional A118G polymorphism of the human mu-opioid receptor gene in patients with acute and chronic pain. Anesth Analg. 2006;103:1011–7. doi: 10.1213/01.ane.0000231634.20341.88. [DOI] [PubMed] [Google Scholar]
- 27.Janicki P, Vealey R, Liu J, Escajeda, Postula M, Welker K. Genome-wide association study using pooled DNA to identify candidate markers mediating susceptibility to postoperative nausea and vomiting. Anesthesiology. 2011;115:54–64. doi: 10.1097/ALN.0b013e31821810c7. [DOI] [PubMed] [Google Scholar]
- 28.Just S, Illing S, Trester-Zedlitz M, Lau E, Kototowski S, Miess E, Mann A, Doll C, Trinidad J, Burlingame A, von Zastrow M, Schulz S. Differentiation of opioid drug effects by hierarchical multi-site phosphorylation. Mol Pharmacol. 2013;83:633–9. doi: 10.1124/mol.112.082875. [DOI] [PMC free article] [PubMed] [Google Scholar]
- 29.Kain Z, Mayes L, Caldwell-Andrews A, Karas D, McClain B. Preoperative anxiety, postoperative pain, and behavioral recovery in young children undergoing surgery. Pediatrics. 2006;118:651–8. doi: 10.1542/peds.2005-2920. [DOI] [PubMed] [Google Scholar]
- 30.Kart T, Christrup L, Rasmussen M. Recommended use of morphine in neonates, infants and children based on a literature review: Part 1--pharmacokinetics. Paediatr Anaesth. 1997;7:5–11. doi: 10.1046/j.1460-9592.1997.d01-30.x. [DOI] [PubMed] [Google Scholar]
- 31.Kart T, Christrup L, Rasmussen M. Recommended use of morphine in neonates, infants and children based on a literature review: Part 2 --Clinical use. Paediatr Anaesth. 1997;7:93–101. doi: 10.1111/j.1460-9592.1997.tb00488.x. [DOI] [PubMed] [Google Scholar]
- 32.Kim H, Clark D, Dionne R. Genetic contributions to clinical pain and analgesia: Avoiding pitfalls in genetic research. J Pain. 2009;10:663–93. doi: 10.1016/j.jpain.2009.04.001. [DOI] [PMC free article] [PubMed] [Google Scholar]
- 33.Kim H, Ramsay E, Lee H, Wahl S, Dionne R. Genome-wide association study of acute postsurgical pain in humans. Pharmacogenomics. 2009;10:171–9. doi: 10.2217/14622416.10.2.171. [DOI] [PMC free article] [PubMed] [Google Scholar]
- 34.Kleiber C, Suwanraj M, Dolan L, Berg M, Kleese A. Pain-sensitive temperament and postoperative pain. J Spec Pediatr Nurs. 2007;12:149–58. doi: 10.1111/j.1744-6155.2007.00108.x. [DOI] [PubMed] [Google Scholar]
- 35.Klepstad P, Dale O, Skorpen F, Borchgrevink P, Kaasa S. Genetic variability and clinical efficacy of morphine. Acta Anaesthesiol Scand. 2005;7:902–8. doi: 10.1111/j.1399-6576.2005.00772.x. [DOI] [PubMed] [Google Scholar]
- 36.Kokki H, Rasanen I, Reinikainen M, Suhonon P, Vanamo K, Ojanpera I. Pharmacokinetics of oxycodone after intravenous, buccal, intramuscular, and gastric administration in children. Clin Pharmacokinet. 2004;43:613–22. doi: 10.2165/00003088-200443090-00004. [DOI] [PubMed] [Google Scholar]
- 37.Lau E, Trester-Zedlitz M, Trinidad J, Kotowski S, Krutchinsky A, Burlingame A, von Zastrow M. Quantitative encoding of the effect of a partial agonist on individual opioid receptors by multisite phosphorylation and threshold detection. Science Signaling. 2011;4ra52:1–12. doi: 10.1126/scisignal.2001748. [DOI] [PMC free article] [PubMed] [Google Scholar]
- 38.Law P. Opioid receptor signal transduction mechanisms. In: Pasternak GW, editor. The Opiate Receptors. 2nd. New York: Springer Science + Business Media, LLC; 2011. pp. 195–238. [Google Scholar]
- 39.Lötsch J, Geisslinger G. Are mu-opioid receptor polymorphisms important for clinical opioid therapy? Trend Mol Med. 2005;11:82–9. doi: 10.1016/j.molmed.2004.12.006. [DOI] [PubMed] [Google Scholar]
- 40.Lötsch J, Geisslinger G. Current evidence for a genetic modulation of the response to analgesics. PAIN. 2006;121:1–5. doi: 10.1016/j.pain.2006.01.010. [DOI] [PubMed] [Google Scholar]
- 41.Lötsch J, Mogil J. Genetics of opioid actions. In: Pasternak GW, editor. The Opiate Receptors. 2nd. New York: Springer Science + Business Media, LLC; 2011. pp. 457–497. [Google Scholar]
- 42.Mamie C, Rebsamen M, Morris M, Morabia A. First evidence of a polygenic susceptibility to pain in a pediatric cohort. Anesth Analg. 2013;116:170–7. doi: 10.1213/ANE.0b013e31826f0637. [DOI] [PubMed] [Google Scholar]
- 43.Manolio T. Genomewide association studies and assessment of the risk of disease. N Engl J Med. 2010;363:166–76. doi: 10.1056/NEJMra0905980. [DOI] [PubMed] [Google Scholar]
- 44.Marchini J, Howie B, Myers S, McVean G, Donnelly P. A new multipoint method for genome-wide association studies by imputation of genotypes. Nat Genet. 2007;39:906–13. doi: 10.1038/ng2088. [DOI] [PubMed] [Google Scholar]
- 45.Marchini J, Howie B. Genotype imputation for genome-wide association studies. Nat Rev Genet. 2010;11:499–511. doi: 10.1038/nrg2796. [DOI] [PubMed] [Google Scholar]
- 46.Meissner K, Kharasch E. Pain and anesthesia. In: Altman RB, Flockhart D, Goldstein DB, editors. Principles of Pharmacogenetics and Pharmacogenomics. 1st. New York/Cambridge: Cambridge University Press; pp. 2012pp. 224–237. [Google Scholar]
- 47.Merkel S, Voepel-Lewis T, Shayevitz J, Malviya S. The FLACC: A behavioral scale for scoring postoperative pain in young children. Pediatr Nurs. 1997;23:293–7. [PubMed] [Google Scholar]
- 48.Niesters M, Dahan A, Kest B, Zacny J, Stijnen T, Aarts L, Sarton E. Do sex differences exist in opioid analgesia? A systematic review and meta-analysis of human experimental and clinical studies. PAIN. 2010;151:61–8. doi: 10.1016/j.pain.2010.06.012. [DOI] [PubMed] [Google Scholar]
- 49.Nishizawa D, Fukuda K, Kasai S, Hasegawa J, Aoki Y, Nishi A, Saita N, Koukita Y, Nagashima M, Katoh R, Satoh Y, Tagami M, Higuchi S, Ujike H, Ozaki N, Inada T, Iwata N, Sora I, Iyo M, Kondo N, Won M, Naruse N, Uehara-Aoyama K, Itokawa M, Koga M, Arinami T, Kaneko Y, Hayashida M, Ikeda K. Genome-wide association study identifies potent locus associated with human opioid sensitivity. Mol Psych. 2012:1–8. doi: 10.1038/mp.2012.164. [DOI] [PMC free article] [PubMed] [Google Scholar]
- 50.Novembre J, Johnson T, Bryc K, Kutalik Z, Boyko A, Auton A, Indap A, King K, Bergmann S, Nelson M, Stephens M, Bustamante C. Genes mirror geography within Europe. Nature. 2008;456:98–101. doi: 10.1038/nature07331. [DOI] [PMC free article] [PubMed] [Google Scholar]
- 51.Plomin R, Hayworth C, Davis O. Common disorders are quantitative traits. Nat Rev Genet. 2009;10:872–8. doi: 10.1038/nrg2670. [DOI] [PubMed] [Google Scholar]
- 52.Price A, Zaitlen N, Reich D, Patterson N. New approaches to population stratification in genome-wide association studies. Nat Rev Genet. 2010;11:459–63. doi: 10.1038/nrg2813. [DOI] [PMC free article] [PubMed] [Google Scholar]
- 53.Pruim R, Welch R, Sanna S, Teslovich T, Chines P, Gliedt T, Boehnke M, Abecasis G, Willer C. LocusZoom: Regional visualization of genome-wide association scan results. Bioinformatics. 2010;26:2336–7. doi: 10.1093/bioinformatics/btq419. [DOI] [PMC free article] [PubMed] [Google Scholar]
- 54.Purcell S, Neale B, Todd-Brown K, Thomas L, Ferreria M, Bender D, Maller J, Sklar P, de Bakker P, Daly M, Sham P. PLINK: A tool set for whole-genome association and population-based linkage analyses. Am J Hum Genet. 2007;81:559–75. doi: 10.1086/519795. [DOI] [PMC free article] [PubMed] [Google Scholar]
- 55.Rabbitts J, Groenewald C, Moriarty J, Flick R. Epidemiology of ambulatory anesthesia for children in the United States: 2006 and 1996. Anesth Analg. 2010;111:1011–5. doi: 10.1213/ANE.0b013e3181ee8479. [DOI] [PubMed] [Google Scholar]
- 56.Raehal K, Schmid C, Groer C, Bohn L. Functional selectivity at the μ-opioid receptor: Implications for understanding opioid analgesia and tolerance. Pharmacol Rev. 2011;63:1001–19. doi: 10.1124/pr.111.004598. [DOI] [PMC free article] [PubMed] [Google Scholar]
- 57.Raman M, Earnest S, Zhang K, Zhao Y, Cobb M. TAO kinases mediate activation of p38 in response to DNA damage. EMBO J. 2007;26:2005–14. doi: 10.1038/sj.emboj.7601668. [DOI] [PMC free article] [PubMed] [Google Scholar]
- 58.Sadhasivam S, Chidambaran V, Ngamprasertwong P, Esslinger H, Prows C, Zhang X, Martin L, McAuliffe J. Race and unequal burden of perioperative pain and opioid related adverse effects in children. Pediatrics. 2012;129:832–8. doi: 10.1542/peds.2011-2607. [DOI] [PMC free article] [PubMed] [Google Scholar]
- 59.Schulz S, Mayer D, Pfeiffer M, Stumm R, Koch T, Hoellt V. Morphine induces terminal μ-opioid receptor desensitization by sustained phosphorylation of serine-375. EMBO J. 2004;23:3282–9. doi: 10.1038/sj.emboj.7600334. [DOI] [PMC free article] [PubMed] [Google Scholar]
- 60.Somogyi A, Barratt D, Coller J. Pharmacogenetics of opioids. Clin Pharmacol Ther. 2007;81:429–44. doi: 10.1038/sj.clpt.6100095. [DOI] [PubMed] [Google Scholar]
- 61.Sun L, Dimitromanolakis A, Faye L, Paterson A, Waggot D. The DCCT/EDIC Research Group Bull S. BR-squared: a practical solution to the winner's curse in genome-wide scans. Hum Genet. 2011;129:545–52. doi: 10.1007/s00439-011-0948-2. [DOI] [PMC free article] [PubMed] [Google Scholar]
- 62.Sweeney B. Pharmacogenomics and anaesthesia: Explaining the variability in response to opiates. Eur J Anaesthesiol. 2007;24:209–12. doi: 10.1017/s0265021506002316. [DOI] [PubMed] [Google Scholar]
- 63.Takeuchi M, Mcginnis R, Bourgeois S, Barnes C, Eriksson N, Soranzo N, Whittaker P, Ranganath V, Kumanduri V, McLaren W, Holm L, Lindh J, Rane A, Wadelius M, Deloukas P. A genome-wide association study confirms VKORC1, CYP2CP, and CYP4F2 as principal genetic determinants of warfarin dose. PLoS Genet. 2009;5:e1000433. doi: 10.1371/journal.pgen.1000433. [DOI] [PMC free article] [PubMed] [Google Scholar]
- 64.Tassi E, Biesova Z, Di Fiore P, Gutkind J, Wong W. Human JIK, a novel member of the STE20 kinase family that inhibits JNK and is negatively regulated by epidermal growth factor. J Biol Chem. 1999;274:33287–95. doi: 10.1074/jbc.274.47.33287. [DOI] [PubMed] [Google Scholar]
- 65.Visscher P, Brown M, McCarthy M, Yang J. Five years of GWAS discovery. Am J Hum Genet. 2012;90:7–24. doi: 10.1016/j.ajhg.2011.11.029. [DOI] [PMC free article] [PubMed] [Google Scholar]
- 66.Voepel-Lewis T, Burke C, Jeffreys N, Malviya S, Tait A. Do 0-10 numeric rating scores translate into clinical meaningful pain measures for children? Anesth Analg. 2011;112:415–21. doi: 10.1213/ANE.0b013e318203f495. [DOI] [PubMed] [Google Scholar]
- 67.Waldhoer M, Bartlett S, Whistler J. Opioid receptors. Annual Rev Biochem. 2004;73:953–90. doi: 10.1146/annurev.biochem.73.011303.073940. [DOI] [PubMed] [Google Scholar]
- 68.Widman C, Gibson S, Jarpe M, Johnson G. Mitogen-activated protein kinase: Conservation of a three-kinase module from yeast to human. Physiol Rev. 1999;79:143–80. doi: 10.1152/physrev.1999.79.1.143. [DOI] [PubMed] [Google Scholar]
- 69.Yustein J, Xia L, Kahlenburg J, Robinson D, Templeton D, Kung H. Comparative studies of a new subfamily of human Ste20-like kinases: homodimerization, subcellular location, and selective activation of MKK3 and p38. Oncogene. 2003;22:6129–41. doi: 10.1038/sj.onc.1206605. [DOI] [PubMed] [Google Scholar]
- 70.Zhang W, Chen T, Wan T, He L, Li N, Yuan Z, Cao X. Cloning of DPK, a novel dendritic cell-derived protein kinase activating the ERK1/ERK2 and JNK/SAPK pathways. Biochem Biophys Res Commun. 2000;274:872–9. doi: 10.1006/bbrc.2000.3244. [DOI] [PubMed] [Google Scholar]
- 71.Zhao C, Leitges M, Gereau IVR. Isozyme-specific effects of protein kinase C in pain modulation. Anesthesiology. 2011;115:1261–70. doi: 10.1097/ALN.0b013e3182390788. [DOI] [PMC free article] [PubMed] [Google Scholar]
- 72.Zhou H, Sheller J, Nu H, Wood M, Wood A. Ethnic differences in response to morphine. Clin Pharmacol Ther. 1993;54:507–13. doi: 10.1038/clpt.1993.182. [DOI] [PubMed] [Google Scholar]
Associated Data
This section collects any data citations, data availability statements, or supplementary materials included in this article.