Abstract
Despite the well known role of nucleotide oligomerization domain (NOD) receptor proteins in innate immunity, their association with diabetes is less explored. Here we report the transcriptional level of NODs and their downstream molecular signatures in CD14+ monocytes from subjects with different grades of glucose tolerance. NOD1 and NOD2 mRNA expression were significantly up-regulated in monocytes from patients with type 2 diabetes (T2DM) and positively correlated with HOMA-IR and poor glycemic control. Patients with T2DM also exhibited increased monocyte activation markers (CD11b and CD36) and proinflammatory signals downstream of NOD (RIPK2 and NFκB) along with the increased circulatory levels of TNF-α and IL-6. In vitro stimulation of monocytes with NOD specific ligands-i-EDAP and MDP significantly up regulated the mRNA expression of NOD1 and NOD2 respectively in T2DM. Our study exposes up regulation of NODs in monocytes as an important component of inflammation and insulin resistance in patients with T2DM.
Keywords: Nucleotide oligomerization domain (NOD), Innate immunity, Insulin resistance, Type 2 diabetes, Inflammation
1. Introduction
Increasing evidences suggest that chronic low grade inflammation play an important role in the development of type 2 diabetes (T2DM). Though multiple links between metabolic and immune responses have emerged as a critical factor in the progression of insulin resistance, evidences are not adequate to delineate the specific immune elements which mediate the metabolic aberrations. Therefore it is important to decipher the intricate cross talk between innate immunity and metabolic signaling to identify new drug targets to combat insulin resistance and T2DM. A major step forward in this direction was the identification of pattern recognition receptors (PRRs) such as the toll like receptors (TLRs) in the association of inflammation with insulin resistance [1,2]. Though TLR4 has been shown to play a role in high-fat-diet-induced insulin resistance in mice [3], it is not the sole pathway by which fatty acids could affect insulin sensitivity [4]. In this regard, nucleotide binding oligomerization domain (NOD) like receptors (NLRs), the cytosolic proteins of the innate immunity are known to propagate inflammatory signals in response to peptidoglycan (PGN) [5,6]. NOD1 detects the peptidoglycan component, D-glutamyl-meso-diaminopimelic acid (meso-DAP) structure unique to gram-negative bacteria, whereas NOD2 detects muramyl dipeptide (MDP) found in both gram-negative and gram-positive strains [7,8]. NODs recognize these structures through the leucine rich repeat domain at the carboxy terminus [9,10] and activate common NFκB pathways similar to TLR4 [11,12]. However, polyubiquitination of receptor interacting protein kinase 2 (RIPK2, also called RIP2) is required for NFκB activation induced through NOD but not TLRs [13,14]. Mice deficient in NOD1/2 were shown to be protected against obesity induced inflammation and insulin resistance [15] and this has been substantiated by in vitro studies [16]. NLRP3 inflammasome has been shown to be a key element in the obesity induced inflammation in adipose tissue [17]. However, there is inadequate clinical evidence on the involvement of specific inflammasomes in relation to inflammation in T2DM. Therefore this study was carried out to analyze the level of NODs expression in monocytes from patients with T2DM and to investigate its association with glycemic status and insulin resistance.
2. Research design and methods
2.1. Study groups
Study subjects were recruited from the on-going epidemiology cohorts and from Dr. Mohan’s Diabetes Specialities Centre (DMDSC), a large tertiary diabetes care center at Chennai in southern India. Study group (n = 25 each) comprised of (a) subjects with normal glucose tolerance (NGT), (b) subjects with impaired glucose tolerance (IGT) and (c) patients with T2DM. Anthropometric measurements including weight, height, and waist, were obtained using standardized techniques as detailed elsewhere [18]. Subjects with fasting plasma glucose <5.5 mmol/l (100 mg/dl) and 2 h post glucose value <7.8 mmol/l (140 mg/dl) were considered as normal glucose tolerance (NGT) individuals. Those with 2 h post-glucose value ofP7.8mmol/L (140mg/dL) and ≤11.1 mmol/L (200 mg/dL) were diagnosed as IGT. Subjects who were confirmed by oral glucose tolerance test (OGTT) to have 2 h plasma glucose value ≥11.1 mmol/l [200 mg/dl] based on WHO consulting group criteria [19] were diagnosed as T2DM patients. Of the diabetic patients, 90% were on oral hypoglycemic agents (OHA) and 10% were on OHA plus additional insulin therapy for control of hyperglycemia. Institutional ethical committee approval was obtained for the study and informed consent was obtained from all the study subjects. Fasting plasma glucose (hexokinase method) was measured on Hitachi 912 Auto analyzer (Hitachi, Mannheim, Germany) using kits supplied by Roche Diagnostics (Mannheim, Germany). Glycated hemoglobin (HbA1C) was estimated by high-pressure liquid chromatography using the Variant machine (Bio-Rad, Hercules, Calif., USA). Serum cholesterol (cholesterol oxidase–peroxidase-amidopyrine method), serum triglycerides (glycerol phosphate oxidase–peroxidase-amidopyrine method) and HDL cholesterol (direct method-polyethylene glycol-pretreated enzymes) were measured using Hitachi-912 Autoanalyser (Hitachi, Mannheim, Germany). Low-density lipoprotein (LDL) cholesterol was calculated using the Friedewald formula. The intra and inter assay co-efficient of variation for the biochemical assays ranged between 3.1% and 7.6%. The laboratory is certified by the College of American Pathologists (CAP) and the National Accreditation Board for Testing and Calibration of Laboratories (NABL).
2.2. Monocyte isolation
Mononuclear cells were isolated from fasting heparinized blood by magnetic separation using Dynabeads® FlowComp™ Human CD14 monocyte isolation (Invitrogen, CA, USA) according to kit instructions. The purity of monocytes (Mean + SD) from the magnetic bead-based isolation as determined by flow cytometry was 95 ± 3.4%. Isolated monocytes were studied before and after activation for 16 h with endotoxin-free NOD1 (c12-iEDAP, Tri-DAP; 1 µg/ml) or NOD2 ligands (L18-MDP; 1 µg/ml) (Invivogen; San diego, USA) and lipopolysaccharide (LPS) (Escherichia coli, 100 ng/ml; Sigma Chemicals, St. Louis, MO).
2.3. THP-1 cell culture
The human monocyte cell line THP-1 was obtained from the National Centre for Cell Science (NCCS, Pune). THP-1 cells were maintained in endotoxin free RPMI-1640 medium containing 10% heat-inactivated fetal bovine serum, 100 U/ml penicillin, 100 µg/ml streptomycin, 2.5 µg/l amphotericin B, and 10 mM HEPES, pH 7.0–7.4, under a humidified condition of 5% CO2 at 37 °C. For in vitro experiments, 1 × 10⁶ cells were subjected to either 5.5 mM or 30 mM glucose treatment for 16 h in the absence or presence of iEDAP or MDP or LPS. In vitro measurements were done independently at least three times.
2.4. Real time PCR
RNA was extracted from monocytes using RNAspin mini RNA isolation kit (GE healthcare, Amersham, UK) according to the manufacturer’s instructions. 500 ng of RNA was reverse transcribed with M-MuLV reverse transcriptase (NEB) for quantitative real-time PCR analysis in an ABI 7000 RT-PCR system (Applied Biosystems) with appropriate cycle conditions. Negative controls (no template) were run as well to ensure the absence of contamination. Analysis was performed using 2−ddCt method and normalized to endogenous 18S ribosomal RNA control.
2.5. Cell surface expression of CD36 and CD11b
Monocyte activation was examined by analyzing the surface expression of activation markers CD11b and CD36 by flow cytometry. In brief, 3 ml of whole blood (n = 10 each)collected in EDTA tubes was lysed with 1:10 diluted BD FACS lysing solution (BD Biosciences, San Jose, CA) in 1× PBS. Subsequently the cells were fixed in 4% paraformaldehyde and staining was done with previously titrated volumes of FITC and PE conjugated antibodies. The antibodies used in the study were as follows: PE labeled antihuman CD14; FITC labeled antihuman CD11b and CD36 (eBioscience, San Diego, CA). Fluorescence was measured on a FACS Calibur (BD Biosciences, San Jose, CA) using 30,000 gated cells. The percentage of CD14+ cells for a particular molecule was calculated using Flow JO software (Treestar Inc., Ashland, OR, USA).
2.6. Measurement of TNF-α and IL-6
Circulating levels of TNF-α and IL-6 in the serum or culture supernatants were determined by quantitative sandwich Enzyme-linked immunosorbent assay (ELISA) (eBioscience, San Diego, CA). In brief, monoclonal antibody specific for TNF-α or IL-6 was coated over night onto a microplate. Standards or samples were added to the wells and an enzyme-linked polyclonal antibody specific for TNF-α or IL-6 was added to the wells after washing away any unbound substances. Following the addition of a substrate solution, the color development was read at 450 nm. The intra and inter assay coefficients of variation were <5 and <10%, respectively.
2.7. Statistical analysis
Comparison between groups was performed using one-way ANOVA (with Tukey honestly significant difference test). Pearson correlation analysis was carried out to determine the relation of NODs with other risk variables. Regression analysis was done to determine the association of NOD with clinical parameters. All analyses were done using Windows-based SPSS statistical package (Version 10.0, Chicago, IL), and P < 0.05 were taken as significant.
3. Results
Clinical and biochemical characteristics of the study subjects are illustrated in Table 1. There were no significant differences in age and BMI among the groups. Fasting as well as post prandial glucose levels were significantly higher in patients with T2DM and subjects with IGT compared to NGT (p < 0.001). HbA1c (p < 0.001) and insulin resistance (p < 0.001) (as evident by HOMA-IR) values were significantly higher in T2DM. There were no significant differences in the lipid profile among the study groups.
Table 1.
Clinical characteristics of the study subjects.
| Parameters | NGT (n = 25) | IGT (n = 25) | T2DM (n = 25) |
|---|---|---|---|
| Age (years) | 43 ± 9 | 44 ± 9 | 49 ± 8 |
| BMI (kg/m2) | 27.1 ± 4.5 | 28.5 ± 4.2 | 28.6 ± 4.3 |
| Waist circumference | 92.8 ± 11 | 93.9 ± 12 | 100 ± 12.4 |
| Fasting plasma glucose (mg/dl) | 94.3 ± 8.7 | 101.3 ± 15* | 155.3 ± 42*,# |
| Post prandial plasma glucose (mg/dl) | 110.6 ± 24 | 164 ± 17* | 272.1 ± 73*,# |
| HbA1c (%) | 5.7 ± 0.3 | 6.2 ± 0.5 | 8.8 ± 2*,# |
| HOMA-IR | 1.6 ± 0.9 | 1.92 ± 1.0 | 4.6 ± 2.8*,# |
| Serum cholesterol (mg/dl) | 178.5 ± 31 | 176.2 ± 25 | 181 ± 36 |
| Serum triglycerides (mg/dl) | 135.2 ± 75 | 137.1 ± 59 | 145.6 ± 56 |
| LDL Cholesterol (mg/dl) | 109 ± 30 | 111.3 ± 19 | 112 ± 30 |
| HDL Cholesterol (mg/dl) | 41.8 ± 8.3 | 37.5 ± 6 | 40.9 ± 7.2 |
p < 0.05 Compared to NGT.
p < 0.05 Compared to IGT.
3.1. Increased expression of NOD1 and NOD2 in circulating monocytes from T2DM
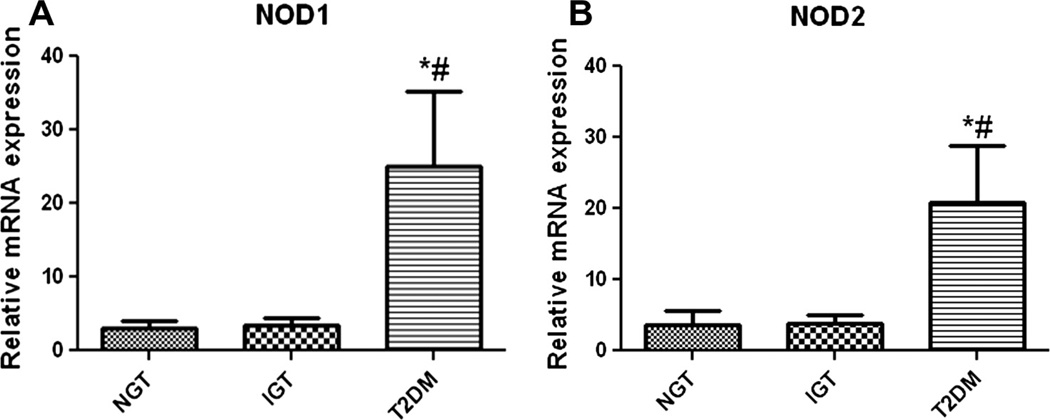
In monocytes from patients with T2DM, there was a significant (p < 0.05) transcriptional upregulation of NOD1 and NOD2 compared to monocytes from subjects with IGT and NGT (Fig. 1). mRNA expression of NODs showed a significant positive correlation with HOMA-IR, HbA1c and fasting as well as post plasma glucose levels (p ≤ 0.05) (Table 2). NOD1 and NOD2 expression was also positively correlated with age (p < 0.01) and waist circumference (p < 0.05). Multiple logistic regression analysis was done using type 2 diabetes as the dependent variable and NODs as independent variables. NOD1 [Odds Ratio [OR] 1.782; 95% CI: 1.177–2.698; p < 0.006] and NOD2 Odds Ratio [OR] 1.239; 95% CI: 1.054– 1.456; p < 0.009] showed a significant association with T2DM even after adjusting for age and waist circumference. Interestingly when adjusted for insulin resistance, this association was lost implying that the link between NODs and diabetes originates from proin-flammation that underlie the insulin resistant state.
Fig. 1.
NOD1 and NOD2 mRNA expression. Realtime quantitative PCR analysis on the expression of NOD1 (A) and NOD2 (B) mRNA in CD14+ monocytes from subjects with normal glucose tolerance (NGT), impaired glucose tolerance (IGT) and type 2 diabetes (T2DM). mRNA level was quantified after normalizing with endogenous 18S ribosomal RNA control. Data are expressed as Mean ± SE. *p < 0.05 compared to NGT, #p < 0.05 compared to IGT.
Table 2.
Pearson correlation analysis of NOD1/2 with other risk variables.
| Variables | NOD1 | NOD2 | ||
|---|---|---|---|---|
| r | p | r | p | |
| Age | 0.293 | 0.028 | 0.196 | 0.046 |
| Waist circumference | 0.345 | 0.016 | 0.119 | 0.031 |
| BMI | 0.131 | 0.365 | 0.025 | 0.875 |
| Fasting plasma glucose | 0.353 | 0.008 | 0.428 | 0.003 |
| Post prandial plasma glucose | 0.534 | 0.002 | 0.542 | 0.001 |
| HbA1c | 0.37 | 0.006 | 0.443 | 0.003 |
| HOMA-IR | 0.245 | 0.050 | 0.267 | 0.045 |
3.2. Increased expression of RIPK2 and proinflammatory transcription factors in monocytes from T2DM
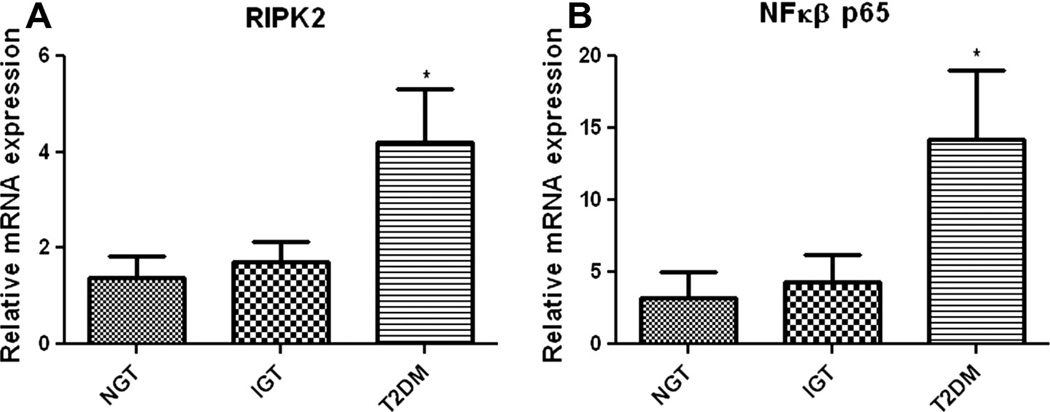
Since RIPK2 is a critical mediator of NOD1/2 signaling and an important trigger for NFκB-mediated proinflammatory responses, we then probed the mRNA expression of RIPK2 and NFκB, downstream of NODs. Both mRNA expression of RIPK2 (Fig. 2A) and NFκB (Fig. 2B) were significantly (p < 0.05) up regulated in monocytes from T2DM compared to other groups. IGT group showed a trend in increased expression of RIPK2 and NFκB albeit it was not statistically significant.
Fig. 2.
mRNA expression of inflammatory mediators. Real time PCR analysis showing the increased mRNA expression of RIPK2 (A) and NFκβ (B) in monocytes from the study subjects. mRNA level was quantified after normalizing with endogenous 18S ribosomal RNA control. Data are expressed as Mean ± SE.*p < 0.05 compared to NGT.
3.3. Increased monocyte activation in patients with T2DM
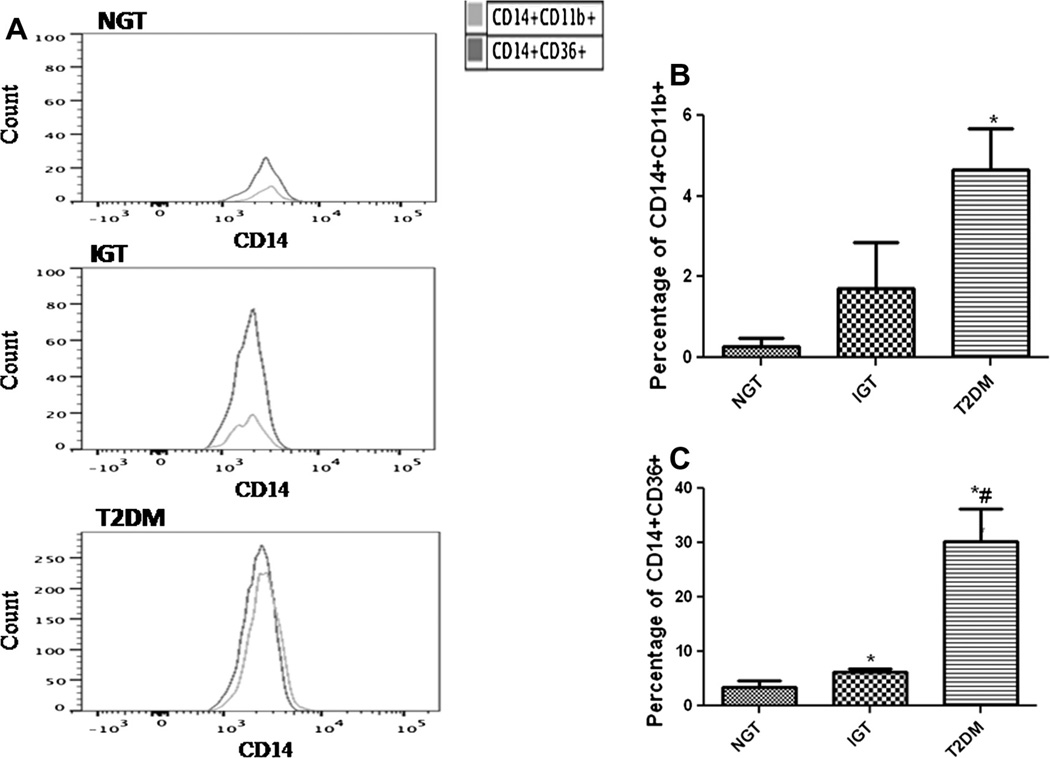
We further analyzed the expression levels of monocyte activation markers in the study subjects by flow cytometry. The expression of CD11b was significantly higher in monocytes from T2DM (p < 0.05) when compared to NGT and IGT (Fig. 3A). The expression of scavenger receptor CD36 in monocytes from T2DM and IGT were significantly (p < 0.05) and progressively higher when compared to NGT (Fig. 3B).
Fig. 3.
CD11b and CD36 expression on monocytes. (A) Representative flow cytometry analysis showing the expression of CD11b and CD36 as an overlaying histogram. Cumulative data on the percentage of CD14+ monocytes expressing CD11b (B) and CD36 (C) in the study subjects (n = 10 each). Data are represented as the Mean ± SE. *p < 0.05 compared to NGT, #p < 0.05 compared to IGT.
3.4. High glucose induced NOD expression in human monocytes
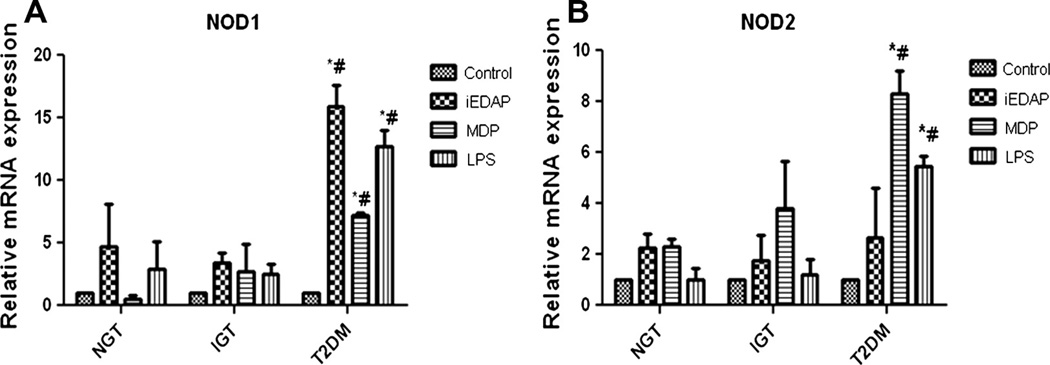
The differential activation of NODs among the subjects with different grades of glucose tolerance was determined after in vitro stimulation of circulatory monocytes with NOD specific ligands. When monocytes were challenged with either iEDAP or MDP, they exhibited high mRNA expression of NOD1/2 in patients with T2DM compared to other two groups (p < 0.05). Similar to NOD specific ligands, LPS also induced the expression of NODs (Fig. 4A and B).
Fig. 4.
In vitro analysis showing the expression of NOD1 and NOD2 mRNA in monocytes. Bars represent the mRNA expression of NOD1 (A) and NOD2 (B) in monocytes untreated or treated with iEDAP, MDP and LPS for 16 h. mRNA level was quantified after normalizing with endogenous 18S ribosomal RNA control. Data are represented as Mean ± SE (n = 5 each). *p < 0.01 compared to NGT, #p < 0.01 compared to IGT.
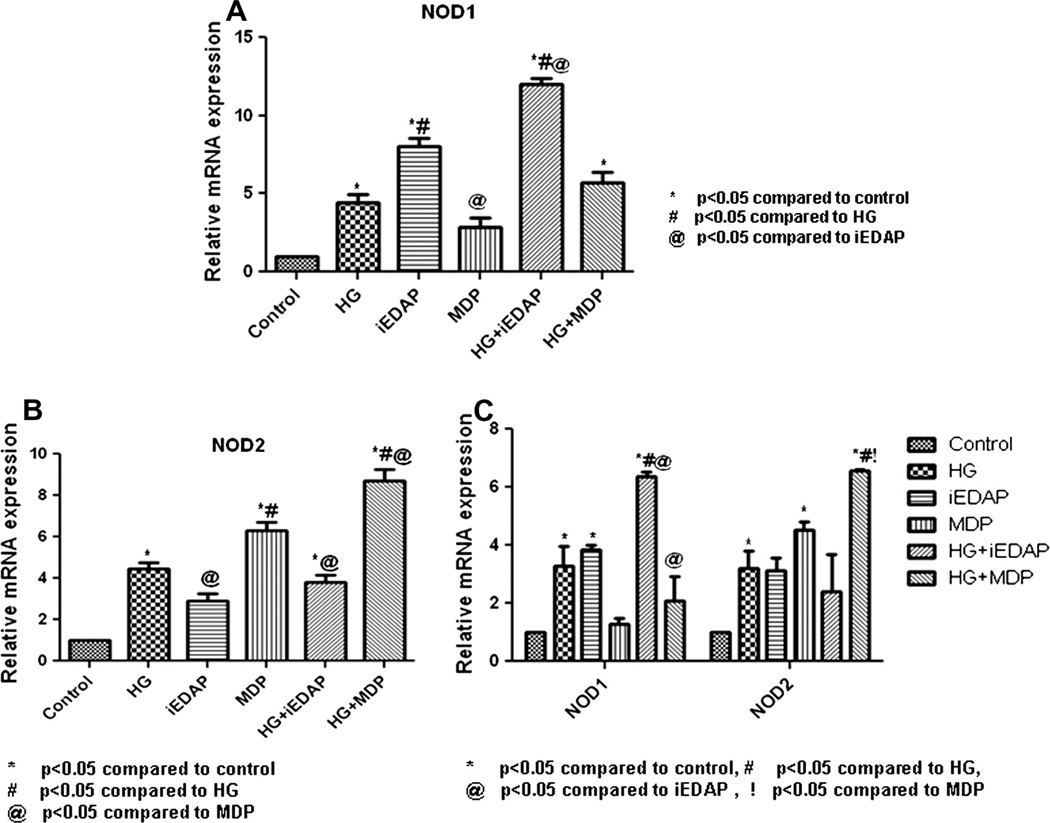
As there was an up regulated expression of NODs in monocytes from patients with T2DM, next we analyzed whether high glucose activates NOD expression. Interestingly, when freshly isolated monocytes from the healthy volunteers were treated with high glucose for 16 h, it showed significant (p < 0.05) up regulation of both NOD1/2 mRNA expression (Fig. 5A and B). Moreover, high glucose augmented the NOD-ligand mediated mRNA expression of both NOD1 and NOD2 in monocytes (p < 0.05). Data was further verified in vitro on THP-1 monocyte cell line, where high glucose not only increased the NOD expression, but it also augmented the NOD-ligand mediated increases in NOD1/2 mRNA expression (p < 0.05) (Fig. 5C).
Fig. 5.
High glucose stimulates the mRNA expression of NOD1 and NOD2. High glucose (30 mM) increased the mRNA expression of NOD1/2 and significantly augmented the iEDAP mediated expression of NOD1 (A) MDP mediated expression of NOD2 (B) in monocytes from healthy volunteers (n = 5). The effect was further verified by in vitro analysis on THP-1 monocytes (C). Data represents the mean ± SEM.
3.5. Serum and cell supernatant TNF-α and IL 6 levels among the study groups
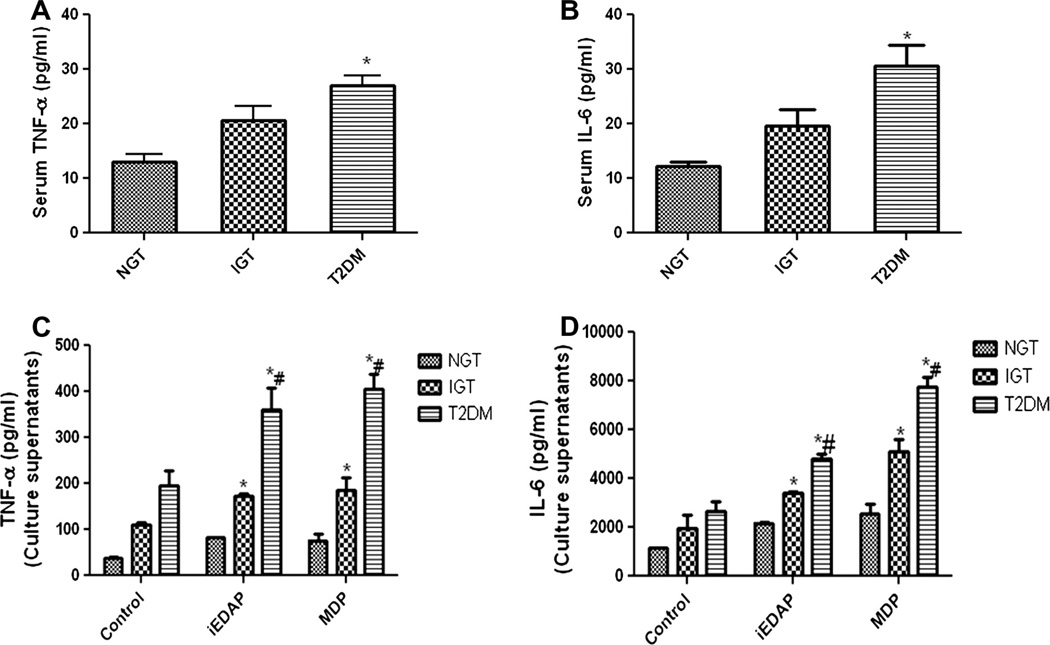
Next we have analyzed the serum samples for circulatory levels of inflammatory cytokines, TNF-α and IL-6 which is the most sensitive systemic indicators of inflammation often considered to be implicated in the genesis of diabetes and its complications. Levels of both TNF-α (Fig. 6A) and IL-6 (Fig. 6B) were significantly higher in the serum samples of T2DM (TNF: 27 ± 10.9; IL-6: 30 ± 23.55) compared to IGT (TNF: 20.63 ± 13.97; IL-6: 19.16 ± 14.8) and NGT (TNF: 12.9 ± 9.08; IL-6: 12.3 ± 3.6).
Fig. 6.
TNF-α, IL-6 levels in the serum and culture supernatants. ELISA showing the increased levels of serum TNF-α and IL-6 in the study subjects (A and B). Levels of TNF-α and IL-6 in the culture supernatants when monocytes from the study subjects were stimulated with NOD ligands (C and D). Data are expressed as Mean ± SD. *p < 0.05 compared to NGT; #p < 0.05 compared to IGT.
TNF-α and IL-6 levels in the culture supernatants of in vitro treated monocytes were higher in patients with T2DM (iEDAP stimulated; TNF-α 360.03 ± 47.3, IL-6 4792.3 ± 157.9: MDP stimulated; TNF-α 405.9 ± 32.3, IL-6-7773.6 ± 123.6) compared to NGT (iEDAP stimulated; TNF-α 82.11 ± 26.3, IL-6–2177.7 ± 85.9: MDP stimulated; TNF-α 76.35 ± 13.02, IL-6-2568.7 ± 102.3) and IGT which showed a significantly increased level of TNF-α (iEDAP stimulated 174.15 ± 3.08 MDP stimulated 184.95 ± 27.75) and IL-6 (iEDAP stimulated 3403.63 ± 78.56 MDP stimulated 5108.7 ± 89.5) when compared to NGT (Fig. 6C and D).
4. Discussion
Although the mechanisms by which T2DM develop are still not clearly understood, there is growing evidence that chronic, low-grade inflammation may play a role in promoting the development of this disease. While recent studies imply a role for aberrant activation of the innate immune system in metabolic disorders such as T2DM, there is scant clinical evidence on the involvement of specific inflammasomes. In this context, our study attains significance for the following reasons: (1) This is the first clinical demonstration of elevated NOD1 and NOD2 expression in monocytes from patients with T2DM; (2) The downstream target of NODs viz., RIPK and NFκB were also upregulated in patients with type diabetes. (3) Elevated levels of NODs were positively correlated to poor glycemic control and insulin resistance.
Available literature evidences suggest that insulin resistance in the context of T2DM can be associated with chronic low-level inflammation, with innate immunity constituents such as pattern recognition receptors (PRRs) implicated in this pathophysiology. However, there is paucity of data examining the role of NODs in diabetes. Our study demonstrated elevated mRNA expression of NODs in monocytes from T2DM which has been positively correlated to both insulin resistance and poor glycemic control. NOD1 ligand DAP has been shown to activate NFκB leading to IL-6 secretion in isolated human preadipocytes [20]. Schertzer et al. [15] have identified NLR family proteins as critical factors involved in HFD (high-fat diet)-induced inflammation and insulin resistance. More importantly, NOD1/2-double-KO mice were shown protected from HFD-induced insulin resistance. Treatment of 3T3-L1 adipocytes with DAP impaired insulin signaling and glucose uptake and this phenotype was specifically reverted by using NOD1 specific siRNAs (small interfering RNAs) [21]. Recent studies also suggest that activation of NLRP3 inflammasome leads to the maturation and secretion of interleukin IL-1β and is involved in the pathogenic mechanisms of obesity-induced inflammation, insulin resistance, and T2DM development [22,23]. Similarly, addition of NOD2 ligand MDP suppressed basal and insulin-stimulated glucose uptake in L6-GLUT4-myc myotubes [24]. Very recently, Lee et al. [25] have reported that monocytes derived from type 2 diabetic patients display elevated levels of both mRNA and protein expression of NLRP3. Taken together, these results imply a possible role for NODs in inflammation and insulin resistance.
In the present study, enhanced expression of immune receptor NOD1/2 is paralleled by activation of peripheral blood monocytes in patients with T2DM. Higher expression of CD11b (integrins) in T2DM substantiate the enhanced monocyte activation since it is the most important marker involved in monocyte activation. Resting monocytes constitutively express integrins which are the important signal transducers for virtually all monocyte functions and new copies of CD11b are translocated to the cell surface from granules upon activation [26]. Increased CD11b expression on monocytes have been reported previously in patients with type 1 diabetes and leukocytes of T2DM [27,28]. In addition to CD11b, T2DM patients showed elevated expression of CD36, which is a scavenger receptor that binds to oxidized LDL to induce proinflammation through NFκB. Elevated expression of CD36 has been reported previously in T2DM [29] and it has been reported as a biomarker for monocyte activation in T2DM [30].
In addition to the elevated expression of NOD1/2, our study also demonstrated increased expression of downstream signaling mediators RIPK2 and NFκB in monocytes from patients with T2DM. Stimulation of NOD1/2 by their specific bacterial ligands causes the recruitment of RIPK2, a caspase recruitment domain containing kinase (CARD), which then directly binds to Iκβ kinase (IKK-γ) to activate NFκB for pro-inflammation [11,12]. In embryoblast derived from mice deficient in RIPK2, transfection of plasmids expressing NOD1/2 could not activate NFκB, suggesting that RIPK2 is critical for signaling via NOD1/2 [31]. Moreover, RIPK2 participates in innate immunity specifically by mediating NOD1/2 signaling but not TLR mediated immune responses [14].
Another intriguing observation from our study is the augmentation of NOD1/2 mRNA expression by high glucose in monocytes from healthy volunteers. Glucose showed a synergistic effect with NOD ligands by augmenting ligand-mediated expression of NOD1/2. The data was further validated in vitro on THP-1 cells, which is a well characterized human monocyte cell line. Although it is not clear how glucose could activate NOD expression, non bacterial molecules like lauric acid [32] and DMXAA [33] have been shown to activate NOD. In this context, glucose has been shown to induce TLR2/4 expression via PKC-α and PKC-δ, respectively by stimulating NADPH oxidase in human monocytes [34]. Although the interplay between NADPH oxidase and NOD is unclear, it is possible that high glucose could modulate ROS (reactive oxygen species) production and thereby trigger NOD mediated inflammation. In pancreatic islets it has been shown that glucose activates NOD via ROS – sensitive TXNIP (Thioredoxin interacting protein) [35]. We have also demonstrated earlier that lymphocytes from patients with T2DM and subjects with prediabetes exhibited increased TXNIP mRNA expression which was positively associated with protein oxidation and gene expression patterns of IL-6, TNF-α, and NADPH oxidase [36]. Therefore, glucose-mediated cellular triggers could be the denominators that differentially regulate PRRs including NODs and even contribute to the cross-talk among the different receptors involved in proinflammatory responses. Since NODs are also the key regulators linking microbiota to intestinal mucosal immunity [37], aberrant NOD alterations might result in microbiota dysbiosis which is emerging as a contributing factor in the development of metabolic diseases including T2DM [38].
To conclude, our demonstration of increased NOD1 and NOD2 expression in monocytes from patients with type 2 diabetes assumes clinical significance as this could also explain the underlying pro-inflammation and higher insulin resistance status in Asian Indians. Future research to identify explicit molecular mechanism of immune-metabolic interactions that lead to organ dysfunction from chronic inflammatory damage and development of specific NOD modulators may pave the way for novel strategies to manage type 2 diabetes and its complications.
Acknowledgments
Authors thank the financial assistance from the Department of Science and Technology (DST-WOSA), Department of Biotechnology (DBT), New Delhi and the seed money grant from MIRF (Madras Diabetes Research Foundation intra mural research funding). We thank Ms. R. Anuradha and Mr. Q. Sajid from the National Institutes of Health-International Center for Excellence in Research, Chennai, India for their assistance with FACS analysis.
Abbreviations
- HbA1C
glycated hemoglobin
- HOMA
homeostasis assessment model
- iEDAP
γ-d-glutamyl-meso diaminopimelic acid
- IGT
impaired glucose tolerance
- IL-6
interleukin-6
- MDP
muramyl dipeptide
- NFκβ
nuclear factor kappa beta
- NGT
normal glucose tolerance
- NOD
nucleotide binding oligomerization domain
- OR
odds ratio
- PGN
peptidoglycan
- PRR
pattern recognition receptor
- RIPK2
receptor interacting protein kinase 2
- T2DM
type 2 diabetes mellitus
- TLR
toll like receptor
- TNF-α
tumor necrosis factor – alpha.
References
- 1.Shi H, Kokoeva M, Inouye K, Tzameli I, Yin H, Flier J. TLR4 links innate immunity and fatty acid-induced insulin resistance. J Clin Invest. 2006;116:3015–3025. doi: 10.1172/JCI28898. [DOI] [PMC free article] [PubMed] [Google Scholar]
- 2.Nakamura T, Furuhashi M, Cao PLH, Tuncman G, Sonenberg N, Gorgun C, et al. Double-stranded RNA-dependent protein kinase links pathogen sensing with stress and metabolic homeostasis. Cell. 2010;140:338–348. doi: 10.1016/j.cell.2010.01.001. [DOI] [PMC free article] [PubMed] [Google Scholar]
- 3.Tsukumo DML, Carvalho-Filho MA, Carvalheira JBC, Prada PO, Hirabara SM, Schenka AA, et al. Loss-of-function mutation in toll like receptor 4 prevents diet-induced obesity and insulin resistance. Diabetes. 2007;56:1986–1998. doi: 10.2337/db06-1595. [DOI] [PubMed] [Google Scholar]
- 4.Radin MS, Sinha S, Bhatt BA, Dedousis N, ODoherty RM. Inhibition or deletion of the lipopolysaccharide receptor toll like receptor-4 confers partial protection against lipid-induced insulin resistance in rodent skeletal muscle. Diabetologia. 2007;51:336–346. doi: 10.1007/s00125-007-0861-3. [DOI] [PubMed] [Google Scholar]
- 5.Girardin S, Boneca I, Carneiro L, Antignac A, Jehanno M, Viala J, et al. NOD1 detects a unique muropeptide from gram-negative bacterial peptidoglycan. Science. 2003;300:1584–1587. doi: 10.1126/science.1084677. [DOI] [PubMed] [Google Scholar]
- 6.Anstett MM, Muller P, Albrecht T, Nega M, Wagener J, Gao Q, et al. Staphylococcal peptidoglycan co-localizes with Nod2 and TLR2 and activates innate immune response via both receptors in primary murine keratinocytes. PloS One. 2010;5:e13153. doi: 10.1371/journal.pone.0013153. [DOI] [PMC free article] [PubMed] [Google Scholar]
- 7.Carneiro LAM, Travassos L, Philpott DJ. Innate immune recognition of microbes through Nod1 and Nod2: implications for disease. Microbes Infect. 2004;6:609–616. doi: 10.1016/j.micinf.2004.01.012. [DOI] [PubMed] [Google Scholar]
- 8.Carneiro LAM, Magalhaes JG, Tattoli I, Philpott DJ, Travassos LH. Nod-like proteins in inflammation and disease. J Pathol. 2008;214:136–148. doi: 10.1002/path.2271. [DOI] [PubMed] [Google Scholar]
- 9.Chamaillard M, Girardin S, Viala J, Philpott D. Nods, Nalps and Naip: intracellular regulators of bacterial-induced inflammation. Cell Microbiol. 2003;5:581–592. doi: 10.1046/j.1462-5822.2003.00304.x. [DOI] [PubMed] [Google Scholar]
- 10.Inohara N, Nunez G. NODs: intracellular proteins involved in inflammation and apoptosis. Nat Rev Immunol. 2003;3:371–382. doi: 10.1038/nri1086. [DOI] [PubMed] [Google Scholar]
- 11.Inohara N, Koseki T, Lin J, del Peso L, Lucas P, Chen F, et al. An induced proximity model for NF-kappa B activation in the Nod1/RICK and RIP signaling pathways. J Biol Chem. 2000;275:27823–27831. doi: 10.1074/jbc.M003415200. [DOI] [PubMed] [Google Scholar]
- 12.Abbott DW, Andrew W, Asara MJ, Cantley CL. The crohns disease protein, Nod2, Requires Rip2 in order to induce ubiquitinylation of a novel site on nemo. Curr Biol. 2004;14:2217–2227. doi: 10.1016/j.cub.2004.12.032. [DOI] [PubMed] [Google Scholar]
- 13.Yibin Y, Yin C, Pandey A, Abbott D, Sassetti C, Kelliher M. Nod2 pathway activation by MDP or mycobacterium tuberculosis infection involves the stable polyubiquitination of Rip2. J Biol Chem. 2007;282:36223–36229. doi: 10.1074/jbc.M703079200. [DOI] [PubMed] [Google Scholar]
- 14.Park JH, Kim YG, McDonald C, Kanneganti T, Hasegawa M, Malapel MB, et al. Rick/Rip2 mediates innate immune responses induced through Nod1 and Nod2 but not TLRs. J Immunol. 2007;178:2380–2386. doi: 10.4049/jimmunol.178.4.2380. [DOI] [PubMed] [Google Scholar]
- 15.Schertzer J, Tamrakar A, Magalhaes J, Pereira S, Bilan P, Fullerton M, et al. Nod1 activators link innate immunity to insulin resistance. Diabetes. 2011;60:2206–2215. doi: 10.2337/db11-0004. [DOI] [PMC free article] [PubMed] [Google Scholar]
- 16.Zhou R, Yazdi A, Menu P, Tschopp J. A role for mitochondria in Nlrp3 inflammasome activation. Nature. 2011;469:221–225. doi: 10.1038/nature09663. [DOI] [PubMed] [Google Scholar]
- 17.Vandanmagsar B, Youm Y, Ravussin A, Galgani J, Stadler K, Mynatt R, et al. The Nlrp3 inflammasome instigates obesity-induced inflammation and insulin resistance. Nat Med. 2011;17:179–188. doi: 10.1038/nm.2279. [DOI] [PMC free article] [PubMed] [Google Scholar]
- 18.Deepa M, Pradeepa R, Rema M, Mohan A, Deepa R, Shanthirani S, et al. The Chennai urban rural epidemiology study (CURES)–study design and methodology (urban component) (CURES-1) J Assoc Phys Ind. 2003;51:863–870. [PubMed] [Google Scholar]
- 19.Alberti K, Zimmet P. Definition, diagnosis and classification of diabetes mellitus and its complications. Part 1: diagnosis and classification of diabetes mellitus provisional report of a WHO consultation. Diabet Med. 1998;15:539–553. doi: 10.1002/(SICI)1096-9136(199807)15:7<539::AID-DIA668>3.0.CO;2-S. [DOI] [PubMed] [Google Scholar]
- 20.Stroh T, Batra A, Glauben R, Fedke I, Erben U, Kroesen A, et al. Nucleotide oligomerization domains 1 and 2: regulation of expression and function in preadipocytes. J Immunol. 2008;181:3620–3627. doi: 10.4049/jimmunol.181.5.3620. [DOI] [PubMed] [Google Scholar]
- 21.Zhao L, Hu P, Zhou Y, Purohit J, Hwang D. Nod1 activation induces proinflammatory gene expression and insulin resistance in 3T3-L1 adipocytes. Am J Physiol. 2011;301:587–598. doi: 10.1152/ajpendo.00709.2010. [DOI] [PubMed] [Google Scholar]
- 22.Nardo DD, Latz E. Nlrp3 inflammasomes link inflammation and metabolic disease. Trends Immunol. 2011;32:373–379. doi: 10.1016/j.it.2011.05.004. [DOI] [PMC free article] [PubMed] [Google Scholar]
- 23.Wen H, Gris D, Lei Y, Jha S, Zhang L, Huang M, et al. Fatty acid-induced Nlrp3-Asc inflammasome activation interferes with insulin signaling. Nat Immunol. 2011;12:408–415. doi: 10.1038/ni.2022. [DOI] [PMC free article] [PubMed] [Google Scholar]
- 24.Tamrakar A, Schertzer J, Chiu T, Foley K, Bilan P, Philpott D, et al. Nod2 activation induces muscle cell-autonomous innate immune responses and insulin resistance. Endocrinology. 2010;151:5624–5637. doi: 10.1210/en.2010-0437. [DOI] [PubMed] [Google Scholar]
- 25.Miller L, Bainton D, Borregaard N, Springer T. Stimulated mobilization of monocyte Mac-1 and P150,95 adhesion proteins from an intracellular vesicular compartment to the cell surface. J Clin Invest. 1987;80:535–544. doi: 10.1172/JCI113102. [DOI] [PMC free article] [PubMed] [Google Scholar]
- 26.Cifarelli V, Libman I, Deluca A, Becker D, Trucco M, Luppi P. Increased expression of monocyte Cd11b (Mac-1) in overweight recent-onset type 1 diabetic children. Rev Diabet Stud. 2007;4:112–117. doi: 10.1900/RDS.2007.4.112. [DOI] [PMC free article] [PubMed] [Google Scholar]
- 27.Van Oostrom AJ, Van Wijk J, Sijmonsma T, Rabelink T, Castro Cabezas M. Increased expression of activation markers on monocytes and neutrophils in type 2 diabetes. Neth J Med. 2004;62:320–325. [PubMed] [Google Scholar]
- 28.Cipolletta C, Ryan K, Hanna E, Trimble E. Activation of peripheral blood CD14+ monocytes occurs in diabetes. Diabetes. 2005;54:2779–2786. doi: 10.2337/diabetes.54.9.2779. [DOI] [PubMed] [Google Scholar]
- 29.Sun Y, Scavini M, Orlando R, Murata G, Servilla K, Tzamaloukas A, et al. Increased CD36 expression signals monocyte activation among patients with type 2 diabetes. Diabet Care. 2010;33:2065–2067. doi: 10.2337/dc10-0460. [DOI] [PMC free article] [PubMed] [Google Scholar]
- 30.Kobayashi K, Inohara N, Hernandez L, Galan J, Nunez G, Janeway C, et al. Rick/Rip2/Cardiak mediates signalling for receptors of the innate and adaptive immune systems. Nature. 2002;416:194–199. doi: 10.1038/416194a. [DOI] [PubMed] [Google Scholar]
- 31.Lee HM, Kim JJ, Kim H, Shong M, Ku B, Jo EK. Upregulated Nlrp3 inflammasome activation in patients with type 2 diabetes. Diabetes. 2013;62:194–204. doi: 10.2337/db12-0420. [DOI] [PMC free article] [PubMed] [Google Scholar]
- 32.Zhao L, Kwon MJ, Huang S, Lee J, Fukase K, Inohara N, et al. Differential modulation of NODs signaling pathways by fatty acids in human colonic epithelial Hct116 cells. J Biol Chem. 2007;282:11618–11628. doi: 10.1074/jbc.M608644200. [DOI] [PubMed] [Google Scholar]
- 33.Cheng G, Sun J, Fridlender ZG, Wang LC, Ching LM, Albelda S. Activation of the nucleotide oligomerization domain signaling pathway by the non-bacterially derived Xanthone drug 56-dimethylxanthenone-4-acetic acid (Vadimezan) J Biol Chem. 2010;285:10553–10562. doi: 10.1074/jbc.M109.065631. [DOI] [PMC free article] [PubMed] [Google Scholar]
- 34.Dasu M, Devaraj S, Zhao L, Hwang D, Jialal I. High glucose induces toll-like receptor expression in human monocytes: mechanism of activation. Diabetes. 2008;57:3090–3098. doi: 10.2337/db08-0564. [DOI] [PMC free article] [PubMed] [Google Scholar]
- 35.Zhou R, Tardivel A, Thorens B, Choi I, Tschopp J. Thioredoxin-interacting protein links oxidative stress to inflammasome activation. Nat Immunol. 2010;11:136–140. doi: 10.1038/ni.1831. [DOI] [PubMed] [Google Scholar]
- 36.Gokulakrishnan K, Mohanavalli K, Monickaraj F, Mohan V, Balasubramanyam M. Subclinical inflammation/oxidation as revealed by altered gene expression profiles in subjects with impaired glucose tolerance and type 2 diabetes patients. Mol Cell Biochem. 2009;324:173–181. doi: 10.1007/s11010-008-9996-x. [DOI] [PubMed] [Google Scholar]
- 37.Biswas A, Ocwieja TP, Kobayashi K. Nod2: a key regulator linking microbiota to intestinal mucosal immunity. J Mol Med. 2012;90:15–24. doi: 10.1007/s00109-011-0802-y. [DOI] [PMC free article] [PubMed] [Google Scholar]
- 38.Cani P, Osto M, Geurts L, Everard A. Involvement of gut microbiota in the development of low-grade inflammation and type 2 diabetes associated with obesity. Gut Microbes. 2012;3:279–288. doi: 10.4161/gmic.19625. [DOI] [PMC free article] [PubMed] [Google Scholar]


