

Abstract
A novel rhamnolipid biosurfactant-producing and Polycyclic Aromatic Hydrocarbon (PAH)-degrading bacterium Pseudomonas aeruginosa strain NY3 was isolated from petroleum-contaminated soil samples. Strain NY3 was characterized by its extraordinary capacity to produce structurally diverse rhamnolipids. A total of 25 rhamnolipid components and 37 different parent molecular ions, representing various metal ion adducts (Na+, 2Na+ and K+), were detected by matrix-assisted laser desorption ionization time-of-flight mass spectrometry. Among these compounds are ten new rhamnolipids. In addition to its biosurfactant production, strain NY3 was shown to be capable of efficient degradation of PAHs as well as synergistic improvement in the degradation of high molecular weight PAHs by its biosurfactant. These findings have added novel members to the rhamnolipid group and expanded current knowledge regarding the diversity and productive capability of rhamnolipid biosurfactants from a single specific strain with variation of only one carbon source. Additionally, this paper lays the foundation for improvement in the yield of NY3BS and study of the degradation pathway(s) of PAHs in P. aeruginosa strain NY3.
Keywords: P. aeruginosa, Carbon sources, Rhamnolipids, MALDI TOF MS, PAH degradation
1. Introduction
Biosurfactants are surface-active amphipathic metabolites produced by a variety of microorganisms which include bacteria, fungi and yeasts. Glycolipids, phospholipids, lipopeptides/lipoproteins, fatty acids and polymeric macromolecules are the main categories of structurally diverse biosurfactants (Desai and Banat, 1997). They are primarily produced by fermentation with renewable carbon sources, such as vegetable oils (Costa et al., 2006). Some cheaper raw materials and recycling substrates from agricultural operations, food processing and other industrial processes could be used for cost-effective biosurfactant production (Makkar and Cameotra, 2002; Nitschke et al., 2005, 2009; Monteiro et al., 2009). Their environmental compatibility, effectiveness at extremes of temperature, pH and salinity, and high specificity to targeted pathogens (Haba et al., 2000; Rivardo et al., 2009) make these biosurfactants attractive and desirable for widespread application.
If used for environmental bioremediation, biosurfactants hold great potential to decontaminate polluted water and soils (Mulligan, 2005; Shete et al., 2006). The biosurfactant from Bacillus circulans was capable of removing nearly the whole metal content at 5× its Critical Micelle Concentration (CMC) by chelating toxic heavy metals and forming an insoluble precipitate (Das et al., 2009). Biosurfactants from Pseudomonas spp. and Acinetobacter calcoaceticus BU03 improved bioavailability and degradation of toxic and carcinogenic pesticides (lindane and chlorpyrifos), petroleum hydrocarbons and polycyclic aromatic hydrocarbons (Singh et al., 2009; Sharma et al., 2009; Zhao and Wong, 2009).
Biosurfactants are diverse in their benefits and applications. When used in the food processing, cosmetic and pharmaceutical industries, biosurfactants have been included in formulations to serve as emulsifiers and solubilizers, as well as foaming, wetting, antiadhesive, antimicrobial and antiviral agents (Shete et al., 2006; Rodrigues et al., 2006a; Muthusamy et al., 2008). Rhamnolipid mixture RL47T2 from P. aeruginosa 47T2 NCBIM 40044 exhibited excellent activities toward Klebsiella pneumoniae CECT17832 and Enterobacter aerogenes CECT689 (Haba et al., 2000). The anti-adhesion activity of lipopeptide biosurfactants from Bacillus spp. was shown to prevent biofilm formation by bacterial human pathogens (Rivardo et al., 2009). Varnier and co-workers demonstrated a novel role for biosurfactant rhamnolipids in protecting grapevines from the fungal infection with Botrytis cinerea by triggering plant defense responses and directly inhibiting spore germination and mycelium growth (Varnier et al., 2009). If employed by the petrochemical industry, biosurfactants could play an important role in enhanced oil recovery and decontamination of oil spills (Shete et al., 2006; Wang et al., 2007; Bordoloi and Konwar, 2008; Pornsunthorntawee et al., 2008; Lotfabad et al., 2009). In agricultural applications, biosurfactants can serve as biocontrol agents. Rhamnolipids from the rhizosphere bacterium Pseudomonas spp. GRP were reported to reduce damping-off disease in chili and tomato nurseries (Sharma et al., 2007). Chemical surfactants (e.g.,Triton X-100, Tween 80 and sodium dodecyl sulphate) are petroleum-derived synthetic compounds. These are commonly toxic to health and ecosystems and resistant to complete degradation (Muthusamy et al., 2008; Frank et al., 2009). In contrast, biosurfactants are environmentally friendly, having little or no toxicity to humans and animals. They are not detrimental to microbial flora. Therefore, biosurfactants have been gaining attention in both academic researches and industrial developments worldwide.
Among the different classes of biosurfactants, rhamnolipids, members of the glycolipid group, are the most extensively studied and characterized (Desai and Banat, 1997; Muthusamy et al., 2008). Since rhamnolipids were first identified from Pseudomonas sp. (Jarvis and Johnson, 1949), chemical structures of some of these metabolites have been reported (Haussler et al., 1998; Déziel et al., 2000; Denekamp et al., 2000; Haba et al., 2000, 2003b; Gunther et al., 2005; Perfumo et al., 2006; Costa et al., 2006; Wang et al., 2007; Monteiro et al., 2007; Sharma et al., 2007; Pornsunthorntawee et al., 2008; Price et al., 2009; Rooney et al., 2009; Nitschke et al., 2009; Bordoloi and Konwar, 2009; Sarachat et al., 2010). An amphiphilic rhamnolipid molecule is composed of two moieties. One half is the hydrophilic sugar part, mono- or dirhamnose, and the hydrophobic lipid part possessing one or two fatty acid residues. These residues may either be both fully saturated or one may be saturated and the other unsaturated with either one or two double bonds. The lipid moiety is attached to the sugar by O-glycosidic linkage while the two 3-hydoxy acyl groups are joined together by the formation of an ester bond. The structural diversity of rhamnolipids is determined by the number of rhamnose (one or two) and fatty acid (one or two), and the fatty acid components. The length of the constituent fatty acids has been found to vary from C8 to C14 and their combinations identified as: C8–8, C8–C10, C10–C8, C8–C10:1, C8–C12:1, C12:1–C8, C10–C10, C10–C10:1, C10–C12, C12–C10, C10–C12:1, C12:1–C10, C10–C14:1, C14:1–C10, C12–C12, C12–C12:1, C12:1–C12, C12–C14, C12–C14:1, C14:1–C12, C14–C14. Several single fatty acid-containing rhamnolipid compounds were also identified (Déziel et al., 1999; Haba et al., 2003a,b; Perfumo et al., 2006). In addition, novel mono and dirhamnolipid methyl esters (Rha-C8-C8ME and Rha-Rha–C8–C8ME) were described (Hirayama and Kato, 1982). Rhamnolipids with alternative fatty acid chains were also reported (Desai and Banat, 1997). To date, over 40 different rhamnolipid components have been described, all having molecular masses below 800 Da. The Gram-negative opportunistic pathogenic bacteria Pseudomonas spp. were found to be the most common producers of rhamnolipids. Pseudomonas was also identified as one of the most frequently-isolated bacterial genera capable of degrading the PAHs which are characterized as carcinogenic, mutagenic and ubiquitous environmental organic pollutants (Zhao and Wong, 2009; Haritash and Kaushik, 2009). This report describes the isolation and characterization of strain NY3 and its rhamnolipid biosurfactant products and demonstrates the in vivo degradation of five polycyclic aromatic hydrocarbons by this strain.
2. Materials and methods
2.1. Chemicals
Pyrene (99%) was purchased from Sigma-Aldrich (Shanghai, China), phenanthrene from the Chemical Store of the Chinese Academy of Military Medical Sciences (Beijing, China), anthracene from Beijing Chemical Industry Co., fluorene (98%) from Johnson Matthey Co. (Shanghai, China) and fluoranthene from Tokyo Chemical Industry Co. (Shanghai, China). Unless otherwise stated, the organic solvents, media and medium ingredients, salts and acids were purchased from various suppliers (Sigma, VWR and Fisher, USA).
2.2. Screening and isolation of the biosurfactant-producing bacterial strains
Petroleum-contaminated soil samples collected from Shaanxi Province (China) were first suspended in a series of 10-fold dilutions of sterile water from 10−1 to 10−6 and plated on agar plates containing the Rhamnolipid Biosurfactant-Specific Screening Medium (RBSSM, per liter): 1 g beef extract, 20 g glucose, 5 g peptone, 0.2 g yeast extract, 0.2 g N,N,N,-trimethyl-1-hexadecane ammonium bromide, 0.005 g methyl blue and 18 g agar. The inoculated plates were incubated at 30 °C for 48 h. Colonies displaying the anionic biosurfactant-indicating blue coloration with halo around them (Siegmund and Wagner, 1991) were selected for further colony purification and confirmation on RBSSM agar plates. Isolated colonies were inoculated into the Biosurfactant Production Liquid Medium (BPLM, pH 7.4) to further confirm and evaluate their surface activities. BPLM was made from the stock solutions and selective carbon sources. BPLM (per liter) contains 5.0 ml phosphate buffer (per liter: 25.82 g K2HPO4.3 H2O, 8.7 g KH2PO4, 33.4 g Na2HPO4.12 H2O, 5.0 g NH4Cl), 3.0 ml magnesium sulfate solution (22.5 g/l MgSO4), 1.0 ml calcium chloride solution (36.4 g/l CaCl2), 1.0 ml ferric chloride solution (0.25 g/l FeCl3), 1.0 ml trace mineral elements containing MnSO4 (39.9 mg/l), ZnSO4.H2O (42.8 mg/l) and (NH4)6MoO24.4 H2O (34.7 mg/l), and one of the following carbon sources: 20 g glucose, 3 g beef extract, 0.2% diesel oil, 0.2% hexane and 0.2% octane (v/v). To measure the surface activity, the liquid cultures were placed in 250 ml Erlenmeyer flasks and incubated at 30 °C on a rotary shaker at 200 rpm. 5 ml culture samples were taken over time at 24, 48, 72 and 96 h. The pure culture, which produced the highest surface activity, was designated as strain NY3 and selected for full characterization.
2.3. Genomic DNA preparation, PCR amplification, DNA sequencing and analysis
For mini-preparation of genomic DNA, strain NY3 was grown in 10 ml Tryptone Soya Broth (TSB) medium at 30 °C for 16 h. Cells were harvested by centrifugation at 4 °C and 4000 rpm for 15 min (Beckman JS-21). The supernatant was discarded and the pellet was successively washed once with 10.3% sucrose and twice with 10 mM Tris.HCl and 1 mM disodium ethylenediaminetetra-acetate (EDTA), pH 8.0 (TE buffer). The wet cells, equivalent to the volume of 80 μl water, were distributed into 1.5 ml sterile micro-centrifuge tubes. After adding 300 μl of the lysis solution containing 200 μl of 10 mM Tris–HCl and 1 mM EDTA, pH 8.0 and 0.3 M Sucrose (TES buffer), 50 μl of 0.5 M EDTA, 50 μl of lysozyme (50 mg/ml), the tubes were incubated at 37 °C for 30 to 60 min until the solution became viscous. Next, 5 μl of proteinase K (20 mg/ml) and 180 μl of 10% sodium dodecyl sulfate (SDS) were added into each tube. After gentle but thorough mixing, the solutions were incubated at 37 °C for 90 min. Then, 80 μl of 10% Cetyl Trimethyl Ammonium Bromide (CTAB) were added. After thorough mixing, the tubes were incubated at 65 °C for 10 min. The solutions were extracted twice with 600 μl of phenol/chloroform/isoamyl alcohol (25/24/1). The genomic DNA in the upper aqueous phases were recovered and precipitated with 0.6 volume of isopropanol. The harvested genomic DNA was washed twice with 70% ethanol. After drying at room temperature for 10 min, the genomic DNA was dissolved in 50 to 100 μl of sterile water for use in PCR. The PCR reaction was conducted under conditions described previously (Yin et al., 2003) except for substitutions in the forward and reverse primers with fD1 and rD1 (Weisburg et al., 1991) as well as the addition of 1 μg of genomic DNA. Primers used for PCR and DNA sequencing were synthesized by Fisher. The PCR product from the agarose gel was purified using QIAquick Gel Extraction kits from Qiagen. DNA sequencing was performed at Oregon State University Center for Genome Research and Biocomputing (CGRB) using the Amplitaq dye-terminator sequencing system (Perkin Elmer) and Applied Biosystems automated DNA sequencers (models 373 and 377). Nucleotide sequences were determined for both strands. Sequence analysis was carried out using the VectorNTI (Invitrogen) software. Nucleotide sequence similarity comparisons were carried out in public databases using the BLAST program (Altschul et al., 1990). The 16S rRNA gene sequence of strain NY3 was deposited in GenBank under the accession number GU377209.
2.4. Culture conditions for growth of P. aeruginosa strain NY3 and production of NY3BS
Strain NY3 was permanently stocked in 20% glycerol solution at —70 °C and temporarily plated and maintained on a Luria–Bertani (LB) agar plate for fresh inoculation of liquid culture. We evaluated the growth of strain NY3 in a series of liquid and solid media available in our laboratories. They included the liquid media LB, 2×YT, TSB, YM, YGP and BHI, and the solid media LB, YM, ISP2, ISP4, AS1 and R2YE. Production of NY3 was affected by a number of factors including the concentration of the cells initially inoculated, the media, initial pH, metal ions, cultural temperature, shaking speed and harvest time. For routine production of NY3BS, P. aeruginosa strain NY3 was grown in BPLM broth, supplemented with either glucose (BPLMglu) or glycerol (BPLMgly) as the carbon source, at 30 °C on a rotary shaker at 200 rpm for 76 h.
2.5. Characterization of P. aeruginosa strain NY3
For strain characterization, all liquid cultures were inoculated in triplicate in 500 ml Erlenmeyer flasks containing 200 ml BPLM broth or its derivatives at 30 °C on a rotary shaker at 200 rpm. The initial pH values were varied from 2.0 to 10.0 in culture broth in order to determine the optimal pH range for NY3BS production. To determine the optimum carbon source for NY3BS production, glucose (20 g/L), beef extract (5 g/L), hexane (2 ml/L), octane (2 ml/L) and diesel oil (2 ml/L) were alternatively added into BPLM broth as the sole carbon source. Samples were taken at 0, 12, 24, 36, 48, 60, 72, 76, 84, 96 and 102 h for acquiring surface activity and other measurements.
2.6. Measurements of the surface activity of NY3BS
Three methods including oil displacement test, surface tension/critical micelle concentration and emulsification activity were employed to evaluate the surface-active properties of NY3BS using either cell free broth (supernatant) or pure NY3BS compounds. Oil displacement test was conducted as described by Rodrigues et al. (Rodrigues et al., 2006b). Briefly, a clear round glass plate (20×150 mm) was loaded with 10 ml distilled water and 0.5 ml Filippo Berio olive oil (purchased from Fred Meyer, Corvallis, Oregon) in the center and was followed by adding 100 μl supernatant in the center. The centrally located oil was then forced to displace towards the off-center directions while forming a clear oil zone. The concentration of biosurfactant added was proportional to the diameter of the clear zone. Surface tension was measured by using the maximum bubble pressure method (Kjellin et al., 2003). Based on the surface tension measurement, CMC was then obtained by the plot of surface tension and the serial concentration of NY3BS solutions. Emulsification activity was assessed by following Cooper and Goldenberg's protocol (Cooper and Goldenberg, 1987). In brief, a 15-ml graduated clear glass tube with screw cap was filled with 5 ml dimethylbenzene and 5 ml supernatant. After thorough mixing by vortexing at maximum speed for 2 min, the tube was left standing undisturbed at room temperature for 24 h. The height of the dimethylbenzene layer was measured and divided by the total height of dimethylbenzene and aqueous phases. The resulting ratio was multiplied by 100 to obtain the emulsification index E76, which was proportional to the emulsification activity. For the above measurements, cell free broths were freshly prepared from the NY3BS productive cultures at the time points of 24, 48, 68, 72, 76, 92 and 96 h, and the pure NY3BS was dissolved in deionized water at the concentration of 1 to 100 mg/L. All measurements were taken in triplicate to minimize the experimental errors and to generate averaged values.
2.7. Isolation and purification of NY3BS
500 ml of the production culture was harvested at 48 h by centrifugation at 4000 rpm (Beckman J2-MC) at 4 °C for 15 min to remove the cells. The supernatant was acidified to pH 2.0 with concentrated HCl and kept at 4 °C overnight. The precipitate was recovered by centrifugation at 4 °C and 12,000 rpm (Beckman J2-MC) for 30 min and then washed twice with aqueous HCl (pH 2.0). The precipitates were dissolved in 1 N NaOH and adjusted to pH 7.0. The solution was dried in lyophilizer. The crude preparation of NY3BS was further extracted twice with CH2Cl2 and dried with a rotary evaporator. After the powder was dissolved in 5 ml of 0.01 N NaOH, the solution was filtered with Whatman No.4 paper. The filtrate was collected and adjusted to pH 2.0 and then centrifuged at 4 °C and 12,000 rpm for 30 min. The pellet was dried with a rotary evaporator to obtain the pure biosurfactant NY3BS which was stored at —20 °C for further analysis.
2.8. Structural characterization of NY3BS
MALDI-TOF MS and tandem MS were employed to elucidate the structure of NY3BS. MS analysis was performed by Matrix-Assisted Laser Desorption/Ionization Time-Of-Flight (MALDI-TOF) mass spectrometry using an Applied Biosystems ABI4700 TOF/TOF mass spectrometer in reflector mode with an accelerating voltage of 20 kV. Samples were mixed in a 1:4 ratio with alpha-cyano-4-hydroxycinnamic acid (HCCA) in 50% acetonitrile and 0.1%TFA. An aliquot of 0.5 μl of the sample solution was applied to the sample plate and air dried.
2.9. Quantification of the total sugar, protein and rhamnose
Total sugar was determined by the phenol sulfuric acid method according to Dubois et al. (1956). The stand curve was prepared with d-glucose. Total protein content was measured by Bradford method (Bradford, 1976), standardized with bovine serum albumin. Rhamnolipid was assessed by quantification of l-rhamnose by the 6-deoxy-hexose method according to Chandrasekaran and Bemiller (Chandrasekaran and Bemiller, 1980). l-rhamnose was used for making the standard curve.
2.10. Effects of temperature and concentrations of salt on the surface activity
To evaluate the effect of temperature variation on NY3BS's surface activity, the NY3BS solution at the CMC was heated to 40 °C, 60 °C, 80 °C and 100 °C in water bath, 120 °C and 140 °C by autoclave for 1 h. After cooling to room temperature, the corresponding surface tensions were measured to evaluate NY3BS's thermal stability. The NY3BS solution at the CMC was added with serial concentrations of 4%, 8%, 12%, 16%, 20% and 24% NaCl solutions. After thorough mixing, the corresponding surface tensions were measured to evaluate NY3BS's tolerance to salt.
2.11. Assay for PAHs degradation by P. aeruginosa strain NY3
The seed culture of strain NY3 was prepared by inoculating a single colony into a 125 ml Erlenmeyer flask containing 30 ml BPLMGlu broth as the sole carbon source. The culture was incubated at 30 °C on a rotary shaker at 200 rpm. When the optical density at 600 nm reached 0.5, a 10 ml culture was transferred to a 500 ml Erlenmeyer flask containing 100 ml BPLM broth. The broth was supplemented with a mixture of equal amounts of the following polycyclic aromatic hydrocarbons: fluorine, anthracene, phenanthrene, pyrene and fluoranthene to the final concentration of 25 mg/L (5 mg/L for each). Triplicate cultures, including one negative control with autoclaved cells of strain NY3 added, were incubated at 30 °C on a rotary shaker at 200 rpm. The culture samples were taken at the time points of 0, 1.5, 12, 15, 18, 21 and 24 h for analysis. The residual PAHs in the cultures were recovered by three repeated extractions with cyclohexane and followed by dehydration using anhydrous Na2SO4. After passage through a 0.45 μm membrane filter, the preparations were concentrated on a rotary evaporator. The pellets were dissolved in methanol and quantified by HPLC (JASCO LC-2000 chromatograph equipped with a diode-array UV–visible detector). The samples were analyzed at 25 °C by injecting 20 μl into a reverse-phase ODS-C18 column (5 μM, 250×4.6 mm) and using isocratic elution with the mobile phase of 15% H2O and 85% methanol at a flow rate of 1 ml/min. Elution of PAHs was monitored at 254 nm. The residual concentrations for each PAH compound were quantified by comparison of the peak areas between the sample and the control.
3. Results
3.1. Screening and isolation of the biosurfactant-producing microorganism strain NY3
Serial dilutions of the petroleum-contaminated soil samples in sterile water were screened on the solid medium RBSSM. After two days' incubation at 30 °C, seven large, flat, smooth colonies of rod-shaped bacteria produced visual rhamnolipids as indicated by the presence of blue halos (Siegmund and Wagner, 1991). These colonies were further purified on RBSSM agar plates according to their uniform growth, color, morphological and microscopic characteristics. To confirm their abilities to produce the biosurfactants in liquid culture, individual colonies were inoculated in BPLMGlu medium. Production of biosurfactants in these cultures was monitored by measuring the surface tension and emulsification activity. Among them, one pure culture, designated as strain NY3, producing the lowest surface tension (32.8 mN/m2) and highest emulsification activity (E76=100%), was selected for in-depth characterization.
3.2. Taxonomic classification of strain NY3
Sequencing of the 16S rRNA gene for an unknown pure microorganism has appeared as the predominant strategy in the literature for strain classification. By adopting the published primers fD1 and rD1 for most eubacteria (Weisburg et al., 1991), and using genomic DNA of strain NY3 as a PCR template, the 1.5 kb fragment was successfully amplified. The gel-purified PCR product was directly submitted for sequencing using the PCR primers mentioned above. The 1475 bp sequence (GenBank accession number: GU377209) was obtained and analyzed by Blast search against GenBank database (Altschul et al., 1990). It revealed the high similarity to the 16 S rRNA genes from P. aeruginosa strains (e.g. Accession Nos.: EF062513 (100% identities), GQ180118, GQ180117, FJ948174 and FM209186 (99% identities)). Based on the Blast result, morphological and microscopic characteristics, the pure isolate was classified as P. aeruginosa strain NY3.
3.3. Characterization of P. aeruginosa strain NY3
The growth of strain NY3 was evaluated on the agar plates made from different media available in our laboratories. Those include solid media LB for E. coli, ISP2, ISP4, R2YE, AS1 and YM for Streptomyces. After two days' incubation at 30 °C, robust growth was observed on ISP2, YM, AS1 and LB. However, no growth was observed on ISP4 and R2YE. A coffee-brownish color was visualized when grown on YM. The growth of strain NY3 was also tested in the different liquid media. Those include LB and 2×YT for E. coli, YM and TSB for Streptomyces, YGP for yeast and BHI for Paenibacillus. Strain NY3 was able to grow well in all these liquid media. To optimize the fermentation conditions for growth and biosurfactant production, strain NY3 was cultivated in BSPL medium supplemented with different carbon sources and at various initial pH. Fig. 1 demonstrates that strain NY3 is capable of utilizing n-alkanes as sole carbon and energy sources. The growth rate with hexane was superior to diesel oil and octane. The maximum growth of strain NY3 with hexane was approximately three times lower than that with beef extract. Regardless of whether glucose (20 g/L), glycerol (20 g/L) or beef extract (3 g/L) was used as the sole carbon source, the growth curves were remarkably similar (data not shown). However, the culture supernatant from the glucose fermentation produced higher surface activity than those grown with either beef extract or glycerol (data not shown). Varying the initial pH from 2 to 10 in the BSPMGlu, the best initial pH for NY3BS production and surface activity was determined as 9.0. Under the optimum fermentation conditions, the lowest surface tension (32.8 mN/m2), the best emulsification activity (E76=100%) and the maximum oil displacement ability (10 cm) for strain NY3 were simultaneously achieved when the measurement was conducted with the cell free culture or with purified biosurfactant NY3BS prepared from 76 h culture samples (Table 1). In addition, the yield of NY3BS produced by strain NY3 was determined to be 0.2 g/L after 76 h fermentation in BSPMGlu medium. Studies on the improvement of NY3BS production are under way.
Fig. 1.
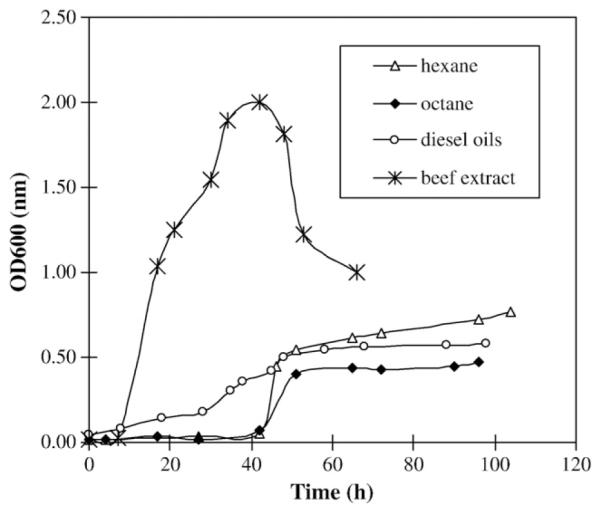
Growth curves of P. aeruginosa strain NY3 on different carbon sources.
Table 1.
Surface activity of rhamnolipid biosurfactant NY3BS.
| Time (h) | 24 | 48 | 68 | 72 | 76 | 92 | 96 |
| E76 (%) | 70 | 100 | 100 | 82 | 100 | 100 | 90 |
| R (cm) | 1.0 | 2.0 | 5.0 | 6.0 | 8.0 | 8.0 | 4.0 |
| Surface tension (mN/m2) |
52.31 | 42.46 | 34.63 | 41.92 | 32.81 | 34.98 | 41.92 |
3.4. Degradation of PAHs by strain NY3
A mixture of five compounds: fluorene, anthracene, phenanthrene, pyrene and fluoranthene were employed to evaluate the capacity of the in vivo degradation of the polycyclic aromatic hydrocarbons by strain NY3. They were added into the liquid medium BSPM, which had been previously inoculated with strain NY3 or dead NY3 cells as negative control. The residual compounds were recovered from the fermentation samples collected at different time points by extraction with organic solvent. Quantitative analysis of the residual PAHs by HPLC are shown in Fig. 2. By the end of 24 h, 23.1% anthracene, 19.9% phenanthrene, 16.9% pyrene, 15.8% fluorene and 11.2% fluoranthene were removed. In general, strain NY3 was capable of degrading all five PAH substrates although their removal rates were different (Fig. 2). The degradation rates for three-ring PAHs, including fluorene, phenanthrene and anthracene, were higher than four-ring PAHs like fluoranthene and pyrene. There were no significant differences in the degradation rates among the three-ring PAHs. The removal rates for three-ring PAHs gradually increased over fermentation time while the removal rates for four-ring PAHs showed no obvious changes between 1.5 h and 18 h. In addition, the removal rate for each PAH was relatively high during the first 1.5 h of fermentation. The possible explanation for this observation was that during the time period 0.1 h through 1.5 h, a portion of the removal rate may have been contributed by the NY3 cells trapping the PAH. This portion should not be counted as real degradation. Only a portion of the removal rate observed was actually due to degradation by the NY3 cells.
Fig. 2.
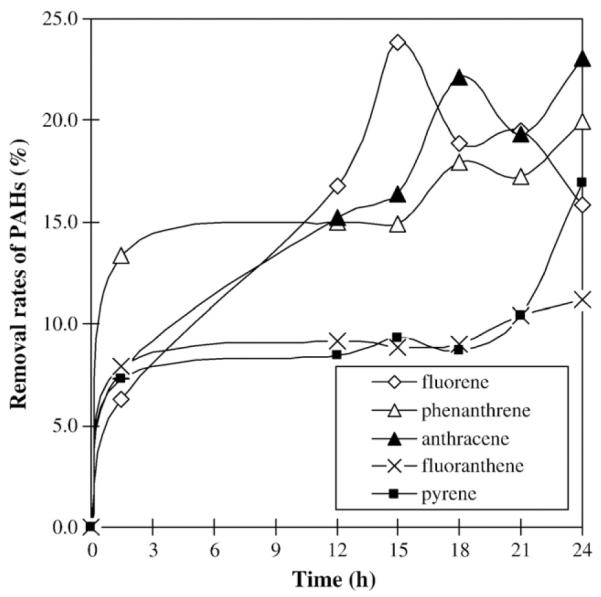
Time course of the PAHs degradation during the fermentation of P. aeruginosa strain NY3.
3.5. Characterization of biosurfactant NY3BS
NY3BS was extracted from a 76 h fermentation in BSPLGlu or BSPLGly media. The purified NY3BS was analyzed for sugar and protein contents by the phenol sulfuric acid and Bradford methods, respectively. The results indicated NY3BS contains 63.4% total sugar, 34.6% rhamnose and 0.35% protein. Purified NY3BS was analyzed by MALDI-TOF MS and tandem mass spectrometry. The results are summarized in Table 2 and shown in Fig. 3. A total of 25 components of rhamnolipid biosurfactant NY3BS, which represented 37 different metal ion (Na+ and/or 2Na+ or K+) adducts, were detected by MALDI-TOF MS. The parent ions at m/z 527.3 and 673.4 were dominant and could be assigned to singly sodiated monorhamnolipid [Rha–C10–C10+Na]+ and dirhamnolipid [Rha–Rha–C10–C10+Na]+, respectively (Fig. 3 A to J). The parent ions at m/z 499.3 (Fig. 3A), 687.4 (Fig. 3E and I), 513.3 and 517.3 (Fig. 3F), 549.3 (Fig. 3H) and 695.4 (Fig. 3J), were less abundant and could be assigned to [Rha–C10–C8+Na]+, [Rha–C10–C10:1+K]+, [Rha–Rha–C10–C10:1+K]+, [Rha–C10–C8:1+K]+, [Rha–Rha–C10+K]+, [Rha–C24:1+Na]+ and [Rha–Rha–C10–C10–H+2 Na]+, respectively (Table 2). Many minor or trace components of rhamnolipid NY3BS were also observed (Table 2 and Fig. 3A to J). Among them were ten novel rhamnolipids, which included five monorhamnolipids: Rha–C8–C8:1, Rha–C16, Rha–C16:1, Rha–C17:1 and Rha–C24:1, and five dirhamnolipids: Rha–Rha–C6–C6:1, Rha–Rha–C9:1, Rha–Rha–C10:1–C10:1, Rha–Rha–C24, and Rha–Rha–C24:1. In addition, MALDI-TOF MS revealed an unusually large molecular ion at m/z 1044.6 (Fig. 4A). The corresponding NY3BS sample was isolated from the fermentation using glycerol as the sole carbon source. Further tandem MS analysis of this parent ion gave fragment ions in which one strong signal at m/z 695.4 corresponded to a known rhamnolipid component: doubly sodiated dirhamnolipid [Rha–Rha–C10–C10–H+2Na]+ while one weak signal at m/z 667.3 matched another known rhamnolipid component: doubly sodiated dirhamnolipid [Rha–Rha–C10–C8–H+2 Na]+ (Fig. 4B). Moreover, tandem MS data for the parent ions at m/z 527.3 and 673.3 were obtained and are summarized in Table 2. The fragment ions from the parent ions at m/z 673.4 gave recognizable ions with the same mass units as the parent ions at m/z 527.3 (Fig. 3C) and 555.4 (Fig. 3G).
Table 2.
Molecular ions observed in rhamnolipid biosurfactant NY3BS.
| Molecular formula |
Calcd Mass units [M] |
[M+Na]+ |
[M+K]+ |
[M–H + 2Na]+ |
||||
|---|---|---|---|---|---|---|---|---|
| Obsd | Calcda | Obsd | Calcd | Obsd | Calcd | |||
| Monorhamnolipids | ||||||||
| Rha–C8–C8:1 | C22H38O9 | 446.25158 | 469.3 | 469.24135 | - | 485.21529 | - | 491.2233 |
| Rha–C10–C8 | C24H44O9 | 476.29853 | 499.3 | 499.2883 | - | 515.26224 | 521.3 | 521.27025 |
| Rha–C10–C8:1 | C24H42O9 | 474.28288 | - | 497.27265 | 513.3 | 513.24659 | - | 519.26483 |
| Rha–C10–C10 | C26H48O9 | 504.32983 | 527.3 | 527.3196 | 543.3 | 543.29354 | 549.3b | 549.30155 |
| Rha–C10–C10:1 | C26H46O9 | 502.31418 | - | 525.30395 | 541.3 | 541.27789 | - | 547.2859 |
| Rha–C10–C12 | C28H52O9 | 532.36113 | 555.4 | 555.3509 | - | 571.32484 | - | 554.33285 |
| Rha–C10–C12:1 | C28H50O9 | 530.34548 | 553.3 | 555.33525 | - | 569.30919 | - | 575.3172 |
| Rha–C8:1 | C20H34O11 | 450.21011 | 473.2 | 473.19988 | - | 489.17382 | - | 495.18183 |
| Rha–C16 | C22H40O7 | 416.2774 | 439.1 | 439.26717 | - | 455.24111 | - | 461.24912 |
| Rha–C16:1 | C22H38O7 | 414.26175 | 437.2 | 437.25152 | - | 453.22546 | - | 459.23347 |
| Rha–C17:1 | C23H40O7 | 428.2774 | 451.2 | 451.26717 | - | 467.24111 | 473.2 | 473.24912 |
| Rha–C24:1 | C30H54O7 | 526.38695 | 549.3b | 549.37672 | 565.35066 | - | 571.35867 | |
| Dirhamnolipids | ||||||||
| Rha–Rha–C6–C6:1 | C18H30O9 | 390.18898 | 413.3 | 413.17875 | 429.3 | 429.15269 | - | 435.17093 |
| Rha–Rha–C8–C8 | C28H50O13 | 594.32514 | 617.31491 | 633.2 | 633.28885 | - | 639.29686 | |
| Rha–Rha–C10–C8 | C30H54O13 | 622.35644 | 645.3 | 645.34621 | 660.7 | 661.32015 | 667.3 | 667.32816 |
| Rha–Rha–C10–C8:1 | C30H52O13 | 620.34079 | - | 643.33056 | 659.4 | 659.3045 | - | 665.31251 |
| Rha–Rha–C10–C10 | C32H58O13 | 650.38774 | 673.3 | 673.37751 | 689.6 | 689.35145 | 695.4c | 695.35946 |
| Rha–Rha–C10–C10:1 | C32H56O13 | 648.37209 | - | 671.36186 | 687.4 | 687.3358 | - | 693.34381 |
| Rha–Rha–C10:1–C10:1 | C32H54O13 | 646.35644 | - | 669.34621 | 685.4 | 685.32015 | - | 691.32816 |
| Rha–Rha–C10–C12 | C34H62O13 | 678.41904 | 701.4 | 701.40881 | - | 717.38275 | 723.4 | 723.39076 |
| Rha–Rha–C10–C12:1 | C34H60O13 | 676.40339 | 699.4 | 699.39316 | 715.4 | 715.3671 | - | 721.37511 |
| Rha–Rha–C9:1 | C21H36O11 | 464.22576 | - | 487.21553 | 503.2 | 503.18947 | - | 509.19748 |
| Rha–Rha–C10 | C22H38O11 | 478.24141 | - | 501.23118 | 517.3 | 517.20512 | - | 523.21313 |
| Rha–Rha-C24 | C36H66O11 | 674.46051 | - | 697.45028 | 713.4 | 713.42422 | - | 719.43223 |
| Rha–Rha–C24:1 | C36H64O11 | 672.44486 | 695.4c | 695.43463 | 711.3 | 711.40857 | - | 717.41658 |
| Parent molecular ions | Daughter ions | |||||||
| [Rha–C10–C10+Na]+ at m/z 527.3 | 80.0, 83.0, 95.0, 96.0, 111.0, 113.0, 169.0, 185.0, 193.1, 197.9, 209.1, 211.1, 281.1, 295.2, 308.3, 321.2, 335.2, 351.1, 357.2, 368.9, 381.2, 409.2 |
|||||||
| [Rha2–C10–C10+Na]+ at m/z 673.3 | 71.0, 80.0, 85.0, 95.0, 111.0, 113.0, 153.0, 169.0, 185.0, 193.1, 211.1, 265.1, 279.2, 281.1, 295.2, 308.3, 315.1, 321.2, 331.1, 333.1, 359.2, 381.3, 409.3, 495.1, 503.2, 517.0, 527.3, 555.4 |
|||||||
Calculated monoisotopic masses.
The identical mass units were detected for different compounds. They could be distinguished from each other only by analysis with the higher resolution mass spectrometry facilities.
The identical mass units were detected for different compounds. They could be distinguished from each other only by analysis with the higher resolution mass spectrometry facilities.
Fig. 3.

MALDI-TOF mass spectrometry spectra of rhamnolipid NY3BS. NY3BS samples isolated from the fermentations using either glucose (A to D) or glycerol (E to J) as sole carbon source.
Fig. 4.
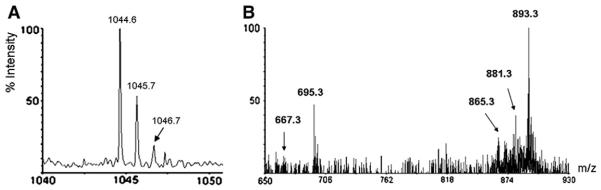
MALDI-TOF MS (A) and tandem MS (B) spectra of a large molecular ion at m/z 1044.6.
3.6. Effect of temperature and NaCl on the surface activity of NY3BS
The surface tension was measured with NY3BS solutions treated at various temperatures. Rhamnolipid NY3BS was resistant to a wide range of temperatures. No significant changes were observed in the surface tension after 1 h at 120 °C. The surface tension increased from 32.8 to 38.0 mN/m2 after 1 h at 140 °C (Fig. 5A). NY3BS was still effective in the presence of a high concentration of sodium chloride. The surface tension remained less than 35 mN/m2 even though the concentration of NaCl was elevated to 16%. However, the surface tension rapidly increased to a high of 43 mN/m2 when the final concentration of NaCl reached 20% (Fig. 5B).
Fig. 5.

Effects of the temperatures and concentrations of NaCl on the surface tension of NY3BS.
4. Discussion
Compared to their chemically synthesized counterparts, microbial surfactants show great potential for useful activity with less environmental risk. The search for safe and efficient methods to remove environmental pollutants is a major impetus in the search for novel biosurfactant-producing and PAH-degrading microorganisms. Prior studies demonstrated that Pseudomonas spp., the most common producers for biosurfactant rhamnolipids, were frequently isolated from petroleum-contaminated soil samples (Déziel et al., 1996; Monteiro et al., 2007; Pornsunthorntawee et al., 2008; Price et al., 2009). In the present research, a novel rhamonolipid-producing and PAH-degrading bacterium, P. aeruginosa strain NY3, was isolated from petroleum-contaminated soil samples collected in Shaanxi, China. Its taxonomic classification was fully supported by the 16S rRNA gene sequence similarity and the colony morphological and microscopic characteristics. Strain NY3 grows robustly in a wide variety of solid and liquid media which have been routinely used for cultivation of E. coli, Streptomyces, yeast and Paenibacillus. However, no growth was observed on media designed for cultivaiton of actinomycetes, ISP4 and R2YE. Strain NY3 was able to use n-alkanes like diesel oil, hexane and octane as the sole carbon and energy sources as previously observed in other Pseudomonas spp. (Zhang and Miller, 1992; Perfumo et al., 2006). However, these carbon sources could not be effectively metabolized by strain NY3 as reflected by the poor and slow growth (Fig. 1). In contrast, glucose and glycerol were equally good for growth but, the former is better than the latter for NY3BS production with respect to the surface activity (data not shown).
MALDI-TOF MS, in conjunction with tandem MS analysis, were employed as powerful tools to identify the components of rhamnolipids and to access their chemical structural information (Haussler et al., 1998; Déziel et al., 1999; Denekamp et al., 2000; Haba et al., 2003a,b; Gunther et al., 2005; Perfumo et al., 2006; Costa et al., 2006; Wang et al., 2007; Monteiro et al., 2007; Sharma et al., 2007; Pornsunthorntawee et al., 2008; Price et al., 2009; Nitschke et al., 2009; Bordoloi and Konwar, 2009). Strain NY3 was characterized for its extraordinary capacity to produce diverse components of rhamnolipids. MALDI-TOF MS analysis of NY3BS revealed the co-production of 25 rhamnolipid components which were present in 37 different species with adduction of metal ions (Na+, 2Na+ or K+, Table 2 and Fig. 3 A to J). Among those components were ten novel rhamnolipids including five monorhamnolipids Rha–C8–C8:1, Rha–C16, Rha–C16:1, Rha–C17:1 and Rha–C24:1, and five dirhamnolipids: Rha–Rha–C6–C6:1, Rha–Rha–C9:1, Rha–Rha–C10:1–C10:1, Rha–Rha–C24, and Rha–Rha–C24:1 (Table 2). To the best of our knowledge, these ten rhamnolipid species are being reported here for the first time. MALDI-TOF MS detected nine single fatty acid-containing rhamnolipid species including five monorhamnolipids (Rha–C8:1, Rha–C16, Rha–C16:1, Rha–C17:1 and Rha–C24:1) and four dirhamnolipids (Rha–Rha–C9:1, Rha–Rha–C10, Rha–Rha–C24 and Rha–Rha–C24:1). Single-fatty acid-containing rhamnolipid species were previously reported as Rha–C8 and Rha–Rha–C8 (Déziel et al., 1999), Rha–C8:2 and Rha–C12:2 (Haba et al., 2003a), Rha–C10 and Rha–Rha–C10 (Déziel et al., 1999; Perfumo et al., 2006), Rha–C12 and Rha–Rha–C12 and Rha–C12:1 (Déziel et al., 1999). Strain NY3 produced the monorhamnolipids Rha–C10–C10 and dirhamnolipids Rha–Rha–C10–C10 as the predominant components. This finding was consistent with previous reports for P. aeruginosa SP4 (Sarachat et al., 2010), P. aeruginosa LBI (Nitschke et al., 2009) and P. aeruginosa NRRL B-59182 (Rooney et al., 2009). Strain NY3 stands out from other rhamnolipid-producing Pseudomonas strains because of its capability to produce many more minor components of biosurfactant rhamnolipids. These molecular ions observed were at m/z 429.3, 451.2, 469.3, 473.2 and 499.3 (Fig. 4A);437.2 and 521.3 (Fig. 3B); 543.3 and 549.3 (Fig. 3C); 660.7, 689.4, 695.4, 699.4, and 701.4 (Fig. 3D); 413.3, 469.3, 513.3, 517.3, 541.3, 645.3 and 715.4 (Fig. 3E); 503.2 (Fig. 3F); 549.3 and 555.4 (Fig. 3G); 543.3 and 553.3 (Fig. 3H); 633.2, 685.4, 703.4 and 713.4 (Fig. 3I); 667.3, 689.3, 701.4, 711.3 and 723.4 (Fig. 3J). Strain NY3 appeared to be much more productive when grown with glycerol as the sole carbon source than it was when grown in glucose. This was evidenced by the number of different components and their corresponding metal ion-adducts. Strain NY3 produced 18 different rhamnolipid components with glycerol as sole carbon source and 13 with glucose as sole carbon source (Table 2 and Fig. 4 A to J). It was previously reported that multiple factors, like individual strain, carbon sources, culture conditions and isolation procedures, were all possibly responsible for the diversity of the components of rhamnolipid production (Déziel et al., 1999; Nitschke et al., 2009). The results reported here support those observations and emphasize the importance of carbon source and specific strain in the diversity of rhamnolipid production. In addition, it was observed with MALDI-TOF MS analysis that there was an unusually large molecular ion at m/z 1044.6 in the NY3BS samples. It was isolated from the fermentation using glycerol as sole carbon source (Fig. 4A). This compound was absent in the glucose-containing fermentation. Tandem MS analysis of the parent ion at m/z 1044.6 gave the fragment ions in which a strong signal at m/z 695.3 appeared to correspond to one of the known rhamnolipid components: [Rha–Rha–C10–C10–H+2 Na] while a weak signal at m/z 667.3 matches another known component: [Rha–Rha–C10–C8–H+2 Na] (Fig. 4B). Whether this compound belongs to a rhamnolipid or not remains to be determined. Moreover, it was observed that the number of the potassiated dirhamnolipid compounds were remarkably high with NY3BS samples isolated from the glycerol-containing fermentation. The factors associated with these observations remain unclear.
Strain NY3 was not only capable of producing structurally diverse novel rhamnolipids NY3BS but, it was also able to degrade five PAH substrates including the carcinogenic compound phenanthrene (Bücher et al., 1979; Haritash and Kaushik, 2009). With the mixture of equal amounts of five PAHs comprised of fluorene, anthracene, phenanthrene, fluoranthene and pyrene, it was clearly demonstrated that strain NY3 efficiently degraded each of these compounds in vivo (Fig. 2). It appeared that strain NY3 was capable of degrading all five PAH substrates. Particularly, the strain was able to efficiently degrade both the low molecular weight compounds anthracene, fluorene and phenanthrene, and the high molecular weight substrates pyrene and fluoranthene (Fig. 2). Similar results were reported by Arun et al. (2008). The increase in the degradation rates of the high molecular weight compounds fluoranthene and pyrene coincidently occurred with the end of the exponential phase and the start of the stationary phase of bacterial growth. This suggests that the in vivo production of rhamnolipid biosurfactant by strain NY3 would have a synergistic effect resulting in an improvement on the degradation of water-insoluble PAHs. This observation supports previous reports that the rhamnolipid biosurfactant could enhance the water solubility of PAHs and thus improve their degradation and bioavailability (Shin and Kim, 2004; Hickey et al., 2007; Bordoloi and Konwar, 2009). Interestingly, a common Z-like degradation curve for anthracene, phenanthrene and fluorene was observed between 12 h and 24 h in each of the repeated experiments. This implies there is a dynamic exchange of substances including PAHs and their derivatives or their metabolites between the inside and outside of the cells. Differentiated degradation in strain NY3 is evidence of the naturally different properties of each PAH. Furthermore, the relative residual amounts and temporary balances between inside and outside of the cells may vary significantly from one another. Consequently, different degradation curves, like the one for fluorene, should be expected.
5. Conclusions
Through this research, P. aeruginosa strain NY3 was demonstrated via isolation, identification and characterization to be a novel rhamnolipid-producing and PAH-degrading bacterium. Its biosurfactant product, NY3BS, was purified and characterized by MALDI-TOF MS and tandem MS analysis. Strain NY3 stood out from other rhamnolipid-producing P. aeruginosa due to its extraordinary capacity to produce the structurally diverse components of biosurfactant rhamnolipids. specifically, there were ten novel molecules described here for the first time. Additionally, the improved capacity to efficiently degrade detrimental environmental contaminants, like PAHs, adds to its value in environmental remediation. These findings expand current knowledge regarding the diversity and productive capability of rhamnolipid biosurfactants from a single specific strain using a single carbon source. This initial work paves the way to further exploit the potential of this strain across a broad range of industrial applications.
Acknowledgements
This work was partially supported by the NAU grant 20091151 (XY). Yang Wang is a China–US joint training graduate (Ph.D.) student and supported by the State Scholarship Fund through the China Scholarship Council of the Ministry of Education of the PR China. The Mass Spectrometry Facility at OSU was supported by NIEHS grant P30 ES00210.
References
- Altschul SF, Gish W, Miller W, Myers EW, Lipman DJ. Basic local alignment search tool. J Mol Biol. 1990;215:403–10. doi: 10.1016/S0022-2836(05)80360-2. [DOI] [PubMed] [Google Scholar]
- Arun A, Raja PP, Arthi R, Ananthi M, Kumar KS, Eyini M. Polycyclic aromatic hydrocarbons (PAHs) biodegradation by basidiomycetes fungi, Pseudomonas isolate, and their cocultures: comparative in vivo and in silico approach. Appl Biochem Biotechnol. 2008;151:132–42. doi: 10.1007/s12010-008-8160-0. [DOI] [PubMed] [Google Scholar]
- Bordoloi NK, Konwar BK. Microbial surfactant-enhanced mineral oil recovery under laboratory conditions. Colloids Surf B Biointerfaces. 2008;63:73–82. doi: 10.1016/j.colsurfb.2007.11.006. [DOI] [PubMed] [Google Scholar]
- Bordoloi NK, Konwar BK. Bacterial biosurfactant in enhancing solubility and metabolism of petroleum hydrocarbons. J Hazard Mater. 2009;170:495–505. doi: 10.1016/j.jhazmat.2009.04.136. [DOI] [PubMed] [Google Scholar]
- Bradford MM. A rapid and sensitive method for the quantitation of microgram quantities of protein utilizing the principle of protein–dye binding. Anal Biochem. 1976;72:248–54. doi: 10.1006/abio.1976.9999. [DOI] [PubMed] [Google Scholar]
- Bücher M, Glatt HR, Platt KL, Avnir D, Ittah Y, et al. Mutagenicity of phenanthrene and phenanthrene K-region derivatives. Mutat Res. 1979;66:337–48. doi: 10.1016/0165-1218(79)90044-2. [DOI] [PubMed] [Google Scholar]
- Chandrasekaran E, Bemiller J. Constituent analysis of glycosaminoglycans. Meth Carbohydr Chem. 1980;8:89–96. [Google Scholar]
- Cooper DG, Goldenberg BG. Surface-active agents from two Bacillus species. Appl Environ Microbiol. 1987;53:224–9. doi: 10.1128/aem.53.2.224-229.1987. [DOI] [PMC free article] [PubMed] [Google Scholar]
- Costa SGVAO, Nitschke M, Haddad R, Eberlin MN, Contiero J. Production of Pseudomonas aeruginosa LBI rhamnolipids following growth on Brazilian native oils. Process Biochem. 2006;41:483–8. [Google Scholar]
- Das P, Mukherjee S, Sen R. Biosurfactant of marine origin exhibiting heavy metal remediation properties. Bioresour Technol. 2009;100:4887–90. doi: 10.1016/j.biortech.2009.05.028. [DOI] [PubMed] [Google Scholar]
- Denekamp C, Claeys M, Pocsfalvi G. Mechanism of cross-ring cleavage reactions in dirhamnosyl lipids: effect of the alkali ion. Rapid Commun Mass Spectrom. 2000;14:794–9. doi: 10.1002/(SICI)1097-0231(20000515)14:9<794::AID-RCM945>3.0.CO;2-3. [DOI] [PubMed] [Google Scholar]
- Desai JD, Banat IM. Microbial production of surfactants and their commercial potential. Microbiol Mol Biol Rev. 1997;61:47–64. doi: 10.1128/mmbr.61.1.47-64.1997. [DOI] [PMC free article] [PubMed] [Google Scholar]
- Déziel E, Paquette G, Villemur R, Lépine F, Bisaillon J. Biosurfactant production by a soil Pseudomonas strain growing on polycyclic aromatic hydrocarbons. Appl Environ Microbiol. 1996;62:1908–12. doi: 10.1128/aem.62.6.1908-1912.1996. [DOI] [PMC free article] [PubMed] [Google Scholar]
- Déziel E, Lépine F, Dennie D, Boismenu D, Mamer OA, Villemur R. Liquid chromatography/mass spectrometry analysis of mixtures of rhamnolipids produced by Pseudomonas aeruginosa strain 57RP grown on mannitol or naphthalene. Biochim Biophys Acta. 1999;1440:244–52. doi: 10.1016/s1388-1981(99)00129-8. [DOI] [PubMed] [Google Scholar]
- Déziel E, Lépine F, Milot S, Villemur R. Mass spectrometry monitoring of rhamnolipids from a growing culture of Pseudomonas aeruginosa strain 57RP. Biochim Biophys Acta. 2000;1485:145–52. doi: 10.1016/s1388-1981(00)00039-1. [DOI] [PubMed] [Google Scholar]
- Dubois M, Gilles K, Hamilton J, Rebers P, Smith F. Colorimetric method for determination of sugars and related substances. Anal Chem. 1956;28:350–6. [Google Scholar]
- Frank N, Lissner A, Winkelmann M, Hüttl R, Mertens FO, Kaschabek SR, et al. Degradation of selected (bio-)surfactants by bacterial cultures monitored by calorimetric methods. Biodegradation. 2010;21:179–91. doi: 10.1007/s10532-009-9292-9. [DOI] [PubMed] [Google Scholar]
- Gunther NWT, Nunez A, Fett W, Solaiman DK. Production of rhamnolipids by Pseudomonas chlororaphis, a nonpathogenic bacterium. Appl Environ Microbiol. 2005;71:2288–93. doi: 10.1128/AEM.71.5.2288-2293.2005. [DOI] [PMC free article] [PubMed] [Google Scholar]
- Haba E, Espuny MJ, Busquets M, Manresa A. Screening and production of rhamnolipids by Pseudomonas aeruginosa 47T2 NCIB 40044 from waste frying oils. J Appl Microbiol. 2000;88:379–87. doi: 10.1046/j.1365-2672.2000.00961.x. [DOI] [PubMed] [Google Scholar]
- Haba E, Abalos A, Jauregui O, Espuny MJ, Manresa A. Use of liquid chromatography-mass spectroscopy for studying the composition and properties of rhamnolipids produced by different strains of Pseudomonas aeruginosa. J Surfactants Deterg. 2003a;6:155–61. [Google Scholar]
- Haba E, Pinazo A, Jauregui O, Espuny MJ, Infante MR, Manresa A. Physicochemical characterization and antimicrobial properties of rhamnolipids produced by Pseudomonas aeruginosa 47T2 NCBIM 40044. Biotechnol Bioeng. 2003b;81:316–22. doi: 10.1002/bit.10474. [DOI] [PubMed] [Google Scholar]
- Haritash AK, Kaushik CP. Biodegradation aspects of polycyclic aromatic hydrocarbons (PAHs): a review. J Hazard Mater. 2009;169:1–15. doi: 10.1016/j.jhazmat.2009.03.137. [DOI] [PubMed] [Google Scholar]
- Haussler S, Nimtz M, Domke T, Wray V, Steinmetz I. Purification and characterization of a cytotoxic exolipid of Burkholderia pseudomallei. Infect Immun. 1998;66:1588–93. doi: 10.1128/iai.66.4.1588-1593.1998. [DOI] [PMC free article] [PubMed] [Google Scholar]
- Hickey AM, Gordon L, Dobson AD, Kelly CT, Doyle EM. Effect of surfactants on fluoranthene degradation by Pseudomonas alcaligenes PA-10. Appl Microbiol Biotechnol. 2007;74:851–6. doi: 10.1007/s00253-006-0719-5. [DOI] [PubMed] [Google Scholar]
- Hirayama T, Kato I. Novel methyl rhamnolipids from Pseudomonas aeruginosa. FEBS Lett. 1982;139:81–5. [Google Scholar]
- Jarvis F, Johnson M. A glycolipid produced by Pseudomonas aeruginosa. J Am Chem Soc. 1949:71. [Google Scholar]
- Kjellin UR, Reimer J, Hansson P. An investigation of dynamic surface tension, critical micelle concentration, and aggregation number of three nonionic surfactants using NMR, time-resolved fluorescence quenching, and maximum bubble pressure tensiometry. J Colloid Interface Sci. 2003;262:506–15. doi: 10.1016/S0021-9797(03)00168-1. [DOI] [PubMed] [Google Scholar]
- Lotfabad TB, Shourian M, Roostaazad R, Najafabadi AR, Adelzadeh MR, Noghabi KA. An efficient biosurfactant-producing bacterium Pseudomonas aeruginosa MR01, isolated from oil excavation areas in south of Iran. Colloids Surf B Biointerfaces. 2009;69:183–93. doi: 10.1016/j.colsurfb.2008.11.018. [DOI] [PubMed] [Google Scholar]
- Makkar RS, Cameotra SS. An update on the use of unconventional substrates for biosurfactant production and their new applications. Appl Microbiol Biotechnol. 2002;58:428–34. doi: 10.1007/s00253-001-0924-1. [DOI] [PubMed] [Google Scholar]
- Monteiro SA, Sassaki GL, de Souza LM, Meira JA, de Araujo JM, Mitchell DA, et al. Molecular and structural characterization of the biosurfactant produced by Pseudomonas aeruginosa DAUPE 614. Chem Phys Lipids. 2007;147:1–13. doi: 10.1016/j.chemphyslip.2007.02.001. [DOI] [PubMed] [Google Scholar]
- Monteiro AS, Coutinho JO, Júnior AC, Rosa CA, Siqueira EP, Santos VL. Characterization of new biosurfactant produced by Trichosporon montevideense CLOA 72 isolated from dairy industry effluents. J Basic Microbiol. 2009;49:553–63. doi: 10.1002/jobm.200900089. [DOI] [PubMed] [Google Scholar]
- Mulligan CN. Environmental applications for biosurfactants. Environ Pollut. 2005;133:183–98. doi: 10.1016/j.envpol.2004.06.009. [DOI] [PubMed] [Google Scholar]
- Muthusamy K, Gopalakrishnan S, Ravi TK, Sivachidambaram P. Biosurfactants:properties, commercial production and application. Curr Sci. 2008;94:736–47. [Google Scholar]
- Nitschke M, Costa SG, Haddad R, Goncalves LA, Eberlin MN, Contiero J. Oil wastes as unconventional substrates for rhamnolipid biosurfactant production by Pseudomonas aeruginosa LBI. Biotechnol Prog. 2005;21:1562–6. doi: 10.1021/bp050198x. [DOI] [PubMed] [Google Scholar]
- Nitschke M, Costa SG, Contiero J. Structure and applications of a rhamnolipid surfactant produced in soybean oil waste. Appl Biochem Biotechnol. 2010;160:2066–74. doi: 10.1007/s12010-009-8707-8. [DOI] [PubMed] [Google Scholar]
- Perfumo A, Banat IM, Canganella F, Marchant R. Rhamnolipid production by a novel thermophilic hydrocarbon-degrading Pseudomonas aeruginosa AP02-1. Appl Microbiol Biotechnol. 2006;72:132–8. doi: 10.1007/s00253-005-0234-0. [DOI] [PubMed] [Google Scholar]
- Pornsunthorntawee O, Wongpanit P, Chavadej S, Abe M, Rujiravanit R. Structural and physicochemical characterization of crude biosurfactant produced by Pseudomonas aeruginosa SP4 isolated from petroleum-contaminated soil. Bioresour Technol. 2008;99:1589–95. doi: 10.1016/j.biortech.2007.04.020. [DOI] [PubMed] [Google Scholar]
- Price NP, Ray KJ, Vermillion K, Kuo TM. MALDI-TOF mass spectrometry of naturally occurring mixtures of monorhamnolipids and dirhamnolipids. Carbohydr Res. 2009;344:204–9. doi: 10.1016/j.carres.2008.10.013. [DOI] [PubMed] [Google Scholar]
- Rivardo F, Turner RJ, Allegrone G, Ceri H, Martinotti MG. Anti-adhesion activity of two biosurfactants produced by Bacillus spp. prevents biofilm formation of human bacterial pathogens. Appl Microbiol Biotechnol. 2009;83:541–53. doi: 10.1007/s00253-009-1987-7. [DOI] [PubMed] [Google Scholar]
- Rodrigues L, Banat IM, Teixeira J, Oliveira R. Biosurfactants: potential applications in medicine. J Antimicrob Chemother. 2006a;57:609–18. doi: 10.1093/jac/dkl024. [DOI] [PubMed] [Google Scholar]
- Rodrigues LR, Teixeira JA, van der Mei HC, Oliveira R. Physicochemical and functional characterization of a biosurfactant produced by Lactococcus lactis 53. Colloids Surf B Biointerfaces. 2006b;49:79–86. doi: 10.1016/j.colsurfb.2006.03.003. [DOI] [PubMed] [Google Scholar]
- Rooney AP, Price NP, Ray KJ, Kuo TM. Isolation and characterization of rhamnolipid-producing bacterial strains from a biodiesel facility. FEMS Microbiol Lett. 2009;295:82–7. doi: 10.1111/j.1574-6968.2009.01581.x. [DOI] [PubMed] [Google Scholar]
- Sarachat T, Pornsunthorntawee O, Chavadej S, Rujiravanit R. Purification and concentration of a rhamnolipid biosurfactant produced by Pseudomonas aeruginosa SP4 using foam fractionation. Bioresour Technol. 2010;101:324–30. doi: 10.1016/j.biortech.2009.08.012. [DOI] [PubMed] [Google Scholar]
- Sharma A, Jansen R, Nimtz M, Johri BN, Wray V. Rhamnolipids from the rhizosphere bacterium Pseudomonas sp. GRP(3) that reduces damping-off disease in Chilli and tomato nurseries. J Nat Prod. 2007;70:941–7. doi: 10.1021/np0700016. [DOI] [PubMed] [Google Scholar]
- Sharma S, Singh P, Raj M, Chadha BS, Saini HS. Aqueous phase partitioning of hexachlorocyclohexane (HCH) isomers by biosurfactant produced by Pseudomonas aeruginosa WH-2. J Hazard Mater. 2009;171:1178–82. doi: 10.1016/j.jhazmat.2009.06.116. [DOI] [PubMed] [Google Scholar]
- Shete A, Wadhawa G, Banat I, Chopade B. Mapping of patents on bioemulsifier and biosurfactant: a review. J Sci Ind Res. 2006;65:91–115. [Google Scholar]
- Shin KH, Kim KW. A biosurfactant-enhanced soil flushing for the removal of phenanthrene and diesel in sand. Environ Geochem Health. 2004;26:5–11. doi: 10.1023/b:egah.0000020895.85344.09. [DOI] [PubMed] [Google Scholar]
- Siegmund I, Wagner F. New method for detecting rhamnolipids excreted by Pseudomonas species during growth on mineral agar. J Biotechnol Tech. 1991;5:265–8. [Google Scholar]
- Singh PB, Sharma S, Saini HS, Chadha BS. Biosurfactant production by Pseudomonas sp. and its role in aqueous phase partitioning and biodegradation of chlorpyrifos. Lett Appl Microbiol. 2009;49:378–83. doi: 10.1111/j.1472-765X.2009.02672.x. [DOI] [PubMed] [Google Scholar]
- Varnier AL, Sanchez L, Vatsa P, Boudesocque L, Garcia-Brugger A, Rabenoelina F, et al. Bacterial rhamnolipids are novel MAMPs conferring resistance to Botrytis cinerea in grapevine. Plant Cell Environ. 2009;32:178–93. doi: 10.1111/j.1365-3040.2008.01911.x. [DOI] [PubMed] [Google Scholar]
- Wang Q, Fang X, Bai B, Liang X, Shuler PJ, Goddard WA, III, et al. Engineering bacteria for production of rhamnolipid as an agent for enhanced oil recovery. Biotechnol Bioeng. 2007;98:842–53. doi: 10.1002/bit.21462. [DOI] [PubMed] [Google Scholar]
- Weisburg WG, Barns SM, Pelletier DA, Lane DJ. 16S ribosomal DNA amplification for phylogenetic study. J Bacteriol. 1991;173:697–703. doi: 10.1128/jb.173.2.697-703.1991. [DOI] [PMC free article] [PubMed] [Google Scholar]
- Yin X, O'Hare T, Gould SJ, Zabriskie TM. Identification and cloning of genes encoding viomycin biosynthesis from Streptomyces vinaceus and evidence for involvement of a rare oxygenase. Gene. 2003;312:215–24. doi: 10.1016/s0378-1119(03)00617-6. [DOI] [PubMed] [Google Scholar]
- Zhang Y, Miller RM. Enhanced octadecane dispersion and biodegradation by a Pseudomonas rhamnolipid surfactant (biosurfactant) Appl Environ Microbiol. 1992;58:3276–82. doi: 10.1128/aem.58.10.3276-3282.1992. [DOI] [PMC free article] [PubMed] [Google Scholar]
- Zhao Z, Wong JW. Biosurfactants from Acinetobacter calcoaceticus BU03 enhance the solubility and biodegradation of phenanthrene. Environ Technol. 2009;30:291–9. doi: 10.1080/09593330802630801. [DOI] [PubMed] [Google Scholar]