SUMMARY
Sequencing studies of breast tumor cohorts have identified many prevalent mutations, but provide limited insight into the genomic diversity within tumors. Here, we developed a whole-genome and exome single cell sequencing approach called Nuc-Seq that utilizes G2/M nuclei to achieve 91% mean coverage breadth. We applied this method to sequence single normal and tumor nuclei from an estrogen-receptor positive breast cancer and a triple-negative ductal carcinoma. In parallel, we performed single nuclei copy number profiling. Our data show that aneuploid rearrangements occurred early in tumor evolution and remained highly stable as the tumor masses clonally expanded. In contrast, point mutations evolved gradually, generating extensive clonal diversity. Many of the diverse mutations were shown to occur at low frequencies (<10%) in the tumor mass by targeted single-molecule sequencing. Using mathematical modeling we found that the triple-negative tumor cells had an increased mutation rate (13.3X) while the ER+ tumor cells did not. These findings have important implications for the diagnosis, therapeutic treatment and evolution of chemoresistance in breast cancer.
Human breast cancers often display intratumor genomic heterogeneity1–3. This clonal diversity confounds the clinical diagnosis and basic research of human cancers. Expression profiling has shown that breast cancers can be classified into five molecular subtypes that correlate with the presence of estrogen, progesterone and Her2 receptors4. Among these, triple-negative breast cancers (ER−/PR−/Her2−) have been shown to harbor the largest number of mutations, while luminal A (ER+/PR+/Her2−) breast cancers show the lowest frequencies5–7. These data suggest that triple-negative breast cancers (TNBCs) may have increased clonal diversity and mutational evolution, but such inferences are difficult to make in bulk tissues 8,9. To gain better insight into the genomic diversity of breast tumors, we developed a single cell genome sequencing method and applied it to study mutational evolution in an ER+ breast cancer (ER) and a TNBC patient. We combined this approach with targeted duplex10 single-molecule sequencing to profile thousands of cells and understand the role of rare mutations in tumor evolution.
Whole-Genome Sequencing Using G2/M Nuclei
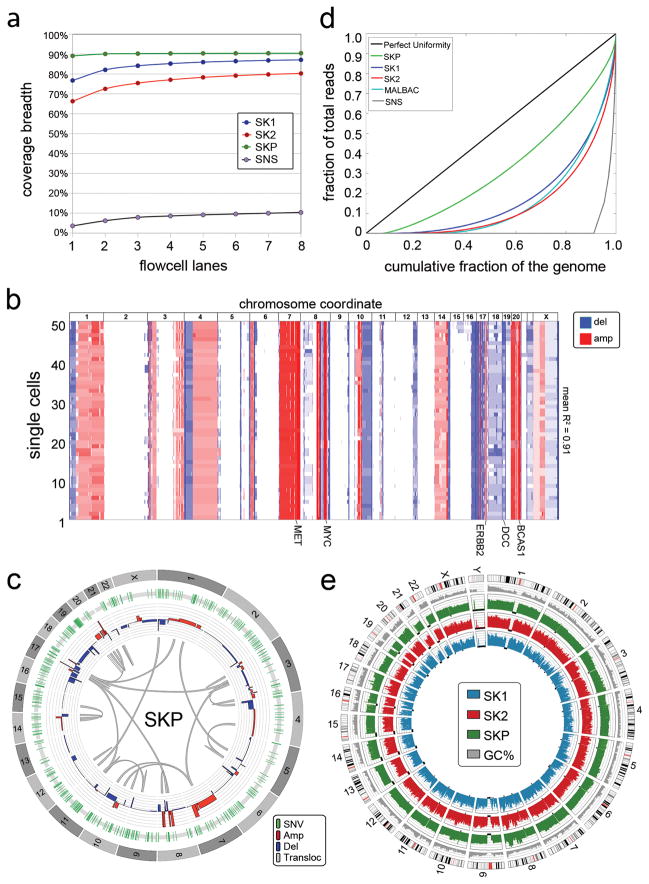
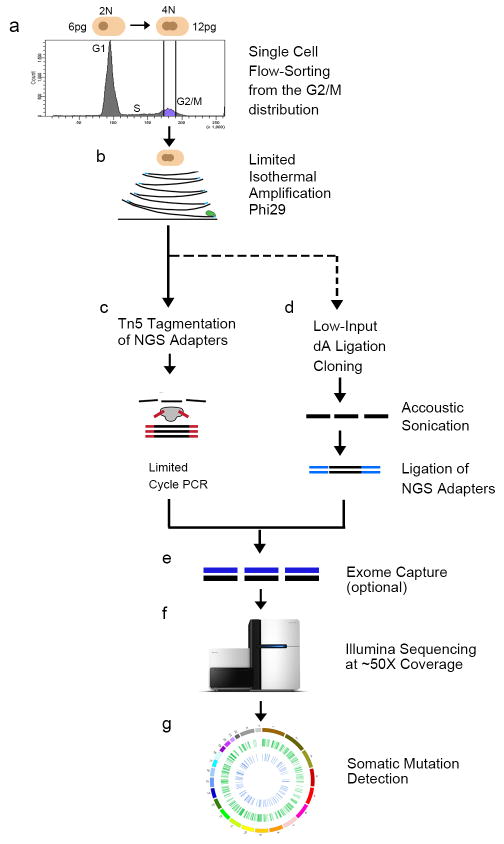
In our previous work we developed a method using degenerate-oligonucleotide-PCR and sparse sequencing to measure copy number profiles of single cells11. While adequate for copy number detection, this method could not resolve genome-wide mutations at base-pair resolution. We attempted to increase coverage by deep-sequencing these libraries, but found that coverage breadth approached a limit near 10% (Fig. 1a). To address this problem, we developed a high-coverage, whole-genome and exome single-cell sequencing method called Nuc-Seq (Extended Data Fig. 1). In this method we exploit the natural cell cycle, in which single cells duplicate their genome during S phase, expanding their DNA from 6 to 12 picograms prior to cytokinesis. This approach provides an advantage over using chemical inhibitors to induce polyploidy in single cells12,13 because it does not require live cells.
Figure 1. Method Performance in a Monoclonal Cell Line.
a, Coverage breadth for single cells (SK1, SK2) sequenced by Nuc-Seq, a single cell SNS library and a SK-BR-3 population sample. b, Heatmap of 50 single cell SK-BR-3 copy number profiles. c, Circos plot of variants detected by sequencing populations of SK-BR-3 cells d, Lorenz curve of coverage uniformity for the single SK-BR-3 cells sequenced by Nuc-Seq, a cell sequenced by SNS, a population of SK-BR-3 cells, and a cell sequenced by MALBAC. e, Coverage depth for the SK-BR-3 population sample and the SK1 and SK2 single cells.
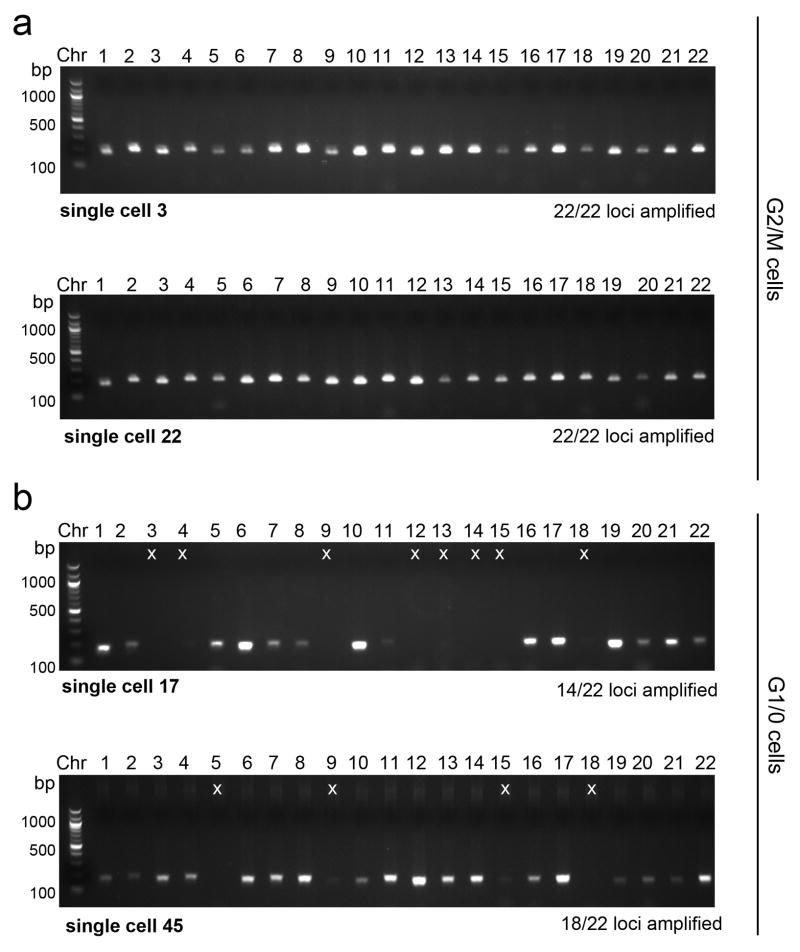
We input four (or more) copies of each single cell genome for whole-genome-amplification (WGA) to decrease the allelic dropout and false positive error rates, which are major sources of error during multiple-displacement-amplification (MDA)14,15. Additionally, we limit the MDA time to 80 minutes to mitigate FP errors associated with the infidelity of the ϕ29 polymerase (Supplementary Methods). The improved amplification efficiency can be shown using 22 chromosome-specific primer pairs for PCR (Extended Data Fig. 2). In G1/0 single cells we find that only 25.58% (11/43) of the cells show full amplification of the chromosomes, while G2/M cells have 45.34% (39/86). After MDA, we incubate the amplified DNA with a Tn5 transposase, which simultaneously fragments DNA and ligates adapters for sequencing16. The libraries are then multiplexed for exome capture or used directly for next-generation sequencing.
Validation in a Monoclonal Cancer Cell Line
To validate our method we used a breast cancer cell line (SK-BR-3) that was previously shown to be genetically monoclonal11,17. We evaluated the genetic homogeneity of this cell line using spectral karyotyping and found that large chromosome rearrangements were highly stable in 85.80% of the single cells (Supplementary Table 1). We also performed Single-Nucleus-Sequencing (SNS)11,18 on 50 single SK-BR-3 cells and calculated copy number profiles at 220kb resolution, which showed that the major amplifications of MET, MYC, ERBB2, BCAS1 and a deletion in DCC were stable (mean R2 = 0.91) in all of the 50 cells (Fig. 1b). Next, we deep-sequenced the population of SK-BR-3 cells (SKP) at high coverage depth (51X) and breadth (90.40%) and detected single-nucleotide-variants (SNVs), copy number aberrations (CNAs) and structural variants (SVs) using our processing pipeline (methods). We filtered the variants using dbSNP135 and identified 409 nonsynonymous variants and 1,452 structural variants (Fig. 1c), several of which occurred in cancer genes (Supplementary Table 2).
We applied Nuc-Seq to sequence the whole genomes of two single SK-BR-3 cells (SK1 and SK2) and calculated coverage depth, breadth (sites with at least one read) and uniformity (evenness). We found that both SK-BR-3 cells achieved high coverage depth (61X ± 5 sem, n=2) and breadth (83.70% ± 3.40 sem, n=2) (Fig. 1e). In comparison, we re-analyzed coverage breadth in single cells sequenced by MALBAC19 using unique reads and calculated 69.54% coverage breadth. We evaluated coverage uniformity using Lorenz curves20 which showed highly uniform coverage, representing a major improvement over our previous SNS method11,18 and is equivalent to the MALBAC data19 (Fig. 1d). Next, we calculated error rates, including the allelic dropout rate (ADR) and false positive rate (FPR) by comparing single cell variants to the population data (Methods). Our analysis suggests that Nuc-Seq generates low allelic dropout rates (9.73% ± 2.19%) compared to previous studies (7–46%)14. We also achieved low false positive error rates for point mutations (FPR = 1.24e-6), equivalent to 1–2 errors per million bases, which represents a major technical improvement over previous methods (FPR= 2.52e-5 and 4e-5)14,19.
Population and Single Nuclei Sequencing of an ER Tumor
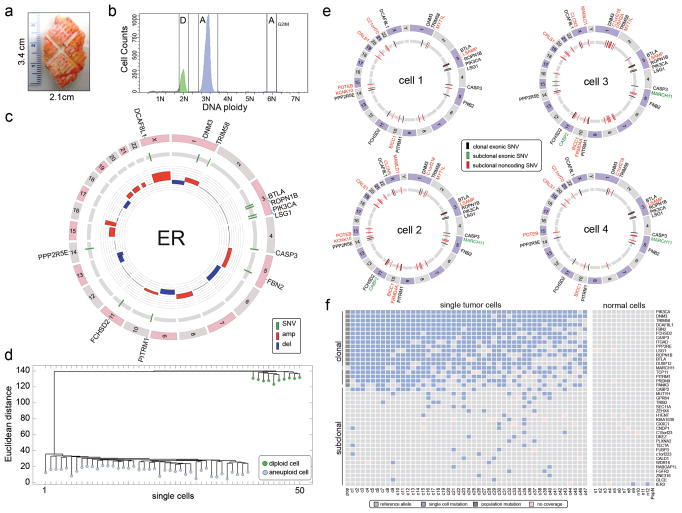
We selected an invasive ductal carcinoma from an estrogen-receptor positive (ER+/PR+/Her2−) breast cancer patient for population and single cell sequencing (Fig. 2a, methods). We flow-sorted millions of nuclei from the aneuploid G2/M peak (6N) and from matched normal tissue for population sequencing (46X and 54X) (Fig. 2b). We also flow-sorted 50 single nuclei for copy number profiling, 4 nuclei for whole-genome sequencing and 59 nuclei for exome sequencing. After filtering germline variants we identified a total of 4,162 somatic SNVs in the aneuploid tumor cell population. Among these SNVs we identified 12 nonsynonymous mutations, which we validated by exome sequencing (66X). Several nonsynonymous mutations occurred in cancer genes, including PIK3CA, CASP3, FBN2 and PPP2R5E (Fig. 2c, Supplementary Information). PIK3CA is the most common driver mutation in luminal A breast cancers7,9.
Figure 2. Single Cell and Population Sequencing of an ER Tumor.
a, Frozen ER tumor specimen. b, Flow-sorting histogram of ploidy distributions. c, Circos plot of mutations and CNAs detected in the population of aneuploid tumor cells. Cancer genes are on the outer ring d, Neighbor-joining tree of integer copy number profiles from single diploid and aneuploid cells, rooted by the diploid node. e, Circos plots of whole-genome single cell sequencing data showing mutations detected in two or more cells. f, Heatmap of coding mutations detected by single-nuclei exome sequencing. Mutations detected by whole genome sequencing (pop) and exome sequencing (ex) are also displayed.
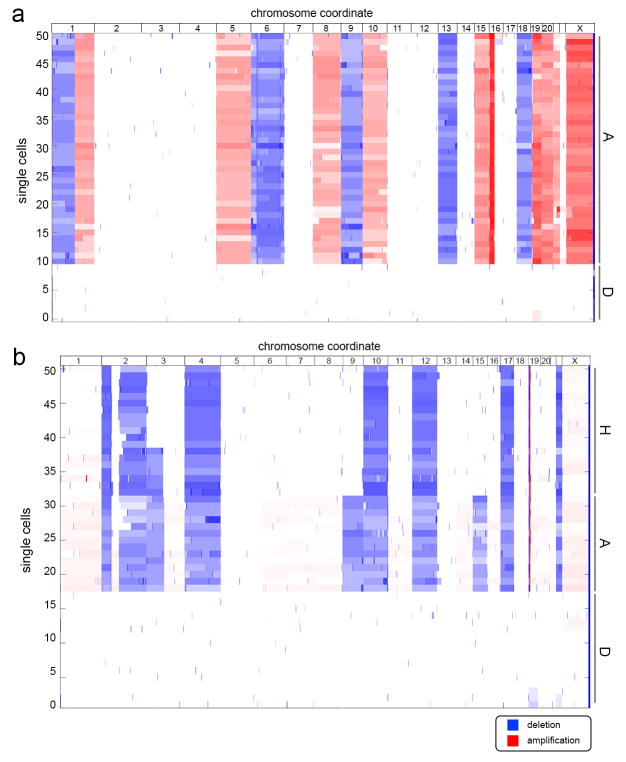
To investigate copy number diversity, we performed SNS11,18 on 50 single nuclei. We constructed a neighbor-joining tree, which showed that single tumor cells shared highly similar CNAs (mean R2= 0.89), representing a monoclonal population (Fig. 2d, Extended Fig. 3a). Next, we performed whole-genome sequencing of four single tumor nuclei at high coverage breadth (80.79 ± 3.31 sem, n=4) and depth (mean 46.75X ± 5.06 sem, n=4). From this data we identified three classes of mutations: 1) clonal mutations that were detected in the population sample and in the majority of single tumor cells, 2) subclonal mutations that occurred in two or more single cells, but were not detected in the bulk tumor, and 3) de novo mutations that were detected in only one tumor cell. The de novo mutations are difficult to distinguish from technical errors and were therefore excluded from our initial analysis. In total we detected 12 clonal nonsynonymous mutations and 32 subclonal mutations (Fig. 2e). Many subclonal mutations occurred in intergenic regions; however two mutations (MARCH11 and CABP2) were found in coding regions (Supplementary Table 4).
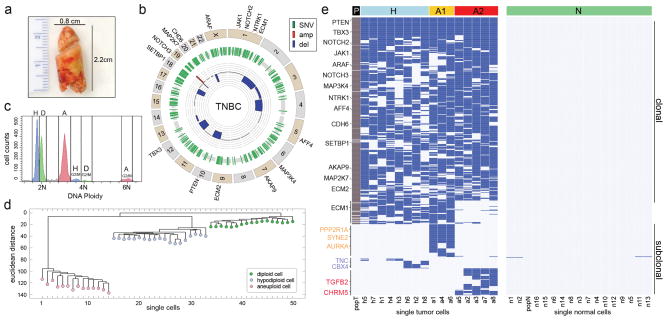
Figure 3. Single Cell and Population Sequencing of a TNBC.
a, Frozen TNBC specimen. b, Circos plot of mutations and CNAs detected by population sequencing of the TNBC, with cancer genes on the outer ring. c, Flow-sorting histogram of ploidy distributions, showing three major subpopulations: diploid (D), hypodiploid (H) and aneuploid (A). d, Neighbor-joining tree of 50 single cell integer copy number profiles, rooted by the diploid node. e, Clustered heatmap of the nonsynonymous point mutations detected by single nuclei exome sequencing and population sequencing (P). Mutations detected in one cell are excluded.
To identify additional subclonal mutations, we performed single nuclei exome sequencing on a larger set of cells (47 tumor cells and 12 normal cells). Each nucleus was sequenced at 46.78X (± 4.95, sem, n=59) coverage depth and 92.77%(± 4.85, sem, n=59) coverage breadth, from which somatic mutations were detected (Supplementary Table 5). The mutations were clustered and sorted by frequency to construct a heatmap (Fig. 2f). As expected the 17 clonal mutations identified by population sequencing were present in a many of the single tumor cells, however we also identified 22 new subclonal mutations. In contrast, only a single subclonal mutation was detected in the 12 normal cells (Fig. 2f, right panel).
Population and Single Nuclei Sequencing of a TNBC
We then proceeded to analyze a triple-negative (ER−/PR−/Her2−) breast cancer (TNBC) (Fig. 3a). We performed population sequencing of the bulk tumor (72X) and matched normal tissue (74X), and identified 374 nonsynonymous mutations. A number of mutations occurred in cancer genes, including PTEN, TBX3, NOTCH2, JAK1, ARAF, NOTCH3, MAP3K4, NTRK1, AFF4, CDH6, SETBP1, AKAP9, MAP2K7, ECM2 and ECM1 (Supplementary Table 6) (Fig. 3b). Many of these mutations were previously reported in the TCGA breast cancer cohort7. Pathway analysis revealed two major pathways that were disrupted during tumor evolution: TGFβ (p=9.9e-2) and extracellular matrix-receptor signaling (p=2.7e-2). Copy number profiling identified many chromosomal deletions, in addition to a focal amplification on chromosome 19p13.2 (Fig. 3b).
To investigate genomic diversity at single-cell resolution, we performed copy number profiling and exome sequencing. We flow-sorted 50 single nuclei from the H, D and A ploidy distributions for copy number profiling using SNS (Fig. 3c). Neighbor-joining revealed two distinct subpopulations of tumor cells (A and H) in addition to the normal diploid cells (Fig. 3d). The single cell copy number profiles were analyzed using clustered heatmaps, which showed highly similar rearrangements within each subpopulation (A mean R2= 0.91, H mean R2 = 0.88), but were distinguished by two large deletions on chromosome 9 and 15 (Extended Data Fig. 3b).
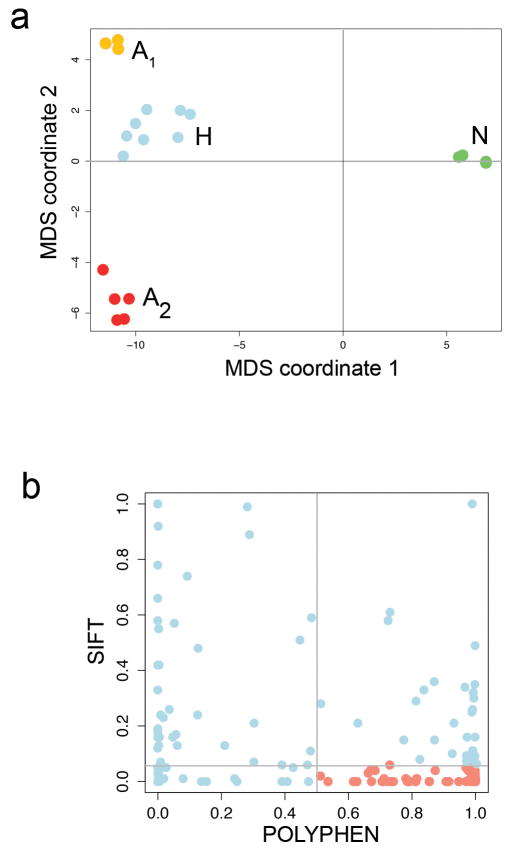
Next, we flow-sorted 16 single tumor nuclei from the G2/M peaks (H and A) and 16 single normal nuclei for exome sequencing using Nuc-Seq (Fig. 3e). Nonsynonymous point mutations were used to perform hierarchical clustering and multi-dimensional scaling (MDS). As expected, the 374 clonal nonsynonymous mutations detected by bulk sequencing were found in the majority of the single tumor cells, however we also identified 145 additional subclonal nonsynonymous mutations that were not detected in the bulk tumor (Supplementary Table 7). MDS identified 4 distinct clusters, corresponding to three tumor subpopulations (H, A1 and A2) and the normal cells (Extended Data Fig. 5a). Hierarchical clustering showed that many of the subclonal mutations occurred exclusively in one subpopulation (H, A1 or A2) (Fig. 3e). The A1 subpopulation contained 66 private subclonal nonsynonymous mutations, including AURKA, SYNE2 and PPP2R1A. The A2 subpopulation contained 52 private subclonal nonsynonymous mutations includingTGFB2 and CHRM5. In contrast only two subclonal mutations were shared between the normal cells (Fig. 3e, right panel). Many of the subclonal mutations (23.44%) were predicted to damage protein function by both POLYPHEN21 and SIFT22 (Extended Data Fig. 5b).
Single-Molecule Targeted Deep Sequencing
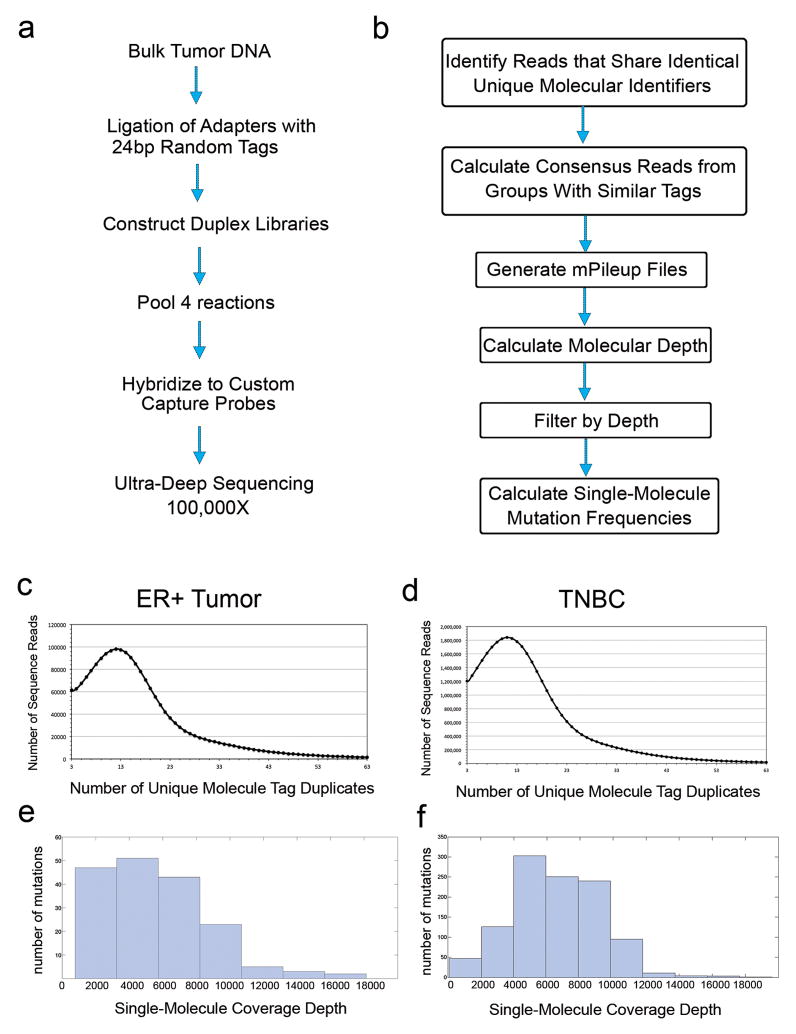
To validate the mutations detected by single cell sequencing and determine their frequencies in the bulk tumor, we performed targeted single-molecule deep-sequencing. Duplex libraries were constructed from bulk tissue to reduce the error rate of next-generation sequencing10. Custom capture platforms were designed to target mutations detected in the single cells of the ER and TNBC tumors (methods). Targeted deep-sequencing (116,952X) was performed in the ER tumor resulting in a single molecule coverage depth of 5,695X using single-strand consensus sequences (SSCS). Deep-sequencing of the TNBC (118,743X) resulted in a single-molecule coverage depth of 6,634X using SSCS (Extended Data Fig. 4). We found that 61.5% of the reads were in the target regions in the ER tumor and 80.2% in the TNBC.
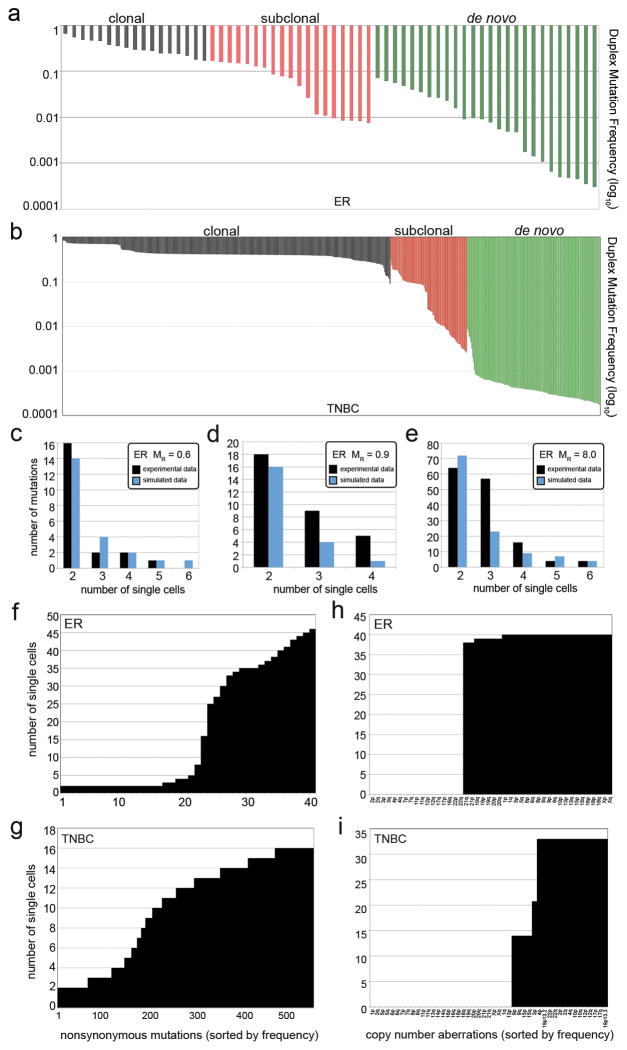
The ER duplex data validated 94.44% (17/18) of the clonal mutations, 90.47% (19/21) of the subclonal mutations, and 19.40% (26/134) of the de novo mutations detected by single-cell sequencing (p < 0.01) (methods). The clonal mutations occurred at high frequencies in the tumor mass, while the subclonal mutations (0.0895 mean) and de novo mutations (0.0195 mean) were very rare (Fig. 4a). Similarly, in the TNBC we validated 99.73% (374/375) of the clonal mutations, 64.83% (94/145) of the subclonal mutations and 26.99% (152/563) of the de novo mutations (p < 0.01) (methods). Similarly, we found that the clonal mutations in the TNBC showed high frequencies (0.4457 mean), while the subclonal mutations were less prevalent (0.050 mean) and the de novo mutations were very rare (0.00047 mean) (Fig. 4b). This data suggests that many of the subclonal and de novo mutations are likely to be real biological variants that occur at low frequencies in the tumor mass.
Figure 4. Duplex Mutation Frequencies and Mutation Rates.
a, ER duplex mutation frequencies from targeted deep-sequencing of the bulk tumor tissue b, TNBC duplex mutation frequencies from deep-sequencing of the bulk tumor tissue. c–e, Mathematical modeling of mutation rates compared to experimental data. c, ER single-nuclei exome and modeling data at 0.6 mutation rate d, ER whole-genome single nuclei and modeling data at 0.9 mutation rate e, TNBC single nuclei exome and modeling data at mutation rate of 8. f, mutation frequencies shared by 2 or more cells in the ER tumor g, mutation frequencies shared by 2 or more cells in the TNBC f, CNAs shared by two or more cells in the ER tumor h, CNAs shared by two or more cells in the TNBC.
Mathematical Modeling of the Mutation Rates
To estimate the mutation rates in each tumor, we used the single cell mutation frequencies and designed a mathematical stochastic birth-and-death process model that uses experimentally derived parameters for cell birth rates (Ki-67 staining), cell death rates (caspase-3 staining), total tumor cell numbers (flow-sorting cell counts) and the tumor mass doubling time for invasive carcinomas (mean=168 days)23–25 (methods). We modeled data for a series of mutation rates and compared the data to the empirical single cell mutation frequency distributions (Supplementary Table 8). Our data suggest that the ER+ breast tumor had a mutation rate of MR = 0.6 mutations per cell division for the exome data (Fig. 4c) and MR = 0.9 for the single-cell whole genome data (Fig. 4d). These data are similar to the error rates reported for normal cells, which are approximately 0.6 mutations per cell division (error rate = 1e-10) 26–28. In contrast, our modeling suggests a mutation rate of MR= 8 for the TNBC tumor, suggesting a 13.3X fold increase relative to normal cells (Fig. 4e).
Discussion
In this study we report the development of a novel single cell genome sequencing method that utilizes G2/M nuclei to achieve high-coverage data with low error rates. Although G2/M nuclei were used in this study, the experimental protocol can also be used to sequence nuclei at any stage of the cell cycle. We applied Nuc-Seq to delineate clonal diversity and investigate mutational evolution in two breast cancer patients. Our data clearly show that no two single tumor cells are genetically identical, questioning the definition of a clone. In both patients we observed a large number of subclonal and de novo mutations. These data suggests that point mutations evolved gradually over long periods of time, generating extensive clonal diversity (Fig. 4f–g). In contrast, the single cell copy number profiles were highly similar, suggesting that chromosome rearrangements occurred early, in punctuated bursts of evolution, followed by stable clonal expansions to form the tumor mass (Fig. 4h–i).
We previously reported punctuated copy number evolution by sequencing single cells from a TNBC patient11. This model has also been supported by bulk sequencing data in prostate cancer29 and in rearrangement patterns called firestorms30 or chromothripsis31. A punctuated model is consistent with the mechanisms that underlie CNAs, including chromosome missegregation32, cytokinesis defects and breakage-fusion-bridge33, which can generate complex rearrangements in just a few cell divisions. In contrast, point mutations occur through defects in DNA repair or replication machinery34, which accumulate more gradually over many cell divisions. Our data are consistent with these mechanisms, and further show that two distinct molecular clocks were operating at different stages of tumor growth (Extended Data Fig. 6).
A pervasive problem in the field is the inability to validate mutations that are detected in single cells. To address this problem, we combined single cell sequencing with targeted single-molecule deep-sequencing. This approach not only validates mutations, but also measures the precise mutation frequencies in the bulk population. Using this approach, we identified hundreds of subclonal and de novo mutations that were present at low frequencies (<10%) in the tumor mass. These rare mutations may play an important role in diversifying the phenotypes of cancer cells, allowing them to surive selective pressures in the tumor microenvironment, including the immune system, hypoxia and chemotherapy35,36.
A question in the field of chemotherapy is whether resistance mutations are pre-existing in rare cells in the tumor, or alternatively, emerge spontaneously in response to being challenged by the therapeutic agent. While this question has been studied for decades in bacteria37 it remains poorly understood in human cancers. Our data suggest that a large number of diverse mutations are likely to be pre-existing in the tumor mass, prior to chemotherapy. Our data also has important implications for the mutator phenotype, which posits that tumor evolution is driven by increased mutation rates34,38. While TCGA studies39–41 report increased mutation frequencies, it remains unclear whether these mutations accumulate over many cell divisions (at a normal error rate) or through an increased mutation rate. Our TNBC data suggest an increased mutation rate (13.3X) relative to the normal cells, supporting this model.
On a final note, we expect that single cell genome sequencing will open up new avenues of investigation in many diverse fields of biology. In cancer research there will be immediate applications for studying cancer stem cells and circulating tumor cells. In the clinic these tools will have important applications in early detection and non-invasive monitoring. Beyond cancer, these tools will have important applications in microbiology, development, immunology and neuroscience and will lead to vast improvements in our fundamental understanding of human diseases.
Extended Data
Extended Data Figure 1. Nuc-Seq Method.
a, Nuclear suspensions were prepared and stained with DAPI for flow-sorting, showing distributions of ploidy. The G2/M distribution was gated and single nuclei were deposited into wells. b, Cells were lysed and incubated with the Φ29 polymerase to perform multiple-displacement-amplification for a limited isothermal time-frame. Sequence libraries were prepared using one of two methods: c, Tn5 tagmentation, or d, low-input TA ligation cloning (see methods section). e, exome capture was optionally performed to isolate gDNA in exonic regions f, libraries were sequenced on the Illumina HiSeq2000 system. g, somatic mutations were detected using a custom processing pipeline (methods).
Extended Data Figure 2. Evaluation of WGA Efficiency Using Chromosome-Specific Primers.
Whole genome amplified DNA from each single cell was used to perform PCR quality control experiments to determine WGA efficiency. For each cell, 22 reactions were performed using primer pairs that target each autosome and the resulting 200bp PCR product were separated by gel electrophoresis (methods). a, Two single nuclei were flow-sorted from the G2/M gate and amplified to WGA followed by PCR using 22 primer pairs b, Two single nuclei were flow-sorted from the G1/0 gate and subject to WGA followed by PCR using 22 primer pairs. PCR products that failed to amplify are marked with an ‘x’ on the gel.
Extended Data Figure 3. Clustered Heatmaps of Single Cell Copy Number Profiles.
Single cell segmented copy number profiles were clustered and used to build heatmaps, showing amplifications in red and deletions in blue. a, Copy number profiles of 50 single cells from the ER breast tumor. b, Copy number profiles of 50 single cells from the TNBC patient.
Extended Data Figure 4. Duplex Single-Molecule Targeted Deep-Sequencing.
a, Experimental protocol for generating duplex libraries from bulk tumor DNA for custom capture and targeted ultra-deep sequencing. b, Data processing pipeline for duplex data to generate single-molecule data and detect mutation frequencies. c, Distribution of unique molecule tag duplicates for the ER breast cancer patient d, Distribution of unique molecule tag duplicates for the TNBC e, single-molecule coverage depth distribution for the ER+ tumor data f, single-molecule coverage depth distribution for the TNBC data.
Extended Data Figure 5. TNBC Multi-dimensional Scaling and Protein Prediction Plots.
a, Multi-dimensional scaling plot of the nonsynonymous mutations from the single-nuclei exome sequencing data in the TNBC b, Polyphen and SIFT protein impact prediction scores for the subclonal mutations in the TNBC patient.
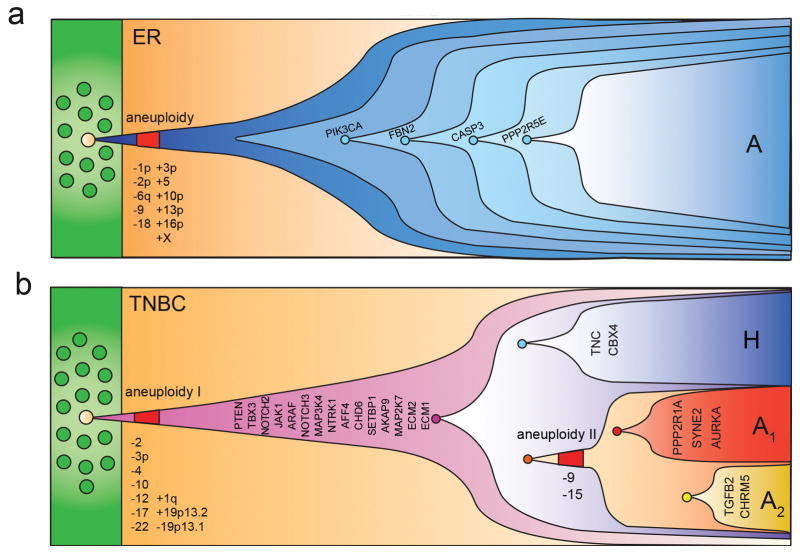
Extended Data Figure 6. Models of Clonal Evolution in Breast Cancer.
a, Clonal evolution in the ER breast tumor inferred from single cell exome and copy number data. b, Clonal evolution in the TNBC inferred from single cell exome and copy number data.
Supplementary Material
Acknowledgments
We thank Louis Ramagli, Hongli Tang, Erika Thompson, Wendy Schober and Jessica Tyler. We are gratefully to Scott Kennedy and Lawrence Loeb for help with the Duplex protocols. We thank Mary Edgerton, James Hicks, Michael Wigler and Jude Kendall for useful discussions. We thank Ralf Krahe and Mei Rui for reviewing the manuscript.
Funding Agencies
N.N. is a Nadia’s Gift Foundation Damon Runyon-Rachleff Innovator (DRR-25-13). This research was supported by grants to N.N. from NIH (R21CA174397-01) and NCI (1RO1CA169244-01). N.N. was supported by T.C. Hsu and the Alice-Reynolds Kleberg Foundation. N.N. and P.S. were supported by the Center for Genetics & Genomics. F.M.B was supported by an NIH UL1 (TR000371) and Susan Komen (SAC10006). K.C. was supported by the NCI (RO1CA172652). H.L. was supported by the NIH (U24CA143883). F.M. was supported by PS-OC (U54CA143798). K.C. and H.L. were supported by the Dell Foundation. M.L. is a CPRIT scholar. This work was also supported by an NCI center grant (CA016672).
Footnotes
Author Contributions
Y.W. performed experiments and data analysis. M.L., J.W., A.M., X.S. performed experiments. A.U. W.R., K.C., H.L.,P.S. and S.V. performed data and statistical analyses. H.Z. and F.M.B obtained clinical samples. R.Z. and F.M. performed modeling. N.N. performed experiments, analyzed data and wrote the manuscript.
Data Access
The data from this study has been deposited into the Sequence Read Archive (SRA053195).
References
- 1.Torres L, et al. Intratumor genomic heterogeneity in breast cancer with clonal divergence between primary carcinomas and lymph node metastases. Breast Cancer Res Treat. 2007;102:143–155. doi: 10.1007/s10549-006-9317-6. [DOI] [PubMed] [Google Scholar]
- 2.Navin N, et al. Inferring tumor progression from genomic heterogeneity. Genome Res. 2010;20:68–80. doi: 10.1101/gr.099622.109. gr.099622.109 [pii] [DOI] [PMC free article] [PubMed] [Google Scholar]
- 3.Park SY, Gonen M, Kim HJ, Michor F, Polyak K. Cellular and genetic diversity in the progression of in situ human breast carcinomas to an invasive phenotype. J Clin Invest. 2010;120:636–644. doi: 10.1172/JCI40724. 40724 [pii] [DOI] [PMC free article] [PubMed] [Google Scholar]
- 4.Sorlie T, et al. Gene expression patterns of carcinomas distinguish tumor subclasses with clinical implications. Proc Natl Acad Sci U S A. 2001;98:10869–10874. doi: 10.1073/pnas.191367098. [DOI] [PMC free article] [PubMed] [Google Scholar]
- 5.Curtis C, et al. The genomic and transcriptomic architecture of 2,000 breast tumours reveals novel subgroups. Nature. 2012 doi: 10.1038/nature10983. nature10983 [pii] [DOI] [PMC free article] [PubMed] [Google Scholar]
- 6.Shah SP, et al. The clonal and mutational evolution spectrum of primary triple-negative breast cancers. Nature. 2012;486:395–399. doi: 10.1038/nature10933. nature10933 [pii] [DOI] [PMC free article] [PubMed] [Google Scholar]
- 7.Comprehensive molecular portraits of human breast tumours. Nature. 2012;490:61–70. doi: 10.1038/nature11412. [DOI] [PMC free article] [PubMed] [Google Scholar]
- 8.Nik-Zainal S, et al. The life history of 21 breast cancers. Cell. 2012;149:994–1007. doi: 10.1016/j.cell.2012.04.023. S0092-8674(12)00527-2 [pii] [DOI] [PMC free article] [PubMed] [Google Scholar]
- 9.Ellis MJ, et al. Whole-genome analysis informs breast cancer response to aromatase inhibition. Nature. 2012;486:353–360. doi: 10.1038/nature11143. nature11143 [pii] [DOI] [PMC free article] [PubMed] [Google Scholar]
- 10.Schmitt MW, et al. Detection of ultra-rare mutations by next-generation sequencing. Proc Natl Acad Sci U S A. 2012;109:14508–14513. doi: 10.1073/pnas.1208715109. [DOI] [PMC free article] [PubMed] [Google Scholar]
- 11.Navin N, et al. Tumour evolution inferred by single-cell sequencing. Nature. 2011 doi: 10.1038/nature09807. nature09807 [pii] [DOI] [PMC free article] [PubMed] [Google Scholar]
- 12.Woyke T, et al. One bacterial cell, one complete genome. PLoS One. 2010;5:e10314. doi: 10.1371/journal.pone.0010314. [DOI] [PMC free article] [PubMed] [Google Scholar]
- 13.Dichosa AE, et al. Artificial polyploidy improves bacterial single cell genome recovery. PLoS One. 2012;7:e37387. doi: 10.1371/journal.pone.0037387. [DOI] [PMC free article] [PubMed] [Google Scholar]
- 14.Hou Y, et al. Single-cell exome sequencing and monoclonal evolution of a JAK2-negative myeloproliferative neoplasm. Cell. 2012;148:873–885. doi: 10.1016/j.cell.2012.02.028. S0092-8674(12)00228-0 [pii] [DOI] [PubMed] [Google Scholar]
- 15.Klein CA, et al. Comparative genomic hybridization, loss of heterozygosity, and DNA sequence analysis of single cells. Proc Natl Acad Sci USA. 1999;96:4494–4499. doi: 10.1073/pnas.96.8.4494. [DOI] [PMC free article] [PubMed] [Google Scholar]
- 16.Adey A, et al. Rapid, low-input, low-bias construction of shotgun fragment libraries by high-density in vitro transposition. Genome Biol. 2010;11:R119. doi: 10.1186/gb-2010-11-12-r119. gb-2010-11-12-r119 [pii] [DOI] [PMC free article] [PubMed] [Google Scholar]
- 17.Kytola S, et al. Chromosomal alterations in 15 breast cancer cell lines by comparative genomic hybridization and spectral karyotyping. Genes Chromosomes Cancer. 2000;28:308–317. doi: 10.1002/1098-2264(200007)28:3<308::AID-GCC9>3.0.CO;2-B. [pii] [DOI] [PubMed] [Google Scholar]
- 18.Baslan T, et al. Genome-wide copy number analysis of single cells. Nat Protoc. 2012;7:1024–1041. doi: 10.1038/nprot.2012.039. nprot.2012.039 [pii] [DOI] [PMC free article] [PubMed] [Google Scholar]
- 19.Zong C, Lu S, Chapman AR, Xie XS. Genome-wide detection of single-nucleotide and copy-number variations of a single human cell. Science. 2012;338:1622–1626. doi: 10.1126/science.1229164. [DOI] [PMC free article] [PubMed] [Google Scholar]
- 20.Lorenz MO. Methods of measuring the concentration of wealth. Journal of the American Statistical Association. 1905;9:209–219. [Google Scholar]
- 21.Adzhubei IA, et al. A method and server for predicting damaging missense mutations. Nat Methods. 2010;7:248–249. doi: 10.1038/nmeth0410-248. nmeth0410-248 [pii] [DOI] [PMC free article] [PubMed] [Google Scholar]
- 22.Ng PC, Henikoff S. SIFT: Predicting amino acid changes that affect protein function. Nucleic Acids Res. 2003;31:3812–3814. doi: 10.1093/nar/gkg509. [DOI] [PMC free article] [PubMed] [Google Scholar]
- 23.Kuroishi T, et al. Tumor growth rate and prognosis of breast cancer mainly detected by mass screening. Jpn J Cancer Res. 1990;81:454–462. doi: 10.1111/j.1349-7006.1990.tb02591.x. [DOI] [PMC free article] [PubMed] [Google Scholar]
- 24.Peer PG, van Dijck JA, Hendriks JH, Holland R, Verbeek AL. Age-dependent growth rate of primary breast cancer. Cancer. 1993;71:3547–3551. doi: 10.1002/1097-0142(19930601)71:11<3547::aid-cncr2820711114>3.0.co;2-c. [DOI] [PubMed] [Google Scholar]
- 25.James Michaelson SS, Moore Richard, Weber Griffin, Halpern Elkan, Garland Andrew, Kopans Daniel B. Estimates of Breast Cancer Growth Rate and Sojourn Time from Screening Database Information. Journal of Women’s Imaging. 2003;5:11–19. [Google Scholar]
- 26.Nachman MW, Crowell SL. Estimate of the mutation rate per nucleotide in humans. Genetics. 2000;156:297–304. doi: 10.1093/genetics/156.1.297. [DOI] [PMC free article] [PubMed] [Google Scholar]
- 27.Drake JW, Charlesworth B, Charlesworth D, Crow JF. Rates of spontaneous mutation. Genetics. 1998;148:1667–1686. doi: 10.1093/genetics/148.4.1667. [DOI] [PMC free article] [PubMed] [Google Scholar]
- 28.Preston BD, Albertson TM, Herr AJ. DNA replication fidelity and cancer. Seminars in cancer biology. 2010;20:281–293. doi: 10.1016/j.semcancer.2010.10.009. [DOI] [PMC free article] [PubMed] [Google Scholar]
- 29.Baca SC, et al. Punctuated evolution of prostate cancer genomes. Cell. 2013;153:666–677. doi: 10.1016/j.cell.2013.03.021. [DOI] [PMC free article] [PubMed] [Google Scholar]
- 30.Hicks J, et al. Novel patterns of genome rearrangement and their association with survival in breast cancer. Genome Res. 2006;16:1465–1479. doi: 10.1101/gr.5460106. [DOI] [PMC free article] [PubMed] [Google Scholar]
- 31.Stephens PJ, et al. Massive genomic rearrangement acquired in a single catastrophic event during cancer development. Cell. 2011;144:27–40. doi: 10.1016/j.cell.2010.11.055. S0092-8674(10)01377-2 [pii] [DOI] [PMC free article] [PubMed] [Google Scholar]
- 32.Pellman D. Cell biology: aneuploidy and cancer. Nature. 2007;446:38–39. doi: 10.1038/446038a. [DOI] [PubMed] [Google Scholar]
- 33.McClintock B. The Stability of Broken Ends of Chromosomes in Zea Mays. Genetics. 1941;26:234–282. doi: 10.1093/genetics/26.2.234. [DOI] [PMC free article] [PubMed] [Google Scholar]
- 34.Loeb LA. Human cancers express mutator phenotypes: origin, consequences and targeting. Nat Rev Cancer. 2011;11:450–457. doi: 10.1038/nrc3063. nrc3063 [pii] [DOI] [PMC free article] [PubMed] [Google Scholar]
- 35.Merlo LMF, Pepper JW, Reid BJ, Maley CC. Cancer as an evolutionary and ecological process. Nat Rev Cancer. 2006;6:924–935. doi: 10.1038/nrc2013. [DOI] [PubMed] [Google Scholar]
- 36.Greaves M, Maley CC. Clonal evolution in cancer. Nature. 2012;481:306–313. doi: 10.1038/nature10762. nature10762 [pii] [DOI] [PMC free article] [PubMed] [Google Scholar]
- 37.Luria SE, Delbruck M. Mutations of Bacteria from Virus Sensitivity to Virus Resistance. Genetics. 1943;28:491–511. doi: 10.1093/genetics/28.6.491. [DOI] [PMC free article] [PubMed] [Google Scholar]
- 38.Bielas JH, Loeb KR, Rubin BP, True LD, Loeb LA. Human cancers express a mutator phenotype. Proc Natl Acad Sci U S A. 2006;103:18238–18242. doi: 10.1073/pnas.0607057103. 0607057103 [pii] [DOI] [PMC free article] [PubMed] [Google Scholar]
- 39.Lawrence MS, et al. Mutational heterogeneity in cancer and the search for new cancer-associated genes. Nature. 2013;499:214–218. doi: 10.1038/nature12213. [DOI] [PMC free article] [PubMed] [Google Scholar]
- 40.Alexandrov LB, et al. Signatures of mutational processes in human cancer. Nature. 2013;500:415–421. doi: 10.1038/nature12477. [DOI] [PMC free article] [PubMed] [Google Scholar]
- 41.Kandoth C, et al. Mutational landscape and significance across 12 major cancer types. Nature. 2013;502:333–339. doi: 10.1038/nature12634. [DOI] [PMC free article] [PubMed] [Google Scholar]
Associated Data
This section collects any data citations, data availability statements, or supplementary materials included in this article.


