

Abstract
Background
Myocardial hemorrhage after myocardial infarction (MI) usually goes undetected. We investigated the diagnostic accuracy of bright blood T2-weighted cardiac magnetic resonance imaging (MRI) for myocardial hemorrhage in experimental MI.
Methods and Results
MI was created in swine by occluding the left anterior descending (n=10) or circumflex (n=5) coronary arteries for 90 minutes followed by reperfusion for ≤3 days (n=2), 10 days (n=7) or 60 days (n=6). MRI was performed at 1.5 Tesla using bright blood T2-prepared steady-state free-precession, T2* and early (1 min) and late (10 – 15 min) gadolinium enhancement (EGE, LGE, respectively) MRI. Left ventricular sections and histology were assessed for hemorrhage by an experienced cardiac pathologist blinded to the MRI data. Hypointense regions on T2-weighted and contrast-enhanced MRI were independently determined by 3 cardiologists experienced in MRI who were also blinded to the pathology results. Eighty ventricular pathologic sections were matched with MRI (n=68 for EGE MRI). All sections with evidence of MI (n=63 (79%)) also exhibited hyperintense zones consistent with edema on T2-weighted MRI and infarct on LGE MRI. Myocardial hemorrhage occurred in 49 left ventricular sections (61%) and corresponded with signal voids on 48 T2-weighted (98%) and 26 LGE-MRI (53%). Alternatively, signal voids occurred in the absence of hemorrhage in 3 T2-weighted (90% specificity) and 5 LGE MRI (84% specificity). On EGE MRI, 27/43 cases of early MVO corresponded with hemorrhage (63% sensitivity) while 5/25 defects occurred in the absence of hemorrhage (80% specificity). The positive and negative predictive values for pathological evidence of hemorrhage were 94% & 96% for T2-weighted, 84% & 55% for LGE MRI and 85% & 56% for EGE MRI.
Conclusions
Bright blood T2-weighted MRI has high diagnostic accuracy for myocardial hemorrhage.
Keywords: myocardial infarction, magnetic resonance imaging, hemorrhage
The extent of myocardial hemorrhage after acute myocardial infarction is influenced by the duration of ischemia, the severity of myocardial infarction and reperfusion (1-3). Due to imaging limitations, myocardial hemorrhage after acute myocardial infarction (MI) usually goes undetected. In the absence of a diagnostic technique for myocardial hemorrhage, its clinical significance, including the influence of hemorrhage, if any, on drug treatment response and prognosis, are uncertain (4).
Ex vivo experimental MRI studies have provided insights into the pathological basis of hemorrhage in MI. For example, in acute MI, myocardial capillary damage leads to hemorrhage which may be enhanced by coronary reperfusion (1-3). However, in vivo MRI studies have been limited due to artifacts from cardiorespiratory motion and blood flow (5). While advances in MRI now enable detection of hemorrhage in the human heart (6), current dark blood T2-weighted MRI techniques are limited by surface coil intensity problems and spin echo artifact (7), which may reduce diagnostic accuracy clinically (7, 8). The paramagnetic effects of oxidized iron may result in signal loss on T2* and T2 weighted MRI (1, 2). Since changes in myocardial water content and mobility are an early consequence of ischemia (7), alterations in proton transverse relaxation times (T2) enable depiction of myocardial edema and hemorrhage (9).
The specific aim of this study was to validate whether or not myocardial hemorrhage can be reliably detected using bright blood T2 weighted MRI. We hypothesized that bright blood T2 weighted MRI would have high diagnostic accuracy for myocardial hemorrhage. To investigate this hypothesis further, we used cardiac MRI and pathologic studies to evaluate a pre-clinical model of reperfused myocardial infarction.
Methods
MI model
A swine model was adopted since the hearts of swine and man are similar. Swine were pre-treated with anti-platelet drug therapies in order to mimic clinical practice. Yorkshire swine were pre-treated with aspirin 81 mg daily, atenolol 50 mg twice daily and amiodarone 400 mg twice daily for 5 days. Three hundred mg of clopidogrel was given the day before induction of MI. Swine were anesthetized with isofluorane (1.5 – 3%) and ventilated. Eighteen swine were anesthetized. Three of the first four swine experienced acute intractable ventricular fibrillation during coronary balloon inflation and died (mortality rate ∼ 17%). Fifteen swine (43±9.5 kg) survived occlusion of the left anterior descending coronary artery (n=10) or circumflex (n=5) coronary arteries for 90 minutes followed by reperfusion for ≤3 days (n=2), 10 days (n=7) or 60 days (n=6).
Cardiac MRI
Serial cardiac magnetic resonance imaging (MRI) at 1.5-Tesla MAGNETOM Avanto (Siemens Healthcare, Erlangen, Germany) with 12 surface-coil elements. MRI was performed immediately prior to euthanasia on days 0 (2 h post), 3, 10, and 60 post-MI. Myocardial water was imaged by bright blood T2-prepared steady-state free-precession (T2p-SSFP) coupled with automated proton density surface coil intensity correction. T2-infarct imaging was followed by gadolinium (Gd)-DTPA contrast enhanced MRI. The MRI protocol included segmented ECG-gated SSFP (TrueFISP) cine MRI, T2-prepared SSFP (T2p-SSFP) edema MRI (7, 8, 10), multi-echo gradient echo (GRE) T2* weighted, early gadolinium enhancement (EGE, 1 min post-contrast administration) and late gadolinium enhancement (LGE, 10 – 15 min post contrast administration) phase sensitive inversion recovery (PSIR) MRI sequences (11). Sample images are shown in Figures 1 and 2.
Figure 1a.
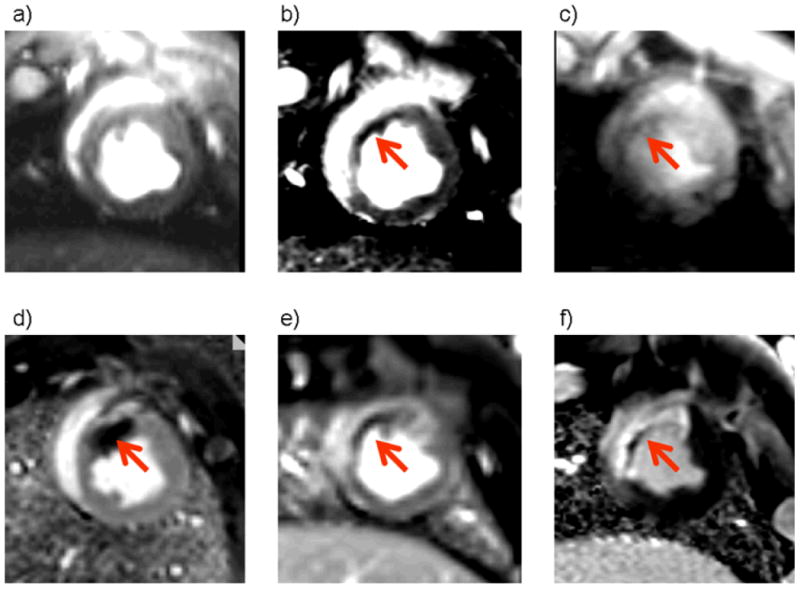
Cardiac MRI diastolic phase images are shown. Upper row, non-contrast MRI: left – a) cine image; middle – b) T2-weighted steady state free precession [SSFP] image; right – c) T2 star image.
Lower row, contrast MRI: left – d) EGE PSIR MRI scan 1 min after gadolinium contrast administration; middle – e) PSIR MRI scan 3 min after contrast administration; right – f) LGE PSIR MRI scan.
Axial views of the left ventricle of a pig three days after anterior myocardial infarction. All images were obtained at the same slice position. Bright blood T2-weighted MRI (b) reveals a hyperintense area in the anterior wall and septum of the left ventricle consistent myocardial edema which is complicated by a central dark area (red arrow) suggestive of myocardial hemorrhage. This dark area is also present on the T2* image (c) indicating the presence of iron. There is early (d, e, red arrow) and late (f) microvascular obstruction within the bright area of infarction revealed by gadolinium contrast enhancement. Taken together, the MRI images are indicative of myocardial hemorrhage which in this case is linked with MVO.
Figure 2a.
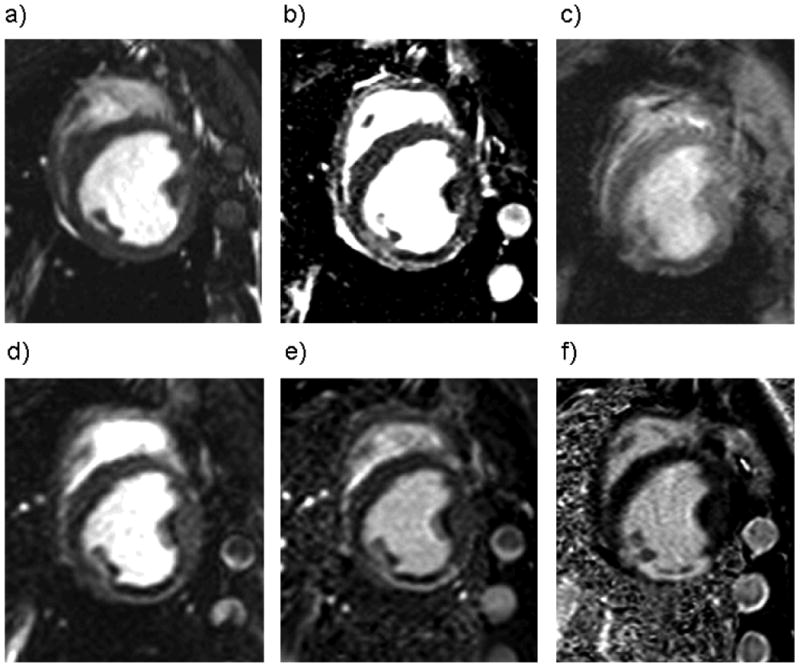
Cardiac MRI diastolic phase images are shown. Upper row, non-contrast MRI: left – a) cine image; middle – b) T2-weighted steady state free precession [SSFP] image; right – c) T2 star image.
Lower row, contrast MRI: left – d) EGE PSIR MRI scan 1 min after gadolinium contrast administration; middle – e) PSIR MRI scan 3 min after contrast administration; right – f) LGE PSIR-MRI scan.
Axial views of the left ventricle of a pig 10 days after reperfused infero-posterior myocardial infarction. All images were obtained at the same slice position. Bright blood T2-weighted MRI (b) reveals a hyperintense area in the posterior wall of the left ventricle consistent myocardial edema which is complicated by a central dark area suggestive of myocardial hemorrhage. This dark area is also present on the T2* image (c) indicating the presence of iron. There is a evidence of early (d, e) and late (f) microvascular obstruction within the bright area of infarction revealed by gadolinium contrast enhancement. Taken together, the MRI images are indicative of myocardial hemorrhage which in this case is linked with MVO.
We used bright blood T2-weighted MRI to avoid bright rim artifacts associated with dark blood T2-STIR MRI (7, 8). A T2 prepared single-shot SSFP sequence with parallel techniques to reduce imaging duration was used to repetitively acquire an interleaved T2 weighted image and a proton density weighted reference mid-diastolic image every 2 R-R intervals (7) using prospective ECG gating. The proton density-weighted image was used for surface coil correction. The typical imaging parameters for this method are listed in Table 1. The T2 preparation time (TE) was 60 ms. Parallel imaging (rate 2) was used and 8 respiratory motion corrected images were obtained per acquisition. The T2* method used a multi-echo GRE sequence which provided T2* contrast and permitted T2* estimates through off-line fitting (Table 1).
Table 1.
Cardiac MRI scan parameters.
| Echo time (TE), ms | Repetition time (TR), ms | Flip angle, ° | Band width, Hz/pixel | Field of view, mm | Matrix | Spatial resolution, mm2 | Slice thickness, mm | ||
|---|---|---|---|---|---|---|---|---|---|
| Cine MRI | True FISP (SSFP) | 1.6 | 25 | 80 | 930 | 300 × 300 | 156 × 192 | 1.9 × 1.6 | 6 |
| T2 weighted MRI | T2p-SSFP | 1.6 | 3.2 | 60 - 90 | 977 | 245 × 327 | 145 × 256 | 1.7 × 1.3 | 6 |
| T2* | T2* | † | 154 | 20 | 977 | 245 × 327 | 128 × 256 | 1.9 × 1.3 | 4 |
| EGE MRI | PSIR-FISP | 1.1 | 557 | 50 | 1000 | 300 × 400 | 108 × 192 | 2.8 × 2.1 | 6 |
| LGE MRI | PSIR turbo FLASH | 2.53 | 403 | 25 | 201 | 215 × 300 | 119 × 256 | 1.8 × 1.2 | 6 |
The T2 preparation time (TE) was 60 ms. Parallel imaging (rate 2) was used and 8 respiratory motion corrected images were obtained per acquisition.
The T2* protocol acquired 16 echoes with echo spacing 2.32 ms, with a minimum echo time of 1.58 ms and a maximum echo time of 36.38 ms (4 phase encodes were acquired per RR with 154 ms imaging duration). The PSIR FLASH had 25 views per segment.
Abbreviations: EGE = early gadolinium enhanced MRI; FISP = fast imaging in steady state precession; LGE = late gadolinium enhanced MRI; MVO = microvascular obstruction; SSFP = steady state free precession; PSIR = segmented phase-sensitive inversion recovery; turbo FLASH = fast low-angle shot.
Microvascular obstruction (MVO) was defined as a dark area on contrast enhanced MRI 1, 3, 5 and 7 minutes post-contrast injection and within an area of LGE. Early and late MVO were determined on PSIR-FLASH scans obtained 1 and 10 – 15 min after contrast administration. MI was imaged using segmented PSIR turbo fast low-angle shot (Table 1) (11), starting about 9 minutes after intravenous injection of 0.15 mmol/kg of gadolinium diethyltriaminepenta-acetic acid (Gd-DTPA, Magnevist, Berlex). The inversion time to achieve myocardial nulling was typically 250 - 300 ms.
MR image analyses
All MR images were analyzed on a Siemens Leonardo workstation (Siemens Healthcare, Erlangen) by cardiologists with at least 3 years MRI experience. All of the cardiologists were experienced in reviewing images from patients with acute MI.
Definition and detection of hemorrhage on T2-weighted MRI
Myocardial hemorrhage revealed by either T2- or T2*-weighted MRI was defined as an area with a mean signal intensity < two standard deviations of the mean signal intensity of the surrounding affected brighter area. T2- and T2*-weighted and contrast enhanced MRI were independently determined by 3 cardiologists blinded to the pathology results. Images were de-identified and analyzed in random order. At the end of the assessment, disagreement was resolved by consensus.
Infarct size
Infarct size was assessed on contrast enhanced images using validated software (12, 13) and expressed as a percentage of left ventricular mass (10).
Pathology
Spatially matched left ventricular sections were visually inspected, photographed and processed for histology with stains which included hematoxylin and eosin and Perl's stain. Gross images and histology were scored for myocardial hemorrhage by an experienced cardiac pathologist blinded to all other data. The main histopathological feature of hemorrhage was extravasated red blood cells within the interstitium between cardiac myocytes (14, 15).
Statistics
The frequencies of categorical data were analyzed with a chi-square test. Inter-rater agreement was determined with the kappa statistic. The sensitivity, specificity, positive predictive value and negative predictive values of low signal areas judged by rater consensus were determined for myocardial hemorrhage on bright blood T2-weighted MRI and T2*-weighted MRI and MVO on EGE and LGE MRI, respectively. In order to allow for possible correlation between images obtained from the same subject (i.e. clustered binary data), sensitivity and specificity were estimated and adjusted using the method of McCarthy and Guo (16).
A significance level of 5% was used in all tests. No adjustment was made to P-values to account for multiple testing. All statistical analyses were performed using STATA version 7 (Statacorp, College Station, TX).
Results
Eighteen swine were anesthetized and subjected to coronary balloon inflation for 90 minutes to induce reperfused MI and 15 (83%) swine survived (Table 2). Eighty ventricular slices of pathology from these 15 swine were matched with MRI (n=68 for EGE MRI, n=55 for T2* MRI, Table 2). The frequency of myocardial hemorrhage is described in Tables 2 and 3. Examples of axial left ventricular MRI scans and matched pathologic sections obtained from one pig with anterior MI and one pig with infero-posterior MI are shown in Figures 1 – 3.
Table 2.
List of subjects (n=15), timing of MRI scans post-MI and availability of scan data matched with pathology.
| Days post-MI | Animal | Mean infarct size (% of LV)* | Images matched with pathology per subject, n=80 (100%) | Images with pathological evidence of hemorrhage, n=49 (61%) | EGE MRI scan images, n=68 (85%) | T2* scan images, n=55 (69%) |
|---|---|---|---|---|---|---|
| Day 0 | 1296 | 13.7 | 5 | 1 | 4 | 5 |
| Day 3 | 1227 | 16.5 | 10 | 5 | 7 | 10 |
| Day 10 | 399 | 21.9 | 2 | 2 | 2 | 0 |
| Day 10 | 1222 | 13.1 | 8 | 6 | 6 | 8 |
| Day 10 | 1223 | 9.6 | 6 | 5 | 6 | 6 |
| Day 10 | 1224 | 4.8 | 7 | 4 | 5 | 7 |
| Day 10 | 1225 | 12.7 | 6 | 5 | 5 | 6 |
| Day 10 | 1226 | 20.9 | 6 | 5 | 5 | 5 |
| Day 10 | 1229 | 13.9 | 6 | 5 | 5 | 5 |
| Day 60 | 397 | 11.3 | 4 | 0 | 4 | 0 |
| Day 60 | 400 | 9.2 | 3 | 3 | 3 | 1 |
| Day 60 | 511 | 1.0 | 5 | 0 | 4 | 1 |
| Day 60 | 512 | 5.7 | 3 | 3 | 3 | 1 |
| Day 60 | 754 | 15.5 | 3 | 0 | 3 | 0 |
| Day 60 | 758 | 2.4 | 6 | 5 | 6 | 0 |
The mean±SD infarct size was 11.5±6.2% of left ventricular mass;
EGE = early gadolinium enhancement MRI.
Table 3.
Timing of post-MI assessments and occurrence of myocardial hemorrhage based on pathologic assessment in 15 swine with reperfused myocardial infarction.
| Days post-MI | Subjects (n) |
Slices (n, %) |
Pathologic evidence of myocardial hemorrhage (n, %) | |
|---|---|---|---|---|
| No | Yes | |||
| 0 | 1 | 5 (6.25) | 4 (80) | 1 (20) |
| 3 | 1 | 10 (12.5) | 5 (50) | 5 (50) |
| 10 | 7 | 41 (50.25) | 9 (22) | 32 (78) |
| 60 | 6 | 24 (30) | 13 (54) | 11 (46) |
|
| ||||
| Total | 15 | 80 (100%) | 31 (39%) | 49 (61%) |
Figure 3.
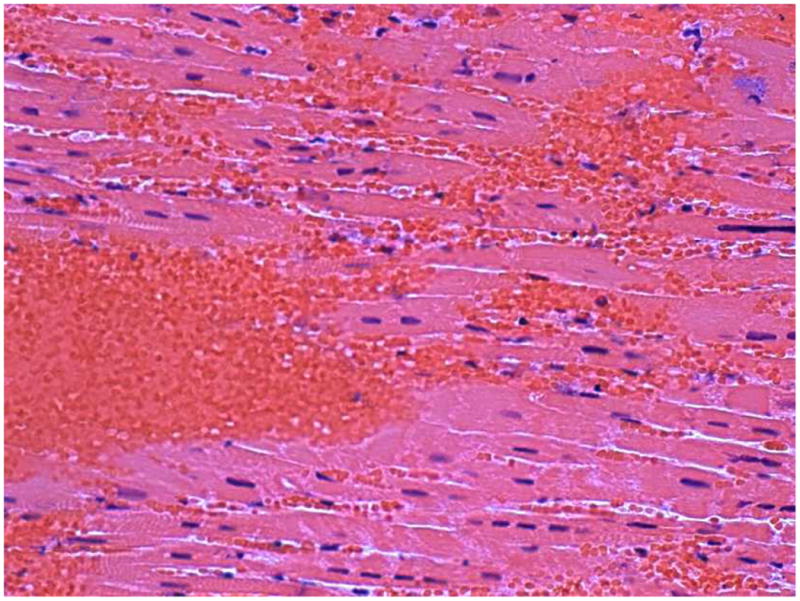
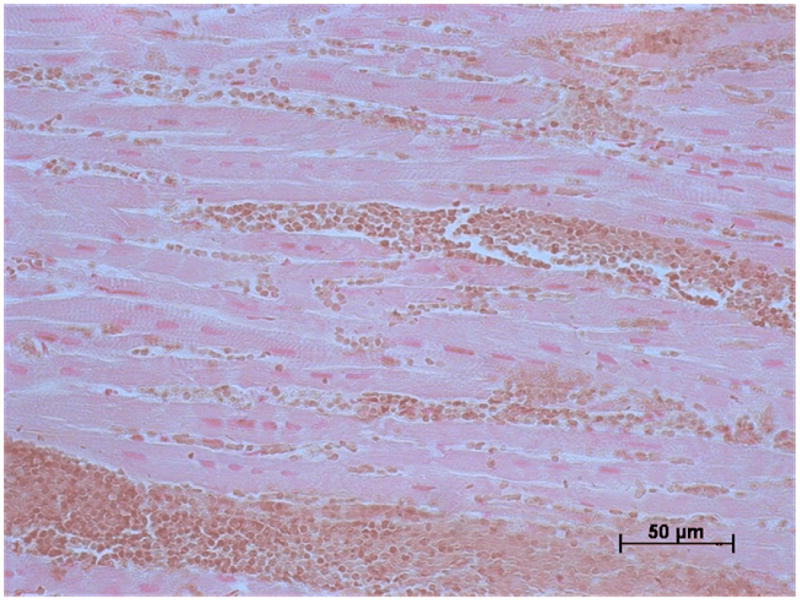
Histology: a) Hematoxylin and eosin and b) Perls' stained sections of myocardial tissue obtained from the infarct border from a pig three days after anterior MI.
a) There is a mass of red blood cells with other red cells interspersed between cardiomyocytes and red blood cells. b) The red cells are brown which is indicative of recent hemorrhage. There is no evidence of positive blue staining which would indicate hemosiderin which develops with more established MI.
Sixty three (79%) sections had pathological evidence of infarction and all of the pathologic sections with evidence of MI also exhibited hyperintense zones consistent with edema on bright blood T2-weighted MRI and infarct on LGE-MRI. Thirty two (51%) of the images with LGE had evidence of MVO on EGE MRI. The frequency of inter-rater agreements for areas of low signal intensity within the infarct zone are described in Table 4.
Table 4.
Disagreements between 3 experienced observers for diagnosis of myocardial hemorrhage based on MRI.*
| Disagreement vs. Observer 1 | Observer 2 | Observer 3 | |
|---|---|---|---|
| T2-weighted MRI | 6 | 4 | 2 |
| Kappa statistic | 0.94 | 0.89 | 1.00 |
|
| |||
| LGE MRI | 2 | 2 | 0 |
| Kappa statistic | 1.0 | 0.92 | 0.97 |
|
| |||
| EGE MRI | 4 | 4 | 0 |
| Kappa statistic | 1.0 | 0.88 | 1.0 |
EGE = Early gadolinium enhanced MRI; Late gadolinium enhanced MRI.
Column 1 relates to the total number of disagreements between Observer 1 and the other two observers. Column 2 shows how many of these disagreements derive from Observer 2 and Column 3 shows how many of these disagreements derive from Observer 3.
The sensitivity, specificity, positive predictive values and negative predictive values for detection of myocardial hemorrhage with bright blood T2 weighted MRI, MVO on LGE-MRI, MVO on EGE MRI and signal voids on T2* weighted MRI are shown in Tables 5 - 8, respectively. Myocardial hemorrhage revealed by pathologic assessment occurred in 49 left ventricular sections (61%) and corresponded with signal voids on 48 T2-weighted MRI (98%; Table 5) and 26 LGE-MRI (53%; Table 6) images. Alternatively, signal voids occurred in the absence of hemorrhage in 3 T2-weighted MRI (90% specificity) and 5 LGE-MRI (84% specificity). On EGE (1 min) MRI (Table 7), 27/43 cases of early MVO corresponded with hemorrhage (63% sensitivity) while 5/25 defects occurred in the absence of hemorrhage (80% specificity). On T2*-weighted MRI, 35/37 low signal intensity areas corresponded with hemorrhage (95% sensitivity) while 1/17 low signal intensity areas occurred in the absence of hemorrhage (Table 8).
Table 5.
Detection of myocardial hemorrhage using bright blood T2-weighted MRI in 80 images matched with pathology. Sensitivity and specificity were adjusted for possible correlation between images for clustered binary data (16).
| Low signal intensity area | No low signal intensity area | Adjusted | |
|---|---|---|---|
| Hemorrhage (n=49) | 48 | 1 | 98% (94 - 100%) sensitivity |
|
| |||
| No hemorrhage (n=31) | 3 | 28 | 90% (83 - 98%) specificity |
|
| |||
| 94% PPV |
96% NPV |
||
Table 8.
Myocardial hemorrhage according to low signal intensity regions on T2*-weighted MRI in 55 images matched with pathology.
| Low signal intensity area | No low signal intensity area | Adjusted | |
|---|---|---|---|
| Hemorrhage (n=37) | 35 | 2 | 95% (86 - 100%) sensitivity |
|
| |||
| No hemorrhage (n=18) | 1 | 17 | 94% (88 - 100%) specificity |
|
| |||
| 97% PPV |
90% NPV |
||
Of 80 T2*-weighted MRI acquisitions, 55 were of diagnostic quality and 35 were affected by posterior field artefacts. MVO – microvascular obstruction, PPV – positive predictive value, NPV – negative predictive value.
Table 6.
Detection of myocardial hemorrhage according to microvascular obstruction (MVO) on LGE MRI in 80 images matched with pathology.
| MVO | No MVO | Adjusted | |
|---|---|---|---|
| Hemorrhage (n=49) | 26 | 23 | 53% (35 - 72%) sensitivity |
|
| |||
| No hemorrhage (n=31) | 5 | 26 | 84% (75 - 93%) specificity |
|
| |||
| 84% PPV |
55% NPV |
||
Table 7.
Detection of myocardial hemorrhage according to microvascular obstruction (MVO) on EGE MRI (1 min) in 68 images matched with pathology.*
| early MVO | No early MVO | Adjusted | |
|---|---|---|---|
| Hemorrhage (n=43) | 27 | 16 | 63% (43 - 83%) sensitivity |
|
| |||
| No hemorrhage (n=25) | 5 | 20 | 80% (59 - 100%) specificity |
|
| |||
| 85% PPV |
56% NPV |
||
EGE MRI scans were not available for 12 tissue sections.
Discussion
We have used an in vivo large animal model of reperfused MI which closely represents human MI to validate bright blood T2-weighted MRI for the detection of myocardial hemorrhage.
Our results indicate that bright blood T2-prepared SSFP MRI has high diagnostic accuracy for myocardial hemorrhage. The heterogeneity of signal intensity associated with acute MI on T2-weighted MRI is partially due to intra-myocardial hemorrhage. Our results are relevant to clinical practice since recent cohort studies have shown that myocardial hemorrhage is an independent predictor of left ventricular remodeling post-MI (6, 17) and is associated with adverse clinical outcomes (18).
Early and late contrast enhancement MRI scan parameters are physiologically different from hemorrhage, since the contrast-enhanced MRI images are influenced by both infarction and altered perfusion. Therefore, even though early and late MVO on gadolinium enhanced MRI co-localize with the hemorrhage, infarct and MVO are not as closely linked physiologically or diagnostically as T2 and T2* are with hemorrhage. Our observations indicate that hemorrhage was spatially coincident with early MVO but do not prove a causal relationship. Consequently, our observation that the presence of signal voids on T2-weighted MRI has higher specificity than MVO on EGE and LGE MRI (Table 6) for myocardial hemorrhage indicates that only the availability of bright blood T2-weighted MRI enables a diagnosis of myocardial hemorrhage, when present, to characterize infarct pathology and MVO non-invasively. The reduced specificity of MVO for hemorrhage may be because, among other reasons, MVO can be caused by capillary obstruction.
Iron accumulation results in signal loss in affected tissues because the paramagnetic effects of iron induce local irregularities in the magnetic field which in turn cause water protons to lose phase coherence (19, 20). This effect is concentration dependent (21). T2* is related to T2 by summation of transverse relaxation (T2) and magnetic inhomogeneity known as T2 prime (T2′): 1/T2*=1/T2+1/T2′. The short echo times used in the multigradient method mean it is less sensitive to motion artifact. However, T2* weighted MRI has several limitations for assessment of myocardial hemorrhage in routine clinical practice. T2* measurements are affected by problems related to shimming and susceptibility artifacts. Our observations are consistent with those of Reeder et al (22) which indicated that field homogeneities from the anterior and posterior cardiac veins and lungs rendered T2* measurement unreliable in these areas (23). Therefore, since the LV septum is more remote from these areas, myocardial T2* measurements have mainly been restricted to the LV septum in clinical practice.
T2 is influenced by energy exchange with neighboring magnetic moments and is also reduced by oxidized iron deposits but not by extrinsic magnetic field inhomogeneities. Recently, a new T2 method has been developed as an alternative to T2* MRI (23). In patients with thalassemia, the breath hold black blood spin echo method with a non-selective refocusing train developed by He et al (24) confers good reproducibility for myocardial T2 measurement, albeit restricted to the LV septum (25). In fact, myocardial T2 and T2* values have a strong linear correlation in patients with iron overload (R2 = 0.89) indicating that iron accumulation has comparable effects on the relaxation values of these parameters.
Both T2- and T2* weighted MRI have potential applications for detecting myocardial hemorrhage. Theoretically, T2* should be the superior approach to detecting iron changes associated with hemorrhage. In our experience, T2-prepared SSFP has enough sensitivity to pick up on most of these hemorrhages and while T2* measurements are restricted to the LV septum this is not the case for T2 making this approach potentially more applicable for use in patients with a history of myocardial infarction. Only recently have technical advances overcome previous problems such that T2-weighted cardiac MRI is now possible in acute MI patients (7, 8).
Our data (Table 3) suggest that hemorrhage may be more frequently observed 10 days post-MI than acutely (days 0 – 3) or in the longer term (day 60). This observation is consistent with the findings of Folz et al (26) in a pig model of reperfused MI and also of hemorrhagic transformation after brain infarction (27). The pathological basis of a higher frequency of detectable hemorrhage around days 7 – 10 could be due to enhanced capillary fragility, red cell lysis and the development of coagulative necrosis in the infarct healing period. In the longer term, tissue and vascular remodelling may make the chronic appearances of hemorrhage (e.g. hemosiderin deposition) less apparent.
Hemoglobin and related degradation products have differing magnetic susceptibilities according to their oxidation status and compartmentalization within intact cells or decompartmentalization following cell death and release to the extracellular space. T1 and T2 shortening (i.e. relaxation) occur due to the paramagnetic effects of deoxyhemoglobin, which accumulates in coagulative hemorrhagic necrosis. Therefore, T2 weighted MRI may be less susceptible to detection of fresh hemorrhage in the hours after acute MI compared to a few days later when deoxyhemoglobin and hemosiderin have accumulated in the infarct zone.
The bright blood T2-weighted MRI method that we have used was developed to overcome some of the limitations with dark blood T2-weighted MRI, including motion artifact and signal variation with depth of field because of coil sensitivity issues which may both impair diagnostic accuracy (7, 8). T2-prepared SSFP involves a T2 preparation pulse with a steady state free precession readout. This method was developed by Kellman et al (7) in our laboratory and is available as a work-in-progress pulse sequence. The T2-prepared SSFP is available as a single shot method meaning that it can be used during free breathing. Kellman's method also involves acquisition of a B1 field map to provide a proton density reference image which is used to estimate coil sensitivity. Motion correction and averaging are used to enhance signal to noise ratio (SNR) and parallel imaging with phase encode under-sampling of the T2-weighted image is used to accelerate imaging.
Our results lend support for research with T2-weighted MRI for the detection of myocardial hemorrhage in patients with a history of acute MI. Recent studies by Ganame et al (6) and Mather et al (17) using dark blood STIR-MRI have found that myocardial hemorrhage is an independent predictor of adverse left ventricular remodeling in patients treated by primary percutaneous coronary intervention for a first ST elevation MI. Mather et al (17) also found that hemorrhage was associated with QRS duration on a signal-averaged electrocardiogram. In a recent two center cohort study involving 346 patients with reperfused STEMI, Eitel et al (18) demonstrated that a hypointense infarct core on dark blood T2-weighted MRI was a univariable predictor of death, reinfarction and new congestive heart failure post-MI. Our results validate bright blood T2 weighted MRI for detection of myocardial hemorrhage supporting further studies of the functional and prognostic significance of hemorrhage revealed by this new method in acute MI patients.
Given that myocardial hemorrhage revealed by T2 weighted MRI is associated with adverse clinical outcomes post-MI (18) the question now arises as to what therapeutic strategies might be appropriate to improve outcomes patients with this complication.
Limitations
Our observations were not supported by measurement of myocardial iron concentrations. However, hemorrhage and iron were verified by histology, including with Perls' stain.
Figure 1b.
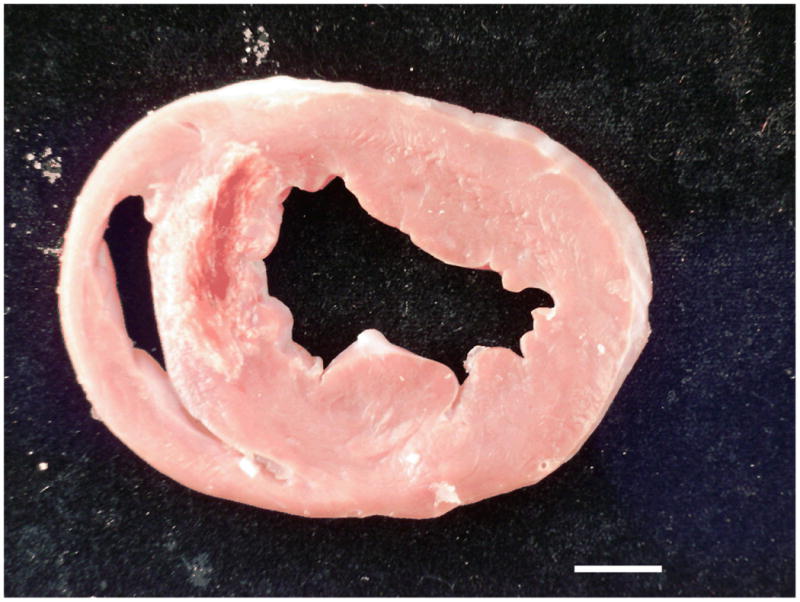
Gross pathology: The photograph of a section of fresh myocardial tissue reveals antero-septal infarction complicated by hemorrhage. The hemorrhage spatially corresponds to the dark area within the infarct territory on the MRI images shown in Figure 1a. The scale bar (bottom right) represents 1 cm.
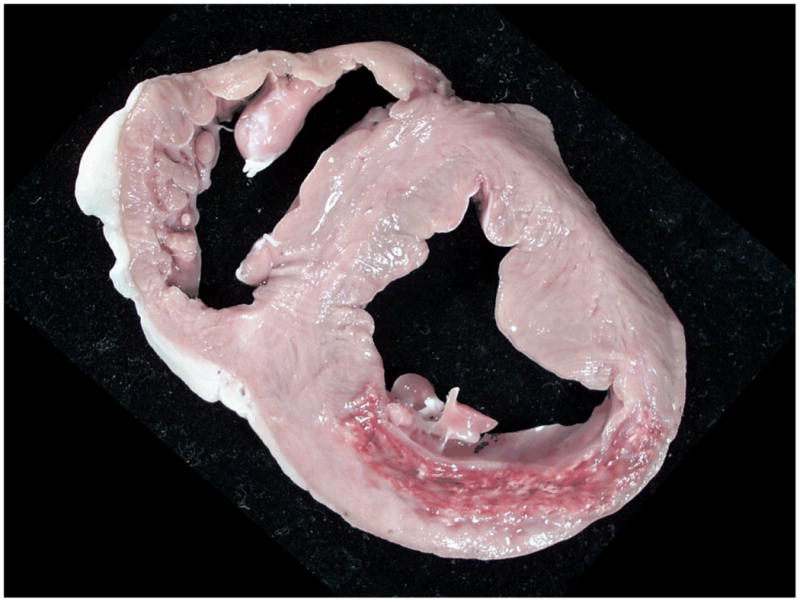
Figure 2b.
Gross pathology: The photograph of a section of fresh myocardial tissue reveals posterior infarction complicated by hemorrhage. The hemorrhage spatially corresponds to the dark area within the infarct territory on the MRI images shown in Figure 2a.
Acknowledgments
We acknowledge the expert assistance of Kathy Lucas and Joni Taylor.
Sources of Funding: This research was funded by the Division of Intramural Research of the National Institutes of Health (Z01-HL004607-12 to AEA, Z01-HL005062-08 to RJL). Dr Payne was supported by a project grant from the Chief Scientist Office, Scotland. Professor Berry is employed in the Institute of Cardiovascular and Medical Sciences, University of Glasgow and holds a Senior Clinical Fellowship from the Scottish Funding Council.
Myocardial hemorrhage after myocardial infarction (MI) usually goes undetected. T2-weighted cardiac magnetic resonance imaging (MRI) has the potential to detect myocardial hemorrhage because of the paramagnetic effects of deoxyhemoglobin. We have used an in vivo large animal model of reperfused MI which closely represents human MI to validate bright blood T2-weighted MRI for the detection of myocardial hemorrhage. MI was created in swine by occluding the left anterior descending coronary artery (n=10) or circumflex (n=5) for 90 minutes followed by reperfusion for ≤3 days (n=2), 10 days (n=7) or 60 days (n=6). MRI was performed at 1.5 Tesla using bright blood T2-prepared steady-state free-precession, T2* and gadolinium enhanced MRI. Left ventricular sections and histology were assessed for hemorrhage by an experienced cardiac pathologist blinded to the MRI data. Hypointense regions on T2-weighted and contrast-enhanced MRI were independently determined by 3 cardiologists experienced in MRI who were also blinded to the pathology results. In 80 images matched with histology, the positive and negative predictive values for pathological evidence of hemorrhage were 94% and 96% for T2-weighted, 84% and 53% for late gadolinium enhanced MRI and 84% and 56% for early gadolinium enhancement. Our results indicate that T2-weighted MRI has high diagnostic accuracy for myocardial hemorrhage. The heterogeneity of signal intensity associated with acute MI on T2-weighted MRI is partially due to intra-myocardial hemorrhage. Our results are relevant to clinical practice since recent cohort studies have shown that myocardial hemorrhage is an independent predictor of adverse left ventricular remodeling post-MI.
Footnotes
Disclosures: None.
References
- 1.Higginson LA, Beanlands DS, Nair RC, Temple V, Sheldrick K. The time course and characterization of myocardial hemorrhage after coronary reperfusion in the anesthetized dog. Circulation. 1983;67:1024–1031. doi: 10.1161/01.cir.67.5.1024. [DOI] [PubMed] [Google Scholar]
- 2.Lotan CS, Bouchard A, Cranney GB, Bishop SP, Pohost GM. Assessment of postreperfusion myocardial hemorrhage using proton NMR imaging at 1.5 T. Circulation. 1992;86:1018–1025. doi: 10.1161/01.cir.86.3.1018. [DOI] [PubMed] [Google Scholar]
- 3.Pislaru SV, Barrios L, Stassen T, Jun L, Pislaru C, Van de Werf F. Infarct size, myocardial hemorrhage, and recovery of function after mechanical versus pharmacological reperfusion: effects of lytic state and occlusion time. Circulation. 1997;96:659–666. doi: 10.1161/01.cir.96.2.659. [DOI] [PubMed] [Google Scholar]
- 4.Kwong RY, Pfeffer MA. Infarct haemorrhage detected by cardiac magnetic resonance imaging: are we seeing the latest culprit in adverse left ventricular remodelling? Eur Heart J. 2009;30:1431–1433. doi: 10.1093/eurheartj/ehp193. [DOI] [PubMed] [Google Scholar]
- 5.Papanikolaou N, Ghiatas A, Kattamis A, Ladis C, Kritikos N, Kattamis C. Non-invasive myocardial iron assessment in thalassaemic patients. T2 relaxometry and magnetization transfer ratio measurements. Acta Radiol. 2000;41:348–351. doi: 10.1080/028418500127345442. [DOI] [PubMed] [Google Scholar]
- 6.Ganame J, Messalli G, Dymarkowski S, Rademakers FE, Desmet W, Van de Werf F, Bogaert J. Impact of myocardial haemorrhage on left ventricular function and remodelling in patients with reperfused acute myocardial infarction. Eur Heart J. 2009;30:1440–1449. doi: 10.1093/eurheartj/ehp093. [DOI] [PubMed] [Google Scholar]
- 7.Kellman P, Aletras AH, Mancini C, McVeigh ER, Arai AE. T2 - prepared SSFP improves diagnostic confidence in edema imaging in acute myocardial infarction compared to turbo spin echo. Magn Reson Med. 2007;57:891–897. doi: 10.1002/mrm.21215. [DOI] [PMC free article] [PubMed] [Google Scholar]
- 8.Payne AR, Casey M, McClure J, McGeoch R, Murphy A, Woodward R, Saul A, Bi X, Zuehlsdorff S, Oldroyd KG, Tzemos N, Berry C. Bright blood T2 weighted MRI has higher diagnostic accuracy than dark blood STIR MRI for detection of acute myocardial infarction and for assessment of the ischemic area-at-risk and myocardial salvage. Circ Cardiovasc Imaging. 2011;4:210–219. doi: 10.1161/CIRCIMAGING.110.960450. [DOI] [PubMed] [Google Scholar]
- 9.Higgins CB, Herfkens R, Lipton MJ, Sievers R, Sheldon P, Kaufman L, Crooks LE. Nuclear magnetic resonance imaging of acute myocardial infarction in dogs: alterations in magnetic relaxation times. Am J Cardiol. 1983;52:184–188. doi: 10.1016/0002-9149(83)90093-0. [DOI] [PubMed] [Google Scholar]
- 10.Berry C, Kellman P, Mancini C, Chen MY, Bandettini WP, Lowrey T, Hsu LY, Aletras AH, Arai AE. Magnetic resonance imaging delineates the ischemic area-at-risk and myocardial salvage in patients with acute myocardial infarction. Circ Cardiovasc Imaging. 2010;3:527–535. doi: 10.1161/CIRCIMAGING.109.900761. [DOI] [PMC free article] [PubMed] [Google Scholar]
- 11.Kellman P, Arai AE, McVeigh ER, Aletras AH. Phase-sensitive inversion recovery for detecting myocardial infarction using gadolinium-delayed hyperenhancement. Magn Reson Med. 2002;47:372–383. doi: 10.1002/mrm.10051. [DOI] [PMC free article] [PubMed] [Google Scholar]
- 12.Hsu LY, Natanzon A, Kellman P, Hirsch GA, Aletras AH, Arai AE. Quantitative myocardial infarction on delayed enhancement MRI. Part I: Animal validation of an automated feature analysis and combined thresholding infarct sizing algorithm. J Magn Reson Imaging. 2006;23:298–308. doi: 10.1002/jmri.20496. [DOI] [PubMed] [Google Scholar]
- 13.Hsu LY, Ingkanisorn WP, Kellman P, Aletras AH, Arai AE. Quantitative myocardial infarction on delayed enhancement MRI. Part II: Clinical application of an automated feature analysis and combined thresholding infarct sizing algorithm. J Magn Reson Imaging. 2006;23:309–314. doi: 10.1002/jmri.20495. [DOI] [PubMed] [Google Scholar]
- 14.Virmani R, Burke A, Farb A, Atkinson JB, editors. Pathology of Myocardial Infarction. 2nd. Chapter 5. WB Saunders; 2001. Cardiovascular Pathology; pp. 155–179. [Google Scholar]
- 15.Schwartz RS, Burke A, Farb A, Kaye D, Lesser JR, Henry TD, Virmani R. Microemboli and microvascular obstruction in acute coronary thrombosis and sudden coronary death: relation to epicardial plaque histopathology. J Am Coll Cardiol. 2009;54:2167–2173. doi: 10.1016/j.jacc.2009.07.042. [DOI] [PubMed] [Google Scholar]
- 16.McCarthy WF, Guo N. The estimation of sensitivity and specificity of clustered binary data. Paper 206-31, SUGI 31 Proceedings. 2006 www2.sas.com/proceedings/sugi31/206-31.pdf.
- 17.Mather AN, Fairbairn TA, Ball SG, Greenwood JP, Plein S. Reperfusion haemorrhage as determined by cardiovascular MRI is a predictor of adverse left ventricular remodelling and markers of late arrhythmic risk. Heart. 2011;97:453–459. doi: 10.1136/hrt.2010.202028. [DOI] [PubMed] [Google Scholar]
- 18.Eitel I, Kubusch K, Strohm O, Desch S, Mikami Y, de Waha S, Gutberlet M, Schuler G, Friedrich MG, Thiele H. Prognostic value and determinants of a hypointense infarct core in T2-weighted cardiac magnetic resonance in acute reperfused ST-elevation-myocardial infarction. Circ Cardiovasc Imaging. 2011;4:354–62. doi: 10.1161/CIRCIMAGING.110.960500. [DOI] [PubMed] [Google Scholar]
- 19.Stark DD. Hepatic iron overload: paramagnetic pathology. Radiology. 1991;179:333–335. doi: 10.1148/radiology.179.2.2014271. [DOI] [PubMed] [Google Scholar]
- 20.Anderson LJ, Holden S, Davis B, Prescott E, Charrier CC, Bunce NH, Firmin DN, Wonke B, Porter J, Walker JM, Pennell DJ. Cardiovascular T2-star (T2*) magnetic resonance for the early diagnosis of myocardial iron overload. Eur Heart J. 2001;22:2171–2179. doi: 10.1053/euhj.2001.2822. [DOI] [PubMed] [Google Scholar]
- 21.Hardy PA, Henkelman RM. Transverse relaxation rate enhancement caused by magnetic particulates. Magn Reson Imaging. 1989;7:265–275. doi: 10.1016/0730-725x(89)90549-3. [DOI] [PubMed] [Google Scholar]
- 22.Reeder SB, Faranesh AZ, Boxerman JL, McVeigh ER. In vivo measurement of T2* and field inhomogeneity maps in the human heart at 1.5T. Magn Reson Med. 1998;39:988–998. doi: 10.1002/mrm.1910390617. [DOI] [PMC free article] [PubMed] [Google Scholar]
- 23.He T, Gatehouse PD, Anderson LJ, Tanner M, Keegan J, Pennell DJ, Firmin DN. Development of a novel optimized breathhold technique for myocardial T2measurement in thalassemia. J Magn Reson Imaging. 2006;(24):580–585. doi: 10.1002/jmri.20681. [DOI] [PubMed] [Google Scholar]
- 24.He T, Smith GC, Gatehouse PD, Mohiaddin RH, Firmin DN, Pennell DJ. On using T2 to assess extrinsic magnetic field inhomogeneity effects on T2* measurements in myocardial siderosis in thalassemia. Magn Reson Med. 2009;61:501–506. doi: 10.1002/mrm.21874. [DOI] [PubMed] [Google Scholar]
- 25.Westwood M, Anderson LJ, Firmin DN, Gatehouse PD, Charrier CC, Wonke B, Pennell DJ. A single breath-hold multiecho T2* cardiovascular magnetic resonance technique for diagnosis of myocardial iron overload. J Magn Reson Imaging. 2003;18:33–39. doi: 10.1002/jmri.10332. [DOI] [PubMed] [Google Scholar]
- 26.Foltz WD, Yang Y, Graham JJ, Detsky JS, Wright GA, Dick AJ. MRI relaxation fluctuations in acute reperfused hemorrhagic infarction. Magn Reson Med. 2006;56:1311–1319. doi: 10.1002/mrm.21079. [DOI] [PubMed] [Google Scholar]
- 27.Bradley W. MR appearance of hemorrhage in the brain. Radiology. 1993;189:15–26. doi: 10.1148/radiology.189.1.8372185. [DOI] [PubMed] [Google Scholar]