

Abstract
Background.
Accumulating evidence suggests that both dietary restriction and exercise (DR + E) should be incorporated in weight loss interventions to treat obese, older adults. However, more information is needed on the effects to lower extremity tissue composition—an important consideration for preserving mobility in older adults.
Methods.
Twenty-seven sedentary women (body mass index: 36.3±5.4kg/m2; age: 63.6±5.6 yrs) were randomly assigned to 6 months of DR + E or a health education control group. Thigh and calf muscle, subcutaneous adipose tissue (SAT), and intermuscular adipose tissue (IMAT) size were determined using magnetic resonance imaging. Physical function was measured using a long-distance corridor walk and knee extension strength.
Results.
Compared with control, DR + E significantly reduced body mass (-6.6±3.7kg vs control: -0.05±3.5kg; p < .01). Thigh and calf muscle volumes responded similarly between groups. Within the DR + E group, adipose tissue was reduced more in the thigh than in the calf (p < .04). Knee extension strength was unaltered by DR + E, but a trend toward increased walking speed was observed in the DR + E group (p = .09). Post hoc analyses showed that reductions in SAT and IMAT within the calf, but not the thigh, were associated with faster walking speed achieved with DR + E (SAT: r = -0.62; p = .01; IMAT: r = -0.62; p = .01).
Conclusions.
DR + E preserved lower extremity muscle size and function and reduced regional lower extremity adipose tissue. Although the magnitude of reduction in adipose tissue was greater in the thigh than the calf region, post hoc analyses demonstrated that reductions in calf SAT and IMAT were associated with positive adaptations in physical function.
Key Words: Body composition, Weight loss, Obesity, Aging, Disability.
Individuals with mobility impairments are less likely to remain in the community, have higher rates of disease, have poorer quality of life, and have greater likelihood of social isolation (1). Obesity is strongly associated with mobility impairments in late life, and therefore, people who are obese have an excess risk of physical disability (2). To combat this public health problem, several studies have evaluated the combination of dietary restriction and multicomponent exercise (DR + E) that includes walking and strength and flexibility exercises. Results demonstrate that this behavioral strategy produces a clinically significant reduction in body mass and an improvement in mobility among obese, older adults (3–5). Weight losses observed in these studies are due to reductions in both muscle and adipose tissue (5)—the former being important to preserve lower extremity muscle function. However, few studies have delineated the effects of DR + E on lower extremity tissue composition in obese, older adults. Such information is important because these adaptations might contribute to mobility improvements seen in obese, older adults who undergo a lifestyle modification.
It is presently unclear how DR + E affects lower extremity tissue composition. Second, it is unknown whether changes in lower extremity tissue composition relate to mobility adaptations in obese, older adults undergoing DR + E. The primary purpose of this pilot study was to investigate the effects of DR + E on changes in muscle, subcutaneous adipose tissue (SAT), and intermuscular adipose tissue (IMAT) within the thigh and calf regions of obese, older adults with impaired physical function. We hypothesized that, compared with a health educational control group, six months of DR + E would significantly reduce lower extremity adipose tissue while preserving muscle size. The secondary purpose of the study was to explore the relationships between changes in body weight and lower extremity tissue composition in the thigh and calf with changes in gait speed—a clinically relevant measure of physical performance and general health status among older adults.
Methods
Participants
This pilot study is registered under clinicaltrials.gov (Clinicaltrials.gov number: NCT01032733), and data on functional adaptations are published elsewhere (6). The pilot study was designed to refine key benchmarks, methods for recruitment, participant retention, adherence to and safety of the interventions, tolerability of the magnetic resonance image (MRI) scanning, and internal validity concerning the efficacy of DR + E by assessing its effects on lower extremity tissue composition and 400-m walk speed. Recruitment focused on obese, sedentary women aged 55–79 years with mild to moderate functional impairments. Mass mailings to the local community and media advertising were used to recruit participants. Participants who were eligible after an initial phone screening were invited for clinic visits during which they signed the informed consent form and completed a personal interview. Specific eligibility criteria were previously published (6). Briefly, eligible participants engaged in <20min/week of aerobic exercise and had a score of 4–10 on the Short Physical Performance Battery (SPPB) (7). Six randomized participants completed an initial MRI scan but did not return for a follow-up scan. These participants were slightly younger (62.6 vs 63.8 years) who had a higher body mass index (BMI; 37.4 vs 36.1kg/m2) and a lower SPPB score (8.7 vs 9.2) compared with participants who completed the final MRI. This study sample includes individuals in which baseline and posttreatment MRI assessments were obtained (N = 27). All participants provided written informed consent based on documents approved by the University of Florida Institutional Review Board.
Study Design
This study utilized a single-blinded design in which personnel responsible for testing were blinded to randomization assignment. Measurements described below were performed before and following 24 weeks of DR + E or education interventions.
Dietary restriction and exercise intervention.—
Participants attended a weekly group-based weight management session for 24 weeks, which was co-led by a registered dietician and a behavioral scientist. Each participant’s dietary assignment represented an approximate 750 kcal/day deficit from baseline intake, intended to produce a 6% reduction in body weight. They followed the American Heart Association’s recommended diet consisting of 55%, 30%, and 15% of energy intake from carbohydrates, fats, and proteins, respectively (8). Participants self-selected and self-reported dietary intake in daily food records after being trained by a registered dietician. During behavioral sessions, the registered dietitian reviewed each food record. The dietician then provided specific suggestions about dietary changes to help participants achieve their caloric goal.
Supervised exercise was performed twice per week. Participants completed two 15-minute bouts of walking separated by resistance and flexibility exercise. Resistance exercise included a wide leg squat, standing leg curl, seated knee extension, side hip raise, and toe stand. Participants performed two sets of each resistance exercise with approximately 1 minute of rest between sets. Flexibility exercises were performed following their second 15-minute walking bout. Participants were also asked to walk at home, with the goal of achieving the recommended 150 minutes per week of moderate intensity physical activity (9).
Walking and resistance exercise were performed in a progressive manner. Following the initial adoption phase, participants were instructed to walk at a moderate intensity. To help participants estimate the intensity at which they were exercising, the Borg Perceived Exertion scale was used (10). This scale is a 15-point self-assessment tool that ranges from 6 to 20. Participants were asked to walk at an intensity level of 13 (activity perception of somewhat hard) on this scale, and they were discouraged from exercising at levels that approached or exceeded 15 (hard) or dropped to a rating of 11 (fairly light) or below. Participants were instructed to walk at a faster pace to maintain the intensity of the walking exercise over the course of the intervention. For the progressive resistance exercise component, interventionists increased resistance as appropriate to achieve an intensity level that corresponded to 15 or 16 (hard) on this scale. Exercise was monitored using weekly physical activity logs and a pedometer (Omron model HJ152, Lake Forest, IL) worn on the hip to monitor compliance. The interventionist also used this information about physical activity levels to help overcome barriers to participant compliance.
Treatment fidelity.—
Treatment fidelity followed principles set forth by the NIH Behavior Change Consortium (11). Specifically, the following components were considered in the context of enhancing treatment fidelity: (1) study design, (2) provider training, (3) delivery of treatment, (4) receipt of treatment, and (5) enactment of treatment skills. Mean attendance at diet and exercise sessions, pedometer readouts, and caloric goals were used as metrics to monitor participants in the DR + E intervention. Body weight was also measured weekly to gauge adherence. A 5%–9% reduction in body weight was the goal of the study. This degree of weight loss is associated with health benefits (12–14) and is the efficacy benchmark used by the Food and Drug Administration in evaluating weight loss medications (15).
Education Intervention.—
Participants in the education control group attended monthly health education lectures on topics relevant to older adults but unrelated to weight loss, diet, or physical activity. Examples of these topics included how to navigate health care, diabetes control, current events, osteoarthritis, and dementia. For incentive and compliance purposes, participants in the education control group were offered the opportunity to participate in the full 24-week DR + E intervention following completion of posttreatment assessments.
Lower Extremity Tissue Compartments
T1-weighted 3D-MRI was used to quantify volumes of the thigh and calf of the right leg using a Phillips 3.0 Tesla magnet (Philips Medical Systems, Bothell, WA). The 3D data were collected using a fast gradient-echo sequence, with TR = 100ms, TE = 10ms, and flip angle of 30º, and a chemically selective fat suppression was utilized. The fat suppression enhanced muscle as high–signal intensity (light grey) pixels and adipose tissue as low–signal intensity pixels (dark grey).
Muscle, SAT, and IMAT were measured volumetrically over 10 contiguous axial slices as previously described by our group (16,17). Images were analyzed using MIPAV (version 1.3; Medical Image Processing, Analysis, and Visualization).
Walking Speed
Walking speed was assessed by the 400-m walk test as described elsewhere (15). Participants were asked to walk 10 laps over a 20-m course at their usual pace. Participants were allowed to stop if necessary but without sitting.
Knee Extension Strength
Maximal knee extension peak torque was measured on the same leg as the MRI using a Biodex isokinetic dynamometer (Shirley, NY). Three sets (five repetitions per set) of isokinetic concentric knee extensions were conducted at 60°/second throughout a full range of motion. Peak torque (in Newton-meters) achieved during the trials was used for data analyses. Additionally, a ratio of knee extension strength as a function of body mass was calculated to determine the functional capacity of the muscle to support tasks that require mobility (18).
Muscle Quality
Muscle quality is a measure of the intrinsic capability of muscle tissue to produce force. It was estimated as the ratio of peak torque to thigh muscle volume (Newton-meter per cubic centimeter).
Anthropometric Measures
Body weight was determined in the morning following an overnight fast and after voiding. BMI (kilogram per square meter) was calculated with body weight and height measured using a stadiometer and standardized procedures.
Statistical Analyses
Differences between intervention group baseline characteristics were evaluated using a one-way analysis of variance for continuous data or Chi-square tests for categorical data. Change from baseline was defined as the value at time t minus the value observed at baseline for all response measures. A regression model was fitted for the change score from baseline (posttest minus pretest) with intervention group, and baseline values were included. Effect sizes were also computed as η2 values for each comparison. According to Cohen, η2 values are interpreted as follows: <.01 ~ small, .06 ~ medium, and >.14 ~ large effect (19). A separate regression model that included an interaction term was fit to test for differences in response by lower extremity region. This latter model was estimated using an unstructured covariance matrix, and the residual errors were estimated independently for the thigh and calf regions. We conducted exploratory analyses to understand whether changes in lower extremity tissue compartments were related to changes in walking speed during the 400-m walking test. Pearson correlations were conducted to evaluate associations between change in gait speed, body weight, and regional tissue compartments. Analyses were conducted using STATA (College Station, TX). Values are presented as mean ± SE unless otherwise noted.
Results
The study sample was evenly divided across race (African American [n = 15 of 27] and Caucasian [n = 12 out of 27]), and randomized groups had a similar racial profile (Table 1). Except for a higher prevalence of endocrine disease conditions (eg, thyroid disorders and diabetes) in the DR + E group, randomized groups were balanced with respect to baseline demographic characteristics.
Table 1.
Descriptive Baseline Characteristics of Participants
| Total (N = 27) | DR + E (n = 14) | Education (n = 13) | p Value for Group Difference | |
|---|---|---|---|---|
| Age (years) | 63.8±6.0 | 63.6±4.7 | 64.0±7.3 | .887 |
| African American, % (n) | 51.8 (14) | 50.0 (7) | 53.8 (7) | .842 |
| Weight (kg) | 92.2±15.2 | 93.8±11.6 | 90.5±18.6 | .580 |
| Height (m) | 1.6±0.06 | 1.6±0.06 | 1.6±0.07 | .434 |
| BMI (kg/m2) | 36.1±5.6 | 36.1±2.9 | 35.9±7.7 | .935 |
| Education (years completed) | 14.4±2.7 | 14.4±2.4 | 14.3±3.2 | .912 |
| Self-report health, % excellent or good health (n)* | 92.6 (25) | 92.8 (13) | 92.3 (12) | .957 |
| Endocrine condition, % (n) | 25.9 (7) | 42.9 (6) | 14.3 (1) | .037 |
| Musculoskeletal, % (n) | 51.8 (14) | 35.7 (5) | 64.2 (9) | .082 |
| Short physical performance battery (SPPB) score* | 9.2±0.92 | 9.2±1.0 | 9.3±0.83 | .836 |
Notes: Values are mean ± SD unless noted otherwise. Endocrine condition includes diabetes, thyroid, and goiter. Musculoskeletal conditions include the following: osteoarthritis, back or knee pain, carpal tunnel syndrome, orthopedic surgical procedure.
*SPPB is a test of physical function commonly used in geriatric research. The test objectively measures a participant on their gait speed, chair rise speed, and balance. The score ranges from 0 to 12 with 12 being the highest physical function (39).
Treatment Fidelity
Participants randomized to the DR + E group lost significantly more body weight than participants in the control group (mean = -6.6±3.7kg vs -0.05±3.5kg, respectively; p < .001, η2 = .46). Sixty-four percent (n = 9) and 7.6% (n = 1) achieved ≥5% weight loss in the DR + E and education groups (difference in proportions: p < .01), respectively. Attendance at group diet sessions was 83±15%. Mean attendance at exercise sessions was 70±26%, and participants walked an average of 161±74.5 minutes per week. Daily step counts from the hip-worn pedometer increased by 27% from the first week to the end of the intervention (4096±2080 to 6210±1909). Participants completed food records 5 out of 7 days per week (mean days: African American participants = 5.0±1.5; Caucasian participants = 5.1±0.9) and met their calorie goal 50% of the time.
Lower Extremity Tissue Compartments
Tissue changes in response to the intervention are listed in Table 2 and graphically illustrated as percent changes in Figures 1 and 2. Thigh and calf muscle volumes responded similarly between study groups (group by region interaction: p = .56) (Figure 1). Compared with control, muscle volumes pooled across regions demonstrated a slight but nonsignificant decrease with DR + E (group difference: -5.7±4.9cm3, p = .24, η2 = .03). Compared with control, DR + E reduced SAT in both regions by 41.5±11.7cm3 (p < .01, η2 = .34) in the thigh and 8.5±1.8cm3 (p < .01, η2 = .42) in the calf. Additionally, DR + E reduced IMAT by 4.4±1.5cm3 (p < .01, η2 = .25) in the thigh and 1.2±0.45cm3 (p = .01, η2 = .23) in the calf. DR + E produced greater reductions in SAT and IMAT of the thigh than of the calf region (group by region interaction: p < .01 [η2 = .18] for SAT and p = .04 [η2 = .12] for IMAT).
Table 2.
Effects of the Interventions
| DR + E (n = 14) | Education (n = 13) | Weighted Difference at 6 mo* | p Value | η2 | |||
|---|---|---|---|---|---|---|---|
| Baseline | 6 mo | Baseline | 6 mo | ||||
| Weight (kg) | 93.5±18.5 | 87.5±13.1 | 90.5±18.6 | 90.5±18.8 | -6.3 (1.4) | <.001 | .46 |
| Short physical performance battery | 9.23±0.83 | 11.0±1.5 | 9.3±1.0 | 10.2±1.7 | 0.79 (0.64) | .234 | .05 |
| 400-m walk speed (m/s) | 0.95±0.15 | 1.1±0.16 | 1.0±0.17 | 1.0±0.18 | 0.10 (0.05) | .090 | .09 |
| Knee extension strength (Nm) | 89.9±25.5 | 100.0±20.8 | 105.5±22.2 | 110±26.4 | -2.1 (8.6) | .801 | <.01 |
| Strength to body mass ratio (Nm/kg) | 0.95±0.25 | 1.14±0.19 | 1.18±0.23 | 1.24±0.32 | 0.014 (0.10) | .891 | <.01 |
| Muscle quality (Nm/cm3) | 0.37±0.12 | 0.43±0.11 | 0.46±0.12 | 0.50±0.17 | 0.040 (0.11) | .226 | .05 |
| Tissue compartments | |||||||
| Thigh muscle (cm3) | 244±49.3 | 235±34.5 | 236.4±49.3 | 232±54.4 | -5.6±4.9 | .269 | .05 |
| Thigh subcutaneous adipose (cm3) | 429±126 | 387±110 | 452.7±188 | 452±203 | -41.5±11.7 | .002 | .34 |
| Thigh intermuscular adipose (cm3) | 69.2±19.6 | 66.9±16.2 | 63.7±14.9 | 66.8±18.4 | -4.5±1.5 | .007 | .25 |
| Calf muscle (cm3) | 71.2±11.2 | 71.7±11.7 | 73.2±12.2 | 75.7±13.7 | -2.6±1.1 | .028 | .17 |
| Calf subcutaneous adipose (cm3) | 57.8±18.9 | 54.1±17.3 | 67.2±33.0 | 72.5±36.7 | -8.5±1.8 | <.001 | .42 |
| Calf intermuscular adipose (cm3) | 17.5±3.8 | 17.2±3.9 | 15.9±5.8 | 16.9±5.9 | -1.2±0.45 | .012 | .23 |
Notes: Values are mean ± SD unless noted otherwise. Values of η2 are calculated as effect sizes for the group main effect. The values are considered the percent of variance explained by the group effect. According to Cohen (19), η2 values are interpreted as follows: <.01 ~ small; .06 ~ medium; and >.14 ~ large.
*Mean difference between groups in the change from baseline using a multivariate linear regression analysis. The model was fitted for the change score from baseline (posttest minus pretest) with intervention group and baseline values also included. Values are weight means and standard errors from linear regression analyses.
Figure 1.
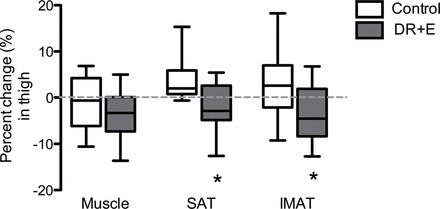
Percent changes in thigh tissue compartments in control and DR + E groups. The top and bottom lines and the line through the middle of the box represent the 75th percentile (top quartile), 25th percentile (bottom quartile), and 50th percentile (median), respectively. The whiskers on the bottom extend from the 10th percentile and top 90th percentile. SAT, subcutaneous adipose tissue; IMAT, intermuscular adipose tissue. *p value < .05.
Figure 2.
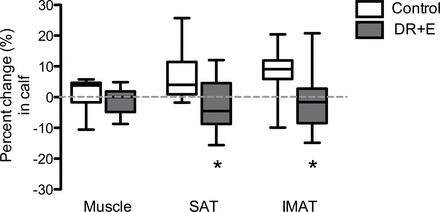
Percent changes in calf tissue compartments in the control and DR + E groups. The top and bottom lines and the line through the middle of the box represent the 75th percentile (top quartile), 25th percentile (bottom quartile), and 50th percentile (median), respectively. The whiskers on the bottom extend from the 10th percentile and top 90th percentile. SAT, subcutaneous adipose tissue; IMAT, intermuscular adipose tissue. *p value < .05.
Physical Function: Walking Speed, Knee Extension Strength, and Muscle Quality
The DR + E intervention increased walking speed by 0.10 m/second compared with the education control group—a value that others have considered clinically meaningful (20,21) However, this difference did not reach statistical significance (p = .09, η2 = .09; Table 2). Neither intervention increased knee extension muscle strength, muscle quality, or strength as a function of body weight. However, knee extension strength was maintained in the DR + E intervention despite decreases in body mass (Change in DR + E = 4.2±3.3 vs change in Control = 3.9±3.3 Nm, p = .901, η2 = .01). Similar results were found with change in muscle quality (change in DR + E = 0.024±0.01 vs change in Control = 0.021±0.01 Nm/cm3; group difference, p = .891, η2 = .05). Accordingly, relative knee extension strength significantly increased (change = 0.07±0.03 Nm/kg; p = .002) following the DR + E intervention, but this increase was not statistically different from that observed in the control group (group difference: p = .226, η2 < .01).
Exploratory Analyses on Walking Speed Change
Exploratory analyses were conducted to examine the association between changes in total body weight, tissue compartments, and walking speed (scatterplots are illustrated in Figure 3A, B, C, and D). Figure 3A shows that the correlation between total body weight change and gait speed change was not statistically significant (r = -.28, p = .33). However, an outlying participant who demonstrated a small reduction in body weight but large increase in gait speed severely influenced the association. When this participant was removed from the analysis, the association became significantly stronger (r = -.72, p = .005, η2 = .58). The association between change in walking speed and muscle change was nonsignificant in both the thigh and calf regions (Figure 3B; r = .15; p = .61, η2 = .02 and r = -.17; p = .57, η2 = .02, respectively). Changes in SAT of the thigh were not correlated with changes in walking speed (Figure 3C; thigh: SAT: r = .03; p = .89, η2 < .01), but reductions in SAT of the calf were strongly associated with faster walking speed (r = -.62; p = .01, η2 = .42). Changes in IMAT in the thigh were not associated with changes in walking speed (r = .11; p = .72, η2 = .01), but reductions in IMAT in the calf region were strongly associated with faster walking speed (r = -.62; p = .01, η2 = .38) (Figure 3D).
Figure 3.
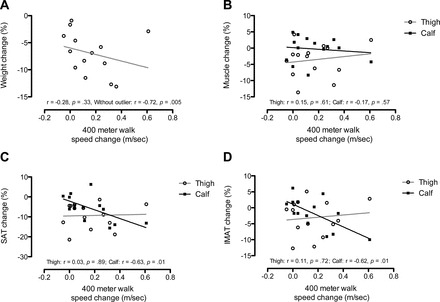
Scatterplots and lines of best fit for the association between walking speed percent change and (A) total body weight, (B) muscle, (C) subcutaneous adipose tissue (SAT), and (D) intermuscular adipose tissue (IMAT) for thigh and calf regions.
Discussion
This study is among the first to investigate the effects of a comprehensive DR + E program on lower extremity changes in muscle, SAT, and IMAT in moderate-functioning obese, older women. Our findings suggest that DR + E-induced weight loss has differential effects on the tissue composition within the thigh and calf regions. Specifically, although both the thigh and calf regions demonstrated reductions in SAT and IMAT, the effects were greater in the thigh region. However, reductions in SAT and IMAT in the calf, but not the thigh, were associated with positive adaptations in physical function measured by walking speed. These results are consistent with recent research that indicates specific body compartments have differential responses to diet-induced weight loss. For example, tissue loss in high metabolic rate organs, such as the heart, kidneys, and liver, exceed the loss in total fat-free mass (22), and intra-abdominal fat is lost to a greater degree during weight loss than fat in subcutaneous regions (23,24). These data extend potential differential responses of DR + E to the lower extremity tissue.
The degree of tissue composition change found in our study differed from other reports (25,26). For example, low-density tissue assessed with computed tomography demonstrated a ~16% reduction following a 6-month walking plus dietary restriction program in older women aged 50–70 years (27). Similarly, Avila and colleagues conducted a 10-week weight loss and resistance training study in older women who experienced an 18% and 7% reduction in IMAT and SAT, respectively (25). Most recently, Santanasto and coworkers reported a significant 2% reduction in thigh muscle mass with concomitant reductions in SAT and IMAT following a 6-month dietary weight loss and a primarily aerobic exercise program in obese, older women (3). Reductions in muscle mass seen in this previous report exceeded those found in our study, suggesting that the incorporation of a resistance exercise component might attenuate muscle loss as a result of weight loss due to dietary restriction. Overall, when compared with other studies, the data in the current study demonstrate a smaller reduction in IMAT but a similar reduction in SAT in the thigh (26,28–30). Older age in these previous studies may explain the difference in findings to the current study. Because IMAT increases with age (31), participants in previous reports were likely to have higher starting levels of IMAT, possibly providing a better opportunity to display significant reductions. A variety of other factors related to our participant sample and study design including functional status, degree of weight loss, the type of exercise performed, exercise intensity, and the volumetric analysis of tissue conducted in the current sample could also explain these discrepancies.
The design of this study provided an opportunity to explore whether changes in lower extremity compartments were associated with changes in physical performance resulting from DR + E. There is a limited understanding of the mechanisms that improve gait speed in obese, older persons, and this study provides some evidence that adaptations in adipose tissue composition in the calf are associated with improvements in walking speed due to DR + E. We found that despite greater reductions in both SAT and IMAT observed in the thigh, decreases in these adipose tissue depots in the calf were associated with increases in walking speed. In line with our findings, recent cross-sectional studies found that lower calf muscle area, lower calf muscle density, and higher calf percent fat were associated with walking ability (16,32). These findings are also consistent with the well-established finding that the calf muscles have a major role in producing forward propulsion during walking (33,34). As such, it is plausible that reduced adipose tissue in the calf might lead to improved contractile properties that contribute to heightened propulsion during walking. However, additional research is needed to confirm this finding and speculation.
There are a few notable limitations to this pilot study. First, we did not examine whole body composition changes, and thus, these results are limited to the lower extremity—although these compartments are considered the most important for preserving physical function in older adults. Additionally, six women did not have a follow-up MRI scan, and this might have biased the results. In an attempt to correct this bias, multiple imputations were performed on missing data, and we found similar results to those presented without multiple imputations. We chose an experimental design that examined the response of lower extremity tissue compartments to the recommended behavioral intervention for obese, older adults (35). Although this study design follows the guidelines for treating obesity among older adults, it cannot separate out the degree of exercise or dietary restriction responsible for tissue composition changes and their relationship with mobility function. Finally, this study, as well as most other lifestyle interventions, relied on participant’s self-reported caloric intake, and we acknowledge that there are errors in actual consumption (36). As noted by others in the field, such errors are likely to reduce the efficacy of the intervention (37,38).
In summary, the hypotheses of this study were supported. The recommended behavioral intervention for obese, older adults was effective at reducing body weight and intermuscular and subcutaneous adipose tissues while preserving muscle tissue in obese, older women with mild to moderate functional impairments. Additionally, while reduced body weight was associated with decreased lower extremity adipose tissue, the response was greater in the thigh than in the calf region. However, reduced SAT and IMAT in the calf was associated with improved physical function as measured by walking speed. Collectively, our findings indicate that DR + E is an effective treatment approach for producing significant regional lower extremity fat loss while preserving muscle size and quality in obese, older women. However, regional differences in adipose tissue loss could contribute to differential changes in physical function following dietary restriction and multicomponent exercise.
References
- 1. Iezzoni L. When Walking Fails: Mobility Problems of Adults With Chronic Conditions. Berkeley: University of California Press; 2003 [Google Scholar]
- 2. Alley DE, Chang VW. The changing relationship of obesity and disability, 1988-2004. JAMA. 2007;298:2020–2027 [DOI] [PubMed] [Google Scholar]
- 3. Santanasto AJ, Glynn NW, Newman MA, et al. Impact of weight loss on physical function with changes in strength, muscle mass, and muscle fat infiltration in overweight to moderately obese older adults: a randomized clinical trial. J Obes. 2011;2011:1–10 [DOI] [PMC free article] [PubMed] [Google Scholar]
- 4. Villareal DT, Banks M, Sinacore DR, Siener C, Klein S. Effect of weight loss and exercise on frailty in obese older adults. Arch Intern Med. 2006;166:860–866 [DOI] [PubMed] [Google Scholar]
- 5. Villareal DT, Chode S, Parimi N, et al. Weight loss, exercise, or both and physical function in obese older adults. N Engl J Med. 2011;364:1218–1229 [DOI] [PMC free article] [PubMed] [Google Scholar]
- 6. Anton SD, Manini TM, Milsom VA, et al. Effects of a weight loss plus exercise program on physical function in overweight, older women: a randomized controlled trial. Clin Interv Aging. 2011;6:141–149 [DOI] [PMC free article] [PubMed] [Google Scholar]
- 7. Guralnik JM, Ferrucci L, Pieper CF, et al. Lower extremity function and subsequent disability: consistency across studies, predictive models, and value of gait speed alone compared with the short physical performance battery. J Gerontol A Biol Sci Med Sci. 2000;55:M221–M231 [DOI] [PubMed] [Google Scholar]
- 8. Krauss RM, Eckel RH, Howard B, et al. AHA Dietary Guidelines: revision 2000: A statement for healthcare professionals from the Nutrition Committee of the American Heart Association. Circulation. 2000;102:2284–2299 [DOI] [PubMed] [Google Scholar]
- 9. U.S. Department of Health and Human Services (HHS). Physical Activity Guidelines for Americans. Washington, DC: U.S. Department of Health and Human Services; 2008 [Google Scholar]
- 10. Borg G. Perceived Exertion and Pain Scales. Champaign IL: Human Kinetics; 1988 [Google Scholar]
- 11. Bellg AJ, Borrelli B, Resnick B, et al. Enhancing treatment fidelity in health behavior change studies: best practices and recommendations from the NIH Behavior Change Consortium. Health Psychol. 2004;23:443–451 [DOI] [PubMed] [Google Scholar]
- 12. Klein S, Burke LE, Bray GA, et al. Clinical implications of obesity with specific focus on cardiovascular disease: a statement for professionals from the American Heart Association Council on Nutrition, Physical Activity, and Metabolism: endorsed by the American College of Cardiology Foundation. Circulation. 2004;110:2952–2967 [DOI] [PubMed] [Google Scholar]
- 13. NHLBI Obesity Education Initiative Expert Panel. Clinical guidelines on the identification, evaluation, and treatment of overweight and obesity in adults—The evidence report. Obes Res. 1998;6(Suppl 2):51S–209S [PubMed] [Google Scholar]
- 14. Franz MJ, VanWormer JJ, Crain AL, et al. Weight-loss outcomes: a systematic review and meta-analysis of weight-loss clinical trials with a minimum 1-year follow-up. J Am Diet Assoc. 2007;107:1755–1767 [DOI] [PubMed] [Google Scholar]
- 15. U.S. Department of Health and Human Services. Guidance for Industry. Developing Products for Weight Management. Rockville, MD: U.S. Department of Health and Human Services; 2007 [Google Scholar]
- 16. Buford TW, Lott DJ, Marzetti E, et al. Age-related differences in lower extremity tissue compartments and associations with physical function in older adults. Exp Gerontol. 2012;47:38–44 [DOI] [PMC free article] [PubMed] [Google Scholar]
- 17. Manini TM, Clark BC, Nalls MA, Goodpaster BH, Ploutz-Snyder LL, Harris TB. Reduced physical activity increases intermuscular adipose tissue in healthy young adults. Am J Clin Nutr. 2007;85:377–384 [DOI] [PubMed] [Google Scholar]
- 18. Manini TM, Visser M, Won-Park S, et al. Knee extension strength cutpoints for maintaining mobility. J Am Geriatr Soc. 2007;55:451–457 [DOI] [PubMed] [Google Scholar]
- 19. Cohen J. Statistical Power Analysis for the Behavioral Sciences. 2nd ed. Mahwah, NJ: Lawrence Erlbaum; 1988 [Google Scholar]
- 20. Kwon S, Perera S, Pahor M, et al. What is a meaningful change in physical performance? Findings from a clinical trial in older adults (the LIFE-P study). J Nutr Health Aging. 2009;13:538–544 [DOI] [PMC free article] [PubMed] [Google Scholar]
- 21. Perera S, Mody SH, Woodman RC, Studenski SA. Meaningful change and responsiveness in common physical performance measures in older adults. J Am Geriatr Soc. 2006;54:743–749 [DOI] [PubMed] [Google Scholar]
- 22. Bosy-Westphal A, Kossel E, Goele K, et al. Contribution of individual organ mass loss to weight loss-associated decline in resting energy expenditure. Am J Clin Nutr. 2009;90:993–1001 [DOI] [PubMed] [Google Scholar]
- 23. Viljanen AP, Lautamäki R, Järvisalo M, et al. Effects of weight loss on visceral and abdominal subcutaneous adipose tissue blood-flow and insulin-mediated glucose uptake in healthy obese subjects. Ann Med. 2009;41:152–160 [DOI] [PubMed] [Google Scholar]
- 24. Weinsier RL, Hunter GR, Gower BA, Schutz Y, Darnell BE, Zuckerman PA. Body fat distribution in white and black women: different patterns of intraabdominal and subcutaneous abdominal adipose tissue utilization with weight loss. Am J Clin Nutr. 2001;74:631–636 [DOI] [PubMed] [Google Scholar]
- 25. Avila JJ, Gutierres JA, Sheehy ME, Lofgren IE, Delmonico MJ. Effect of moderate intensity resistance training during weight loss on body composition and physical performance in overweight older adults. Eur J Appl Physiol. 2010;109:517–525 [DOI] [PubMed] [Google Scholar]
- 26. Chomentowski P, Dube JJ, Amati F, et al. Moderate exercise attenuates the loss of skeletal muscle mass that occurs with intentional caloric restriction-induced weight loss in older, overweight to obese adults. J Gerontol A Biol Sci Med Sci. 2009;64:575–580 [DOI] [PMC free article] [PubMed] [Google Scholar]
- 27. Ryan AS, Nicklas BJ, Berman DM, Dennis KE. Dietary restriction and walking reduce fat deposition in the midthigh in obese older women. Am J Clin Nutr. 2000;72:708–713 [DOI] [PubMed] [Google Scholar]
- 28. Frimel TN, Sinacore DR, Villareal DT. Exercise attenuates the weight-loss-induced reduction in muscle mass in frail obese older adults. Med Sci Sports Exerc. 2008;40:1213–1219 [DOI] [PMC free article] [PubMed] [Google Scholar]
- 29. Goodpaster BH, Kelley DE, Wing RR, Meier A, Thaete FL. Effects of weight loss on regional fat distribution and insulin sensitivity in obesity. Diabetes. 1999;48:839–847 [DOI] [PubMed] [Google Scholar]
- 30. Goodpaster BH, Theriault R, Watkins SC, Kelley DE. Intramuscular lipid content is increased in obesity and decreased by weight loss. Metabolism. 2000;49:467–472 [DOI] [PubMed] [Google Scholar]
- 31. Delmonico MJ, Harris TB, Visser M, et al. Longitudinal study of muscle strength, quality, and adipose tissue infiltration. Am J Clin Nutr. 2009;90:1579–1585 [DOI] [PMC free article] [PubMed] [Google Scholar]
- 32. Evans NS, Liu K, Criqui MH, et al. Associations of calf skeletal muscle characteristics and peripheral nerve function with self-perceived physical functioning and walking ability in persons with peripheral artery disease. Vasc Med. 2011;16:3–11 [DOI] [PMC free article] [PubMed] [Google Scholar]
- 33. Winter D. The Biomechanics and Motor Control of Human Gait. Waterloo, Ontario: University of Waterloo; 1987 [Google Scholar]
- 34. Winter D. The Biomechanics and Motor Control of Human Gait: Normal, Elderly and Pathological. Kitchener, Ontario, Canada: Waterloo Biomechanics; 1991 [Google Scholar]
- 35. Villareal DT, Apovian CM, Kushner RF, Klein S; American Society for Nutrition; NAASO, The Obesity Society. Obesity in older adults: technical review and position statement of the American Society for Nutrition and NAASO, The Obesity Society. Obes Res. 2005;13:1849–1863 [DOI] [PubMed] [Google Scholar]
- 36. Hebert JR, Clemow L, Pbert L, Ockene IS, Ockene JK. Social desirability bias in dietary self-report may compromise the validity of dietary intake measures. Int J Epidemiol. 1995;24:389–398 [DOI] [PubMed] [Google Scholar]
- 37. Kristal AR, Andrilla CH, Koepsell TD, Diehr PH, Cheadle A. Dietary assessment instruments are susceptible to intervention-associated response set bias. J Am Diet Assoc. 1998;98:40–43 [DOI] [PubMed] [Google Scholar]
- 38. Hebert JR, Ebbeling CB, Matthews CE, et al. Systematic errors in middle-aged women’s estimates of energy intake: comparing three self-report measures to total energy expenditure from doubly labeled water. Ann Epidemiol. 2002;12:577–586 [DOI] [PubMed] [Google Scholar]
- 39. Guralnik JM, Simonsick EM, Ferrucci L, et al. A short physical performance battery assessing lower extremity function: association with self-reported disability and prediction of mortality and nursing home admission. J Gerontol. 1994;49:M85–M94 [DOI] [PubMed] [Google Scholar]