

Abstract
Background
Hepatosteatosis is a common pathological feature of impaired hepatic metabolism following chronic alcohol consumption. Although often benign and reversible, it is widely believed that steatosis is a risk factor for development of advanced liver pathologies, including steatohepatitis and fibrosis. The hepatocyte alterations accompanying the initiation of steatosis are not yet clearly defined.
Methods
Induction of hepatosteatosis by chronic ethanol consumption was investigated using the Lieber-DeCarli (LD) high fat diet model. Effects were assessed by immunohistochemistry and blood and tissue enzymatic assays. Cell culture models were employed for mechanistic studies.
Results
Pair feeding mice ethanol (LD-Et) or isocaloric control (LD-Co) diets for 6 weeks progressively increased hepatocyte triglyceride accumulation in morphological, biochemical, and zonally distinct cytoplasmic lipid droplets (CLD). The LD-Et diet induced zone 2-specific triglyceride accumulation in large CLD coated with perilipin, adipophilin (ADPH), and TIP47. In LD-Co- fed mice, CLD were significantly smaller than those in LD-Et-fed mice and lacked perilipin. A direct role of perilipin in formation of large CLD was further suggested by cell culture studies showing that perilipin-coated CLD were significantly larger than those coated with ADPH or TIP47. LD-Co- and LD-Et-fed animals also differed in hepatic metabolic stress responses. In LD-Et but not LD-Co-fed mice, inductions were observed in the following: microsomal ethanol-oxidizing system [cytochrome P-4502E1 (CYP2E1)], hypoxia response pathway (hypoxia-inducible factor 1 alpha, HIF1α), endoplasmic reticulum stress pathway (calreticulin), and synthesis of lipid peroxidation products [4-hydroxynonenal (4-HNE)]. CYP2E1 and HIF1 α immunostaining localized to zone 3 and did not correlate with accumulation of large CLD. In contrast, calreticulin and 4-HNE immunostaining closely correlated with large CLD accumulation. Importantly, 4- HNE staining significantly colocalized with ADPH and perilipin on the CLD surface.
Conclusions
These data suggest that ethanol contributes to macrosteatosis by both altering CLD protein composition and inducing lipid peroxide adduction of CLD-associated proteins.
Keywords: Hepatosteatosis, Adipophilin, Perilipin, Ethanol, 4-Hydroxynonenal
STEATOSIS, OR FATTY liver, is a common pathological feature of impaired hepatic metabolism resulting from chronic alcohol consumption, diet, toxin exposure, or metabolic disorders such as obesity and diabetes. Although often benign and reversible, it is widely believed that steatosis contributes to more advanced liver pathologies, including steatohepatitis and fibrosis. However, the precise role of steatosis in development of these pathologies remains poorly understood (Rubin and Farber, 1999).
Histologically, steatosis is characterized by the accumulation of lipid droplets, composed chiefly of triacylglycerol (TAG), in the cytoplasm of hepatocytes (Cairns and Peters, 1983; Day and Yeaman, 1994). The size and lobular distribution of these cytoplasmic lipid droplets (CLD) are variable, reflecting the etiology, severity, and duration of steatosis. Large (macrovesicular) CLD are prominent in livers of individuals with chronic metabolic disorders or ethanol exposure, whereas numerous smaller (microvesicular) CLD have been associated with conditions of acute steatosis such as in Reye’s syndrome, in addition to being present in the early stages of some chronic disorders (Day and Yeaman, 1994). Although they have been hypothesized to reflect different stages of steatotic progression and represent different pathogenic risks (Day and Yeaman, 1994), it is unclear whether macrovesicular and microvesicular CLD are pathophysiologically distinct entities because information about their molecular compositions and biologic properties is limited, and the mechanisms regulating their formation and accumulation are incompletely understood.
Steatosis associated with alcoholic, and many forms of nonalcoholic liver disease, is described as initiating in centrilobular areas (zone 3), with advancement to intermediate (zone 2) and periportal (zone 1) areas occurring with disease progression (Brunt, 2007; Lefkowitch, 2005). However, in certain malnutrition disorders, infections, and toxic insults, steatosis is described as originating in zone 1 (James and Day, 1998). At present, details about mechanisms underlying zone-dependent initiation and progression of steatosis are limited (Stewart et al., 2001). Activation of cell stress pathways, which can include the microsomal ethanol-oxidizing system (Cyp2E1), hypoxia, endoplasmic reticulum stress, mitochondrial dysfunction, or lipid peroxidation, appears to be a common feature of steatosis in most disorders (French, 1989). However, the individual, or collective, contributions of these processes to zone-specific promotion and progression of steatosis have not been fully established, and detailed knowledge of their specific effects on the cellular processes controlling CLD accumulation is still incomplete.
Members of the perilipin (PAT) family of CLD-associated proteins, including perilipin, adipophilin (ADPH), TIP47, and S3–12, regulate TAG accumulation in eukaryotic cells, either through promotion of processes that enhance TAG synthesis and packaging in CLD (Gao and Serrero, 1999; Larigauderie et al., 2006; Robenek et al., 2006) or by controlling TAG lipolysis (Listenberger et al., 2007; Londos et al., 2005; Sztalryd et al., 2006; Wolins et al., 2006). Several lines of evidence suggest that perilipin family members may be important in the initiation and progression of steatosis. ADPH has been shown to be one of the major CLD-associated proteins in mouse livers (Wu et al., 2000), and its expression is required for induction of steatosis in mice fed high fat diets (Chang et al., 2006; Imai et al., 2007). ADPH immunofluorescence has also been shown to correlate with steatosis induced by alcohol consumption in rats (Mak et al., 2008), and ADPH, perilipin, and TIP47 have been detected on CLD in liver biopsies from patients with alcoholic and nonalcoholic liver disease by immunofluorescence (Straub et al., 2008). Evidence of functional linkage between hypoxia and ADPH transcript expression in HepG2 cells (Saarikoski et al., 2002) further suggest that genes of PAT family members may be direct targets of physiological mediators of steatosis.
The possibility that PAT proteins differentially affect steatotic progression, and CLD growth is suggested by observations that PAT protein family members appear to differentially coat distinct populations of CLD in human liver biopsies (Straub et al., 2008) and by evidence from differentiating 3T3-L1 adipocytes indicating that CLD become sequentially coated by TIP47, ADPH, and perilipin as they undergo enlargement (Wolins et al., 2006). Importantly, alterations in CLD protein composition (including PAT family members) in response to lipolytic stimulation demonstrate that CLD are dynamic structures responsive to physiological stimuli (Brasaemle, 2007; Clifford et al., 2000; Gross et al., 2006).
In this study, we used the well-established Lieber-DeCarli ethanol feeding model (Lieber and DeCarli, 1970) in mice to test the hypotheses that dietary ethanol induction of steatosis involves distinct alterations in CLD properties, including their protein composition, and is mediated by specific metabolic stress processes. We also investigated the relative abilities of perilipin, ADPH, and TIP47 to promote CLD accumulation in response to fat and ethanol in cell culture models in which these proteins were stably expressed. Our results demonstrate that feeding mice the Lieber-DeCarli ethanol diet (LD-Et) only modestly increased hepatic triglycerides over that of calorically matched Lieber-DeCarli control (LD-Co) diet-fed animals after 6 weeks. However, CLD in livers of LD-Et-fed mice differed markedly from those in LD-Co-fed mice in their larger size, their predominant zone 2 distribution, the presence of perilipin on their surface, and their association with ER stress and lipid peroxide adduction in hepatocytes. Our cell culture studies provide evidence that the presence of perilipin on CLD is sufficient to induce formation of large CLD. Together our data indicate that ethanol ingestion induces specific alterations in CLD protein properties that contribute to large CLD formation during hepatosteatosis.
MATERIALS AND METHODS
Materials
Chemicals used were purchased from Sigma Chemical Company (St. Louis, MO). Guinea pig antibodies to ADPH and perilipin (Fitzgerald Inc, Concord, MA), chicken anti-calreticulin (Affinity Bio- Reagents, Golden, CO), rabbit anti-HIF1alpha (Novus Biologicals, Littleton, CO), rabbit anti-CYP3A (Santa Cruz Biotechnology, Santa Cruz, CA), and rabbit anti-CYP2E1 (Chemicon / Millipore, Billerica, MA) were obtained commercially. Rabbit antibodies to ADPH, TIP47, and 4-hydroxynonenal (4-HNE) were generated as previously described (Roede et al., 2008; Russell et al., 2007). Mice were purchased from Charles River Laboratories (Wilmington, MA).
Animals and Diets
All procedures involving animals were approved by the Institutional Animal Care and Use Committee of the University of Colorado and were performed in accordance with published National Institutes of Health Guidelines. Beginning at 8 weeks of age, male C57BL/6 mice (8 per group) were fed a Lieber-DeCarli diet (Bio- Serv, Frenchtown, NJ) for 6 weeks. The diet consisted of 45% fat-derived calories and 16% protein-derived calories. The balance consisted of varying concentrations of carbohydrate-derived and ethanol-derived calories (Lieber-DeCarli ethanol diet—LD-Et). LD-Et animals began the study on a diet containing 2% ethanol (v/v). The amount of ethanol was increased each week by 1% until it reached 5% ethanol (v/v). The animals were maintained on the 5% (v/v) ethanol-containing diet for the remainder of the study (Roede et al., 2009). Based on food consumption rates of mice during the last week of the study, the average amount of ethanol consumed was 23.4 ± 0.96 gm/Kg/d (mean ± SEM, 6 mice). Previous studies have shown that mice consuming similar amounts of ethanol have blood alcohol concentrations between 80 and 125 mM (Perides et al., 2005). Each LD-Et-fed animal was pair-fed with an animal that received an isocaloric diet containing similar amounts of fat-derived (45%) and protein-derived (16%) calories as the LD-Et diet, but in which ethanol-derived calories were replaced by carbohydrate-derived calories (Lieber-DeCarli control diet; LD-Co) (Roede et al., 2009). Food consumption was measured and recorded daily, and body weights were measured at weekly cage changes. Upon completion of the feeding regimen, the animals were anesthetized by an intraperitoneal injection of sodium pentobarbital and euthanized by exsanguination. Blood samples were collected from the inferior vena cava for determination of plasma alanine amino-transferase activity (ALT) using an assay kit from Diagnostic Chemicals Limited (Oxford, CT). Livers were removed and weighed; a portion of each was homogenized, and subcellular fractions were prepared as described elsewhere (Carbone et al., 2004). The remaining portion of liver was immediately fixed in 10% neutral buffered formalin and processed into paraffin blocks for histological analysis.
Biochemical Analysis
Liver triglycerides were measured from 2:1 chloroform:methanol extracts of liver homogenates using a kit from Diagnostic Chemicals Limited. Cytochrome P4502E1 (CYP2E1) activity was assessed by measuring the rate of oxidation of p-nitrophenol to p-nitrocatechol as previously described (Bai and Cederbaum, 2006). Protein concentrations were measured using either a BCA Protein Assay from Pierce (Rockford, IL) or a Bio-Rad Protein Assay (Hercules, CA).
Histology and Immunohistochemistry
After the livers were excised from the study animals, a portion was fixed in 10% neutral buffered formalin, processed, paraffin imbedded, and sections were cut and mounted on slides by Colorado Histoprep (Ft. Collins, CO) or IHCtech (Aurora, CO). One set of slides was stained with hematoxylin and eosin (H&E) for histological examination of pathology, and the remainder of the slides were deparaffinized and processed for immunohistochemical analysis. The sections were immunostained with the specific primary antibodies described in the text, followed by the appropriate secondary antibody labeled with either Alexa 488 or Alexa 594 (Molecular Probes, Eugene, OR), and nuclei were stained with DAPI (Sigma Chemical Company) as previously described (Russell et al., 2007).
Cell Culture
Construction and culturing of HEK293 cells stably transfected with either ADPH/vsv, Perilipin, or TIP47/vsv, or doubly transfected with ADPH/vsv and Perilipin have been described (Orlicky et al., 2008). Clones from these cell lines were cultured in DMEM medium supplemented with 6% fetal calf serum (control media) or control media supplemented with 100 μM oleic acid bound to bovine serum albumin (FA media), 87 mM ethanol (EtOH media), or 100 μM oleic acid plus 87 mMethanol (FA + EtOH media) for 3 days, with media being exchanged for fresh media after 2 days. Penicillin and streptomycin were not added to the culture medium. Although stably transfected cell lines were isolated in the presence of the plasmid selection antibiotic Geneticin (G418; GIBCO, Invitrogen Corporation, Grand Island, NY), all experiments were conducted in culture media without it. Only data from twice cloned cell lines are presented. Cultured cells were grown on glass coverslips in culture dishes for at least 2 days in control media prior to incubation in test media. Following treatment, media was removed, and the cells were fixed, permeabilized, washed, and immunohistochemically stained as previously described (Orlicky et al., 2008).
Image Analysis and CLD Quantitation
Images of H&E-stained liver sections were captured on an Olympus BX51 microscope equipped with a 4 megapixel Macrofire© digital camera (Optronics, Goleta, CA) using the PictureFrame© Application 2.3 (Optronics). Immunofluorescent images were captured at room temperature on a Nikon Diaphot fluorescence microscope equipped with a Cooke SensiCam CCD camera (Tonawand, NY) using Slidebook software (Intelligent Imaging Innovations Inc., Denver, CO) as previously described (Russell et al., 2007). Fluorescence images were digitally deconvolved using the No Neighbors algorithm (Slidebook) and converted to TIFF files. All images were processed by Photoshop (Adobe Systems Inc., Mountain View, CA).
Data Analysis
CLD size distribution was determined using the histogram function of Microsoft Excel. Statistical differences were determined using a paired T-test assuming unequal variances.
RESULTS
Effects of LD-Et and LD-Co Diets on Body Weight and Hepatic Properties
Two groups of male C57BL/6 mice were pair-fed nutritionally balanced isocaloric liquid diets, in which 45% of the calories were derived from fat and 16% were derived from protein, for 6 weeks. In the LD-Co group, carbohydrates supplied the remainder of the calories (39%). In the LD-Et group, carbohydrate-derived calories were progressively replaced with ethanol-derived calories as described in Materials and Methods. Calorie consumption of the LD-Et and LD-Co groups during the last week of the study, 38.6 ± 0.50 Kcal/wk and 37.8 ± 0.52 Kcal/wk, respectively, were not significantly different. There was 100% survival of mice on either diet, and all animals were active and appeared to be healthy. The body weights of animals on the LD-Co diet increased approximately 20% between weeks 3 and 6 (Fig. 1A). Consistent with the notion that chronic ethanol consumption promotes energy wastage (Pirola and Lieber, 1976), we found that body weights of animals on the isocaloric LD-Et diet did not change significantly over the course of the study. Furthermore, the liver to body weight ratio was the same for the LD-Co and LD-Et groups and did not vary over the course of the study (data not shown), suggesting that the failure of mice on the LD-Et diet to grow was not related to impaired hepatic function in the LD-Et group. To further assess hepatic function, we quantified serum ALT levels in each group. Figure 1B shows serum ALT levels did not change significantly between during the first 3 weeks of diet exposure in either group. At week 6, there was a modest (58%) increase in serum ALT levels in the LD-Et group that was not detected in the LD-Co group (Fig. 1B). However, the relatively small magnitude of this increase suggests that ethanol exposure was not greatly affecting liver function at this time. Both diets significantly increased hepatic triglycerides over the 6-week feeding period, but at week 6 hepatic triglycerides in the LD-Et group were only modestly (30%) elevated over those in the LD-Co group (Fig. 1C). Thus, over the short-term, exposure to a high fat diet containing ethanol did not appear to markedly affect the rate of hepatic TAG accumulation relative to that of the high fat diet alone and had only a small affect on total TAG accumulation at week 6. To verify that dietary ethanol levels affected hepatic properties, we quantified tissue levels of CYP2E1, which is induced in response to ethanol metabolism (Lieber, 1999). Figure 1D shows that the average hepatic CYP2E1 activity in LD-Et group was more than twice that of LD-Co group at 6 weeks. We did not detect differences in hepatic CYP2E1 activity between the LD-Et or LD-Co groups at 1 or 3 weeks, suggesting that between 3 and 6 weeks of dietary ethanol exposure are required to increase hepatic CYP2E1 activity in this model. Because TAG accumulation can vary significantly among hepatic zones (Brunt, 2007; Lefkowitch, 2005), we evaluated livers from each group histologically to determine whether the LD-Et and LD-Co diets produced differences in the zonal distribution of TAG.
Fig. 1.

Characteristics of animals fed LD-Co or LD-Et diets for 6 weeks. Male C57/Bl6 mice were pair-fed nutritionally balanced isocaloric control (LD-Co) or ethanol supplemented (LD-Et) diets for 1 to 6 weeks (Materials and Methods). Groups of animals were harvested at weeks 1, 3, and 6. Body weights (A); serum alanine amino-transferase activity (B); triglyceride levels (C); and cytochrome P-4502E1 activity (D) were determined at the indicated times. The results are mean ± SEM, n = 8 for each point. Statistical significance (p < 0.05) is indicated by ‡.
The LD-Et Diet Induces Formation of Large CLD
Surprisingly, overt steatosis, as visualized by the presence of CLD equal to or larger than the hepatocyte nucleus (approximately 10 to 14 microns) in H&E-stained liver sections, was consistently observed only in livers of the LD-Et diet at the 6-week time point (Fig. 2 and Supplemental Fig. S1). In these mice, CLD were detected primarily in zone 2, although a few CLD were sporadically observed in some sections in zones 1 and 3. A few large CLD were observed sporadically in liver sections from mice on the LD-Et diet for 3 weeks (Fig. 2) but not prior to this time.
Fig. 2.

Hematoxylin and eosin staining shows large cytoplasmic lipid droplets (CLD) in LD-Et livers. Representative images from H&E-stained liver sections of LD-Co and LD-Et mice at the indicated times are shown. Large CLD are detected only in zone 2 of the LD-Et group at 6 weeks (arrows). The asterisk (*) marks the portal triad, and the X marks the central vein in each image. The color image of this figure was made into a grayscale image in Adobe Photoshop; the original color version of this figure is presented as supplemental Fig. S1. The scale bar in the lower left hand corner is 50 μm.
Using the Brunt system for classification of hepatosteatotic pathology (Kleiner et al., 2005), we gauged the degree of steatosis and liver injury in the LD-Co and LD-Et groups. We did not detect signs of fibrosis, inflammation (including lobular inflammation, microgranulomas, large lipogranulomas, and portal inflammation), liver cell injury (including ballooning, acidophil bodies, pigmented macrophages, and megamitochondria), or any other findings such as Mallory’s hyaline or glycogenated nuclei in hepatocytes of mice on either diet at any time point. By H&E staining, fewer than 5% of hepatocytes from LD-Co livers exhibited evidence of steatosis at any time during the study. In the LD-Et group, the degree of steatosis progressively increased from <5% of hepatocytes at week 1 to 10 to 20% by week 3 and was >50% by week 6. At each stage of this progression, steatotic responses occurred primarily in zone-2 hepatocytes. Accordingly from the histological standpoint, the degree of steatosis in mice on the LD-Co diet appeared to be minimal over the entire study period, whereas steatosis in mice on LD-Et diet progressed from mild to moderate over the 6-week period of study. Because livers of mice on the LD-Co or the LD-Et diets both exhibited comparably elevated TAG levels by week 6, we next investigated whether differences in CLD properties potentially accounted for differences in the degree of histologically detectable hepatosteatosis.
Adipophilin Immunofluorescence Reveals Distinct Patterns of Steatosis in Mice Fed LD-Co and LD-Et Diets
Rodent hepatic CLD are normally coated with the perilipin family member ADPH (Chang et al., 2006; Mak et al., 2008). Following immunostaining with antibodies to ADPH and visualization by confocal immunofluorescence microscopy, we detected significant numbers of CLD in livers of LD-Co- and LD-Et-fed mice. At lower magnification (200×; Fig. 3), numerous ADPH-positive CLD were detected in liver sections of both LD-Co- and LD-Et-fed mice as early as 1 week after starting them on these diets. ADPH-positive CLD were enriched in zone 3 at 1 week and became more prominent in zone 2 by week 3 in both groups. The zonal distribution of ADPH-positive CLD did not change significantly between weeks 3 and 6 in livers of mice on the LD-Co diet, whereas in agreement with H&E staining results (Fig. 2), there was enrichment of larger ADPH-positive CLD in zone 2 after 6 weeks on the LD-Et diet. ADPH immunostaining appeared weaker and more variable in zones 1 and 3 in LD-Et mice after 6 weeks suggesting that ethanol exposure may induce temporally dependent zonal redistribution of TAG accumulation. At 600× magnification, ADPH-positive CLD were predominantly detected in hepatocytes and stellate cells in both groups of animals (Supplemental Fig. S2), but they were not present in Kupffer or endothelial cells. Stellate cells containing ADPH-positive CLD did not immunostain with antibodies to smooth muscle actin (Supplemental Fig. S3), suggesting that they were not activated (Friedman, 1993).
Fig. 3.

Adipophilin (ADPH) immunohistochemistry detects cytoplasmic lipid droplets in livers of mice fed LD-Co and LD-Et diets. Representative 200× magnification images of ADPH-immunostained (red) liver sections of LD-Co or LD-Et mice at the indicated times are shown. The asterisk (*) marks the portal triad, and the X marks the central vein. Sections were costained with Alexa 488-conjugated wheat germ agglutinin to identify sinusoids (green) and with DAPI to identify nuclei (blue). The scale bar is 50 μm.
The number of ADPH-positive CLD increased in hepatocytes of LD-Co mice over the 6-week course of study but we did not detect a significant change in their size (Supplemental Fig. S2). Quantitation of CLD size in livers of these mice at week 6 (Black Bars, Fig. 4A) revealed a unimodal distribution, with an average diameter of 1.86 ± 0.9 μm (3 sections per mouse; 100 to 200 CLD per section; n = 3 mice). In contrast, in addition to increased numbers of CLD, we found significant time- and zone-dependent increases in the size of ADPH-positive CLD in hepatocytes of mice on the LD-Et diet (Fig. 3 and Supplemental Fig. S2). After 1 week on this diet, CLD size and number did not differ from those of mice fed the LD-Co diet for 1 week. After 3 weeks on this diet, the number of larger diameter ADPH-positive CLD in zone 2 increased resulting in an overall increase in the average CLD diameter to 3.0 ± 1.5 μm (n = 3 mice), which was significantly (p < 0.0001) larger than that of CLD in LD-Co-fed mice. As shown in Fig. 4B, the size distribution of CLD at this time point was still unimodal. After 6 weeks on the LD-Et diet, numerous large ADPH-positive CLD, some with diameters as large as 15 μm, were visible in most zone 2 hepatocytes (Supplemental Fig. S2). Size quantitation shows that CLD in these hepatocytes had a bimodal size distribution with peaks around 2 and 4 μm. The average CLD diameter in zone 2 of LD-Et-fed animals at 6 weeks, 4.1 ± 2.2 μm (3 sections per mouse; 100 to 200 CLD per section; n = 3 mice), was significantly (p < 0.001) larger than that determined for CLD in animals on the LD-Co diet for 6 weeks or for that found in mice on the LD-Et diet for 3 weeks.
Fig. 4.

Size distribution of cytoplasmic lipid droplets in hepatocytes of mice fed LD-Co or LD-Et diets. (A) cytoplasmic lipid droplets (CLD) size distributions in hepatocytes of mice fed LD-Co (Black bars) or LD-Et (white bars) diets for 6 weeks. (B) CLD size distributions in mice fed the LD-Et diet for 3 (black bars) or 6 (white bars) weeks. The results are shown as the percentage of CLD with the indicated diameters (μm) in 20 to 30 hepatocytes from randomly chosen fields from 3 to 4 mice. The average CLD size in hepatocytes of mice on the LD-Et diet for 6 weeks was significantly larger than that of CLD in hepatocytes on the LD-Et diet for 3 weeks or the LD-Co diet for 6 weeks (p < 0.001).
Perilipin-Coated CLD Are Selectively Induced by the LD-Et Diet
A recent survey of human liver biopsy samples identified perilipin on CLD in patients with various liver disorders, including alcoholic steatosis (Straub et al., 2008). To determine whether differences in CLD PAT protein composition contributed to the different patterns of steatosis found in LD-Et and LD-Co mice, we immunostained sections of their livers with antibodies to perilipin and/or ADPH and TIP47. Perilipin-positive CLD were detected in liver sections from mice on the LD-Et diet predominately at 6 weeks (Fig. 5). The zonal distribution pattern of these CLD was similar to that of ADPH-positive CLD, suggesting that formation of perilipin-coated CLD is directly related to the affects of the LD-Et diet on CLD morphology. Perilipin-positive CLD were also detected in some hepatocytes of LD-Et-fed animals at earlier time points; however, perilipin immunostaining intensity was significantly less than that found at week 6 (Supplemental Fig. S5).
Fig. 5.
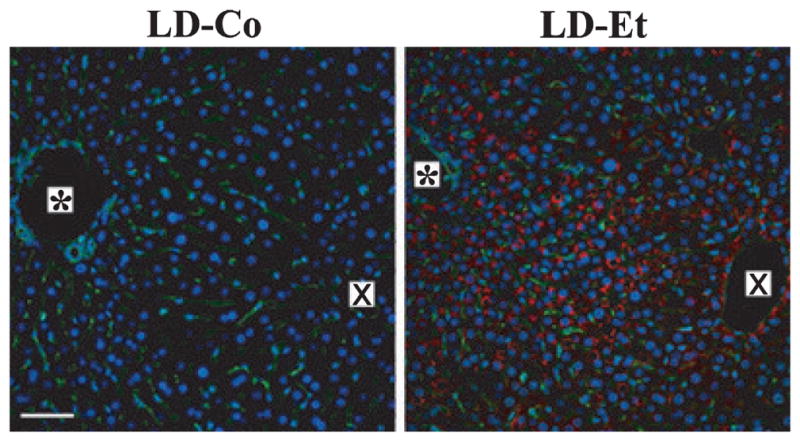
Perilipin-positive cytoplasmic lipid droplets (CLD) are induced in hepatocytes of mice fed the LD-Et diet. Representative 200× magnification images of perilipin-immunostained (red) liver sections from LD-Co or LD-Et mice at 6 weeks are shown. The asterisk (*) indicates the portal triad, and the X indicates the central vein. Sections were costained with Alexa 488- conjugated wheat germ agglutinin to identify sinusoids (green) and with DAPI to identify nuclei (blue). Perilipin-positive CLD were detected only in livers of mice fed the LD-Et diet. The scale bar is 50 μm.
To determine whether perilipin-coated CLD correspond to a distinct population of steatotic vesicles in LD-Et hepatocytes, as previously suggested by Straub et al. (2008), we costained liver sections from mice on the LD-Et diet for 6 weeks with antibodies to ADPH and perilipin. Figure 6 (top) shows that the majority of CLD, regardless of size, express both ADPH and perilipin on their surface. Moreover, significant overlap existed in perilipin and ADPH immunostaining, suggesting that perilipin and ADPH are closely associated on the CLD surface.
Fig. 6.

Adipophilin (ADPH), Perilipin, and TIP47 localize to similar populations of cytoplasmic lipid droplets (CLD) in hepatocytes of mice fed the LD-Et diet for 6 weeks. Representative 600× magnification images of zone 2 regions of livers from LD-Et mice at 6 weeks immunostained for ADPH (green) and perilipin (red) (upper panels), or ADPH (red) and TIP47 (green) (lower panels), are shown. The individual immunostaining patterns of ADPH and perilipin or ADPH and TIP47 are shown in monochromatic images. The merged images show significant overlap in the ADPH and perilipin immunofluorescence and in the ADPH and TIP47 immunofluorescence on the CLD surface, as indicated by the yellow regions in the merged images. Insets in the upper panels show higher magnifications of selected CLD stained with ADPH and perilipin to allow appreciation for the close proximity and overlap of staining. The scale bar is 25 μm.
TIP47 was also detected on CLD in hepatocytes and stellate cells of mice fed either the LD-Co or the LD-Et diet (Fig. 6, bottom). The relative numbers of TIP47-positive CLD in these animals, and their zonal distributions, were comparable to those found for ADPH-positive CLD at the 1-, 3-, or 6-week intervals (Supplemental Data, Fig. S4). The majority of large and small CLD in livers from mice on the LD-Co and LD-Et diets are coated by both ADPH and TIP47. Again, areas of apparent colocalization were visible on many of these CLD; however, there were also areas where ADPH and TIP47 appear to localize to distinct regions on the CLD surface.
ADPH, Perilipin, and TIP47 Differentially Affect CLD Accumulation and Morphology
The observations that the presence of perilipin on CLD correlated with the appearance of large CLD in LD-Et hepatocytes suggested that perilipin may have contributed to their formation. To directly test this possibility, we generated stable isogenic cell lines either that independently express ADPH (ADPH-cells), perilipin (Peri-cells), TIP47 (TIP-cells) or that coexpressed ADPH and perilipin (ADPH/Peri-cells). To reduce potential complicating effects of endogenously expressed PAT proteins on CLD properties, we chose HEK293 (293) cells as the parental cell line for these experiments. HEK293 cells express TIP47 endogenously but lack both ADPH and perilipin (Orlicky et al., 2008). Cultures of each of the 4 cell lines were incubated for 3 days in control media or in control media supplemented with either 100 μM oleic acid (FA media), 87 mM ethanol (EtOH media), or 100 μM oleic acid plus 87 mM ethanol (FA + EtOH media) to simulate LD-Co and LD-Et diets. For ease of detection, ADPH and TIP47 were engineered to contain a C-terminal VSV epitope tag, which we previously demonstrated does not affect their functions (Orlicky et al., 2008). A concentration of 87 mM ethanol (0.5% v/v) was chosen because previous studies by others have shown a maximal effect of ethanol at 100–200 mM (Reddy and Shukla, 1996). CLD in cell lines expressing an individual PAT protein were identified by costaining with anti-VSV or anti-perilipin antibodies, and Nile Red to verify the presence of a neutral lipid core in the stained structures. In cells expressing both ADPH and perilipin, CLD were coimmunostained for VSV and perilipin antibodies. Figure 7A shows black and white images of VSV and/or perilipin staining. The corresponding color images are shown in Supplemental Fig. S6.
Fig. 7.


Adipophilin (ADPH), perilipin, and TIP47 produce distinct effects on cytoplasmic lipid droplets (CLD) accumulation and size in cultured cells exposed to oleic acid, ethanol, or oleic acid plus ethanol. (A) CLD in 293 cells stably expressing ADPH-vsv (ADPH); perilipin (Peri); TIP47-vsv (TIP47); or ADPH-vsv plus perilipin (ADPH + Peri) following incubation in control media without supplementation (control) or with supplementation with 100 μM oleic acid (FA), 87 mM ethanol (EtOH), or 100 μM oleic acid plus 87 mM ethanol (FA + EtOH) for 3 s. CLD were visualized in ADPH, Peri, and TIP47 cells by staining with Nile Red (red) and antibodies to VSV (green) or perilipin (green). A grayscale image is shown here, the Nile Red is not shown, and the green plus blue image was made into a grayscale image in Adobe Photoshop. The full color version of this image is presented as Supplemental Fig. S6. CLD in ADPH + Peri-cells were visualized by immunostaining with antibodies to VSV (green) and perilipin (red). Nuclei were stained with DAPI (blue). The scale bar is 25 μm. (B) CLD size distribution in cells expressing ADPH-vsv (white bars) or TIP47 (black bars) grown in FA-containing medium. (C) CLD size distribution in cells expressing perilipin (white bars) or ADPH-vsv plus perilipin (black bars) grown in FA-containing medium. The results in B and C (next page) show the percentage of CLD with the indicated diameters (μm) in cultures of 30 to 50 cells from randomly chosen fields. CLD coated with perilipin were significantly (P < 0.001) larger than those coated with ADPH or TIP47. The size of CLD coated with APDH was not statistically different from that of CLD coated with TIP47 (p = 0.8).
Cell lines expressing ADPH, perilipin, or TIP47 differed in their ability to promote CLD accumulation; CLD coated by these proteins differed in their morphologies and localization. Numerous distinct CLD, distributed around the nuclear periphery, were detected in ADPH-cells following incubation in FA- or FA + EtOH media. Significant numbers of small perinuclear CLD were also detected in ADPH-cells incubated in EtOH media (Fig. 7A, row 1); however, we did not detect CLD in ADPH-cells incubated in control media.
In contrast to ADPH-cells, CLD were detected in Peri-cells incubated in control media as well as in those incubated in FA-, EtOH-, or FA + EtOH media (Fig. 7A, row 2), suggesting that perilipin more effectively promotes CLD accumulation than ADPH. CLD in Peri-cells also differed from those in ADPH-cells in their cellular localization pattern, forming single clusters that localized to one pole of the nucleus rather than distinct entities distributed around the nucleus. The size and number of perilipin-coated CLD were not affected by the presence of FA and/or ethanol in the culture media (data not shown). However, CLD in Peri-cells appeared to be larger than those found in cell lines expressing either ADPH or TIP47 incubated in FA media.
CLD were detected in TIP-cells incubated in FA- or FA + EtOH media, forming multiple clusters of distinct droplets (Fig. 7A, row 3) that appeared to be similar in size to those found in ADPH-cells. TIP47-coated droplets were frequently observed near the cell periphery and appeared to be more widely distributed than CLD coated by ADPH or perilipin. Interestingly, we did not detect CLD in TIP-cells incubated in control- or EtOH media (Fig. 7A, row 3), suggesting that TIP47 is less efficient in promoting CLD accumulation than either ADPH or perilipin.
In ADPH/Peri-cells, similar numbers of CLD were detected following incubation in control-, FA-, EtOH-, or FA + EtOH media (Fig. 7A, row 4). Like CLD in Peri-cells, CLD in ADPH/Peri-cells tended to form as single clusters located at one pole of the nucleus. In general, CLD size in ADPH/Peri-cells appeared to be comparable to that of CLD in Peri-cells under all culture conditions and markedly larger than CLD in ADPH- or TIP-cells.
To define the specific effects of individual PAT proteins on CLD size, we compared the average CLD diameters in ADPH-, Peri-, TIP-, and ADPH/Peri-cells incubated in FA media (Fig. 7B,C). The average diameter of CLD in Peri-cells (3.9 μm) was significantly (p < 0.001) larger than that of CLD in ADPH- (0.51 μm) or TIP-cells (0.59 μm). Interestingly, we found that CLD in ADPH/Peri-cells (average diameter = 2.9 μm) were smaller than those found in Peri-cells incubated in this media, suggesting that the presence of ADPH along with perilipin on CLD may act to restrict their ultimate size. CLD diameters in Peri- or ADPH/Peri-cells incubated in FA + EtOH media were not significantly different from those found when these cells were incubated in FA media (data not shown). Collectively, these results demonstrate that the PAT protein composition of CLD can influence their size and that perilipin is capable of promoting formation of larger CLD than either ADPH or TIP47 independent of the presence of ethanol.
Large CLD Spatially Correlate With Markers of ER Stress and Lipid Peroxidation
Metabolic stressors such as hypoxia, lipid peroxidation, and induction of cytochrome P450 activities have been implicated in the steatotic effects of alcoholic and nonalcoholic fatty liver disease (Browning and Horton, 2004; Das and Vasudevan, 2007; Lieber, 2004). To determine whether any of these processes potentially contributed to zonal and morphological differences in steatotic progression observed in mice on LD-Et or LD-Co diets, we stained sections of their livers obtained at 1, 3, or 6 weeks for: HIF1α, a marker of hypoxia (Li et al., 2006); calreticulin, a marker of endoplasmic reticulum stress (Heal and McGivan, 1998; Kim et al., 2005; Song et al., 2009); CYP2E1, a measure of microsomal ethanol-oxidizing system activity (Lieber and DeCarli, 1970); and 4-HNE, a marker of lipid peroxide adduction (Esterbauer and Cheeseman, 1990; Lieber, 2004). In agreement with the known effects of ethanol metabolism on metabolic stress pathways, significant immunostaining for each of these markers was detected only in livers of LD-Et-fed mice (Fig. 8). Moreover, we found that for each marker, the number of positive cells and the staining intensity within each cell increased with the length of exposure to the LD-Et diet (Supplemental Figs. S7–S10). The staining patterns of HIF1α and CYP2E1 at 6 weeks differed from those of calreticulin and 4- HNE. HIF1α and CYP2E1 immunostaining predominately localized to cells in zone 3 (Fig. 8). CYP2E1 immunostaining was also detected in some zone 2 hepatocytes but it did not strictly correlate with the presence of large CLD.
Fig. 8.

Localizations of hypoxia (HIF1α) and endoplasmic reticulum stress (calreticulin) responses and of cytochrome P-4502E1 (CYP2E1) and 4-hydroxynonenal (4-HNE) in liver sections of mice fed the LD-Co and LD-Et diet for 6 weeks. Representative 200× magnification monochromatic images of liver sections from LD-Co or LD-Et mice at 6 weeks that were immunostained for HIF1α, calreticulin, CYP2E1, or 4-HNEare shown. HIF1α is found only in livers of mice fed the LD-Et diet and primarily localizes to zone 3. Calreticulin is detected in livers of all animals and is upregulated in all zones by the LD-Et diet. CYP2E1 and 4-HNE immunostaining is detected only in livers of mice fed the LD-Et diet. The asterisk (*) marks the portal triad, and the X marks the central vein. The scale bar is 50 μm.
Significant calreticulin and 4-HNE immunostaining was detected in hepatocytes from all zones (Fig. 9). Calreticulin immunostaining was detected in regions surrounding ADPH-CLD, but it did not appear to be directly associated with their surfaces. Similar results were obtained when tissue was immunostained for Grp78, another marker of ER stress (data not shown). In contrast, 4-HNE immunostaining appeared to localize to the surfaces of both large and small CLD (Fig. 9). Using masking functions (Slidebook® software, Methods) to define the extent of this overlap, we found that 95 ± 2% of the 4-HNE immunostaining overlapped with that of ADPH. Similar degrees of staining overlap were observed between 4- HNE and perilipin (90 ± 5%), suggesting that either the PAT proteins or a closely associated molecule found on the surface of the CLD may be targets of ethanol-induced lipid peroxide adduction.
Fig. 9.

Spatial relationships between large adipophilin (ADPH)-coated cytoplasmic lipid droplets (CLD) and calreticulin, cytochrome P-4502E1 (CYP2E1), or 4-hydroxynonenal (4-HNE) immunostaining. The images show the cellular distributions of ADPH-coated CLD in relationship to calreticulin (upper panels), CYP2E1 (middle panels), and 4-HNE (lower panels) staining in the zone 2–3 region of a liver section from an animal fed the LD-Et diet for 6 weeks. Monochromatic images in the upper panels show that both ADPH-coated CLD and calreticulin are extensively distributed in hepatic tissue. The merged image in the upper panel shows that calreticulin (green) and ADPH-coated CLD (red) are found in the same cells but calreticulin does not localize to CLD. Monochromatic images in the middle panels show distinct cellular patterns of ADPH-coated CLD and CYP2E1 staining and that some cells containing large CLD (white arrows) fail to stain for CYP2E1. The merged image demonstrates the absence of CYP2E1 (red) in some cells that contain large ADPH-coated CLD (green). Note that in cells containing both CYP2E1 and ADPH-coated CLD that CYP2E1 does not localize to CLD. Monochromatic images in the lower panel show that 4-HNE immunostaining appears to localize to ADPH-coated CLD. This is further demonstrated in the merged image, which shows overlapping (yellow) staining of ADPH (green) and 4-HNE (red) on individual CLD. In each of the merged images, nuclei were stained with DAPI (blue). The scale bar is 25 μm.
DISCUSSION
Steatosis has long been known to be a primary pathological consequence of chronic ethanol consumption in humans and laboratory animals (French, 1989). Evidence obtained over the past decade has demonstrated that the mechanisms by which ethanol produces steatosis are likely to be multifactorial, involving effects on hepatic lipid metabolism, hypoxia, oxidative stress, and lipid peroxidation (French, 1989; Lieber, 2004; Sozio and Crabb, 2008). A key histopathological characteristic of steatosis induced by ethanol consumption is the presence of large CLD in hepatocytes (Day and Yeaman, 1994; Rubin and Farber, 1999). Although the physiological significance of these structures has yet to be formally established, their relatively low surface to volume ratio increases the efficiency of fatty acid storage as neutral lipids and reduces TAG lipolysis rates relative to that of smaller CLD. The effects of these actions would be to enhance storage and suppress mobilization of intracellular fatty acids, which may provide initial protection against the cytotoxic and/or bioactive effects of fatty acids and their metabolites (Listenberger et al., 2003; Postic and Girard, 2008b; Yamaguchi et al., 2007).
Formation of large CLD is assumed to result from increased hepatocyte triglyceride accumulation as a result of effects of ethanol on lipid metabolism (Sozio and Crabb, 2008). However, it has not been demonstrated that increased triglyceride accumulation per se is responsible for large CLD formation. Our study shows that formation of large CLD is unlikely to be as a result of simple increases in hepatic triglyceride accumulation, because they represented a large percentage of CLD LD-Et hepatocytes at week 6 and were not found in LD-Co hepatocytes at this time, despite a relatively small difference in the hepatic triglyceride content of these groups. Moreover, large CLD were also detected at week 3 in LD-Et hepatocytes, at which time there was no difference in hepatic triglyceride content. Evidence presented here documents differences in the protein compositions of CLD in LD-Et and LD-Co livers suggesting that the mechanism by which ethanol metabolism promotes formation of large CLD involves, in part, modification of their associated protein properties. Although not recognized previously as a contributor to hepatic steatosis, general support for this mechanism comes from genetic screening studies of cultured drosophila cells showing that alterations in CLD protein composition influence CLD size and cellular organization (Guo et al., 2008) and from observations that the CLD PAT protein composition varies with CLD size in differentiating 3T3-L1 cells (Brasaemle et al., 1997; Wolins et al., 2005). However, it was unclear from these studies to what extent alterations in CLD properties reflect specific effects of CLD proteins or alterations in cellular processes affecting synthesis and/or packaging of neutral lipids into CLD. Our cell culture experiments, incorporating head-to-head comparisons of the effects of ADPH, perilipin, and TIP47 on CLD accumulation, size, and cellular distribution under identical conditions, directly demonstrate that the PAT protein composition of CLD can be an independent determinant of their size and accumulation. These studies specifically show that among perilipin, ADPH, and TIP47, only perilipin expression promotes large CLD formation. Because the size of perilipin-coated CLD was not affected by the fatty acid concentration of the culture media and/or exposure to ethanol, the effects of perilipin on CLD size appear to be distinct from metabolic processes that influence TAG synthesis. Thus, within the context of a cell culture model, perilipin expression appears to be sufficient to induce formation of large CLD. This finding coupled with our data on mice fed the LD-Et diet and results from human hepatic biopsies (Straub et al., 2008) implicate perilipin as a possible physiological determinant of the formation of large CLD during hepatosteatosis.
Additional studies are needed to formally define the specific physiological effects of perilipin on large lipid vesicles formation. However, observations that perilipin is a more effective inhibitor of lipolysis than ADPH in preadipocyte cultures (Brasaemle et al., 2000) as well in mouse adipose tissue (Martinez-Botas et al., 2000; Tansey et al., 2001) suggest the hypothesis that perilipin promotes large CLD formation through effects on TAG lipolysis. Alternatively, observations that perilipin-coated CLD cluster (Marcinkiewicz et al., 2006) raise the possibility that fusion of clustered perilipin-coated CLD may contributed to formation of large lipid vesicles. Consistent with this latter possibility, our cell culture data show that perilipin-coated CLD form large clusters at one pole of the nucleus, whereas ADPH- or TIP47-coated CLD have a more wide spread distribution.
It is uncertain at present what accounts for the selective expression of perilipin in hepatocytes of LD-Et mice. Perilipin’s expression in adipocytes is known to be induced during lipogenic differentiation, and perilipin has been detected in human macrophages and hepatic tissue under pathophysiological conditions that increase lipid storage (Forcheron et al., 2005; Fujii et al., 2009; Straub et al., 2008). Hepatic perilipin expression however does not appear to be generally related to processes associated with increased lipid storage, because hepatic TAG accumulation is elevated in mice fed either the LD-Co or the LD-Et diets, whereas perilipin was detected only in hepatocytes of mice on the LD-Et diet. Although few details are known about tissue-specific regulation of perilipin expression, its expression is known to be stimulated by PPARγ in differentiating adipocytes (Arimura et al., 2004). Feeding mice an ethanol-containing high fat Lieber-DeCarli diet that is similar in composition to the LD-Et used in our study has recently been shown to significantly enhance hepatic PPARγ expression over that found in livers of mice on the high fat control diet (Peng et al., 2009). Because the importance of PPARγ expression in the development of fatty livers has been demonstrated (Browning and Horton, 2004), ethanol-dependent regulation of perilipin expression by this mechanism is an attractive possibility for inducing large lipid vesicle formation.
Evidence of lipid peroxidation has been detected in human hepatic tissue from patients with alcoholic and nonalcoholic liver disease (Kojima et al., 2005), and it has been proposed that elevated hepatic lipids contribute to lipid peroxidation damage in both disorders (Browning and Horton, 2004; Lieber, 2004). Reactive aldehydes, such as 4-HNE, are byproducts of lipid peroxidation reactions between reactive oxygen molecules, which are generated by oxidative stress responses, and unsaturated fatty acids (Browning and Horton, 2004; Stewart et al., 2001). Protein adducts resulting from these reactive aldehydes binding to proteins have been immunohistochemically localized to hepatocytes that have accumulated lipid following an ethanol diet (Niemela et al., 2002, Sampey et al., 2003). Data presented here demonstrate for the first time that CLD are intracellular targets of 4-HNE adduction, and importantly that either CLD-associated PAT proteins or molecules closely associated with the PAT proteins on the surface of the CLD, appear to be adducted. The finding that 4-HNE labeling of CLD occurred only in mice fed the LD-Et diet, and appeared to be progressive, correlating with time of exposure to ethanol, suggests that CLD surface molecules may be direct targets of lipid peroxidation reactions induced by hepatic ethanol metabolism. Because we did not detect evidence of 4-HNE adduction in fatty livers of mice fed the LD-Co diet, lipid accumulation per se does not appear to contribute to peroxidative adduction of CLD-associated proteins.
Ethanol metabolism is known to activate oxidative stress, mitochondrial, and microsomal pathways that generate reactive oxygen species capable of generating lipid peroxidation adduction products (Lieber, 2004; Tuma and Casey, 2003). Our finding that 4-HNE-labeled CLD in LD-Et-fed mice temporally correlates with evidence of hypoxia, ER stress, and CYP2E1 induction in LD-Et-fed mice is consistent with the potential involvement of these pathways in 4-HNE adduction of CLD. However, the observations that zonal localization of 4-HNE-adducted CLD did not strictly correlate with immunohistochemical evidence of hypoxia or CYP2E1 activity, suggest that these pathways may not be general mediators of CLD adduction reactions.
Although additional studies are required to determine the identities of 4-HNE-adducted CLD proteins and definitively identify how adduction affects CLD properties, our observations that 4-HNE labeling extensively overlaps with that of ADPH, perilipin, and TIP47 suggest that PAT proteins may be 4-HNE adduction targets. The detection of colocalization between 4-HNE and PAT proteins on both small and large CLD demonstrates that 4-HNE adduction of CLD proteins does not specifically occur subsequent to large CLD formation and is consistent with the possibility that 4-HNE adduction contributes to CLD enlargement. Given the importance of PAT proteins in regulating lipolysis of the TAG core of CLD (Ducharme and Bickel, 2008), modifying their functions by 4-HNE adduction is potentially a novel mechanism for promoting the formation of larger CLD.
In summary, our study implicates alterations in the CLD surface protein composition in the formation of large vesicles found in steatotic hepatocytes. Numerous studies have focused on the contributions of metabolic alterations affecting hepatic fatty acid metabolism and lipogenic pathways as regulators of the initiation and progression of steatosis (Browning and Horton, 2004; Lieber, 2004; Postic and Girard, 2008a), whereas the contributions of proteins that coat the surface of TAG storage vesicles to this process have received comparatively little attention. Both correlative and direct evidence from our study identify perilipin as a potential determinant of large CLD formation in hepatic tissue. Although perilipin has been reported to be associated with large lipid vesicles in human biopsies (Fujii et al., 2009; Straub et al., 2008), until now the possible functional importance of this observation was not addressed. Coupled with observations that ADPH is required for formation of steatotic vesicles in diet-induced fatty liver in mice (Chang et al., 2006; Imai et al., 2007), evidence that perilipin contributes to large CLD formation argues that members of the perilipin family of lipid droplet– binding proteins are important physiological regulators of both the initiation and progression of hepatosteatosis.
Observations in our study linking 4-HNE adduction of CLD-associated proteins to the appearance of the large CLD in livers of ethanol-exposed mice also implicate post-translational lipid peroxidation processes in the initial formation of these vesicles. Oxidative stress and lipid peroxidation reactions have been implicated as second-hit mechanisms in the transition from hepatosteatosis to steatohepatitis and fibrosis in both alcoholic and nonalcoholic liver disorders (Browning and Horton, 2004; Lieber, 2004). Lipid peroxidation enhancement of ApoB proteolysis has also been proposed to increase hepatic TAG accumulation by interfering with VLDL secretion (Pan et al., 2004). Data from our study demonstrating that CLD are targets of lipid peroxide adduction and that lipid peroxide adduction of CLD occurs in association with the initial formation of these large lipid vesicles suggest that direct modification of CLD may be an additional mechanism by which stress responses influence hepatic TAG accumulation.
Supplementary Material
Acknowledgments
This research was supported by National Institutes of Health grants RO1DK082574 (ASG), RO1HD045962 (JLM), R37AA09300 (DRP), RO1DK074487 (DRP), and F31AA016710 (JRR). ASG was also supported by grants from the American Diabetes Association and the U.S. Department of Agriculture, Agricultural Research Service, under agreement no. 58-1950-7-70. The authors thank Lisa Litzenberger for her help with the color figures and Drs. Richard A. Deitrich and Donna Dehn for helpful comments, discussions, and critically reading the manuscript. We also thank the reviewers of this manuscript for their constructive criticisms.
Footnotes
Additional Supporting Information may be found in the online version of this article:
Fig. S1. Hematoxylin and eosin staining shows large CLD in LD-Et livers.
Fig. S2. High magnification of ADPH immunohistochemical detection of CLD in livers of mice fed LD-Co and LD-Et diets.
Fig. S3. ADPH stains CLD in stellate cells of mice fed LD-Co or LD-Et diets.
Fig. S4. TIP47 localization in livers from LD-Co- and LD-Et diet-fed mice.
Fig. S5. Perilipin-positive cytoplasmic lipid droplets are induced in hepatocytes of mice fed the LD-Et diet.
Fig. S6. ADPH, perilipin, and TIP47 produce distinct effects on CLD accumulation and size in cultured cells exposed to oleic acid, ethanol, or oleic acid plus ethanol.
Fig. S7. Localization of HIF1α in hepatocytes of mice fed either the LD-Co or LD-Et diet.
Fig. S8. Localization of calreticulin in hepatocytes of mice fed either the LD-Co or LD-Et diet.
Fig. S9. Localization of CYP2E1 in hepatocytes of mice fed either the LD-Co or LD-Et diet.
Fig. S10. Localization of 4-hydroxynonenal in hepatocytes of mice fed either the LD-Co or LD-Et diet.
Please note: Wiley-Blackwell is not responsible for the content or functionality of any supporting information supplied by the authors. Any queries (other than missing material) should be directed to the corresponding author for the article.
References
- Arimura N, Horiba T, Imagawa M, Shimizu M, Sato R. The peroxisome proliferator-activated receptor gamma regulates expression of the perilipin gene in adipocytes. J Biol Chem. 2004;279:10070–10076. doi: 10.1074/jbc.M308522200. [DOI] [PubMed] [Google Scholar]
- Bai J, Cederbaum AI. Overexpression of CYP2E1 in mitochondria sensitizes HepG2 cells to the toxicity caused by depletion of glutathione. J Biol Chem. 2006;281:5128–5136. doi: 10.1074/jbc.M510484200. [DOI] [PubMed] [Google Scholar]
- Brasaemle DL. The perilipin family of structural lipid droplet proteins: stabilization of lipid droplets and control of lipolysis. J Lipid Res. 2007;48:2547–2549. doi: 10.1194/jlr.R700014-JLR200. [DOI] [PubMed] [Google Scholar]
- Brasaemle DL, Barber T, Wolins NE, Serrero G, Blanchette-Mackie EJ, Londos C. Adipose differentiation-related protein is an ubiquitously expressed lipid storage droplet-associated protein. J Lipid Res. 1997;38:2249–2263. [PubMed] [Google Scholar]
- Brasaemle DL, Rubin B, Harten IA, Gruia-Gray J, Kimmel AR, Londos C. Perilipin A increases triacylglycerol storage by decreasing the rate of triacylglycerol hydrolysis. J Biol Chem. 2000;275:38486–38493. doi: 10.1074/jbc.M007322200. [DOI] [PubMed] [Google Scholar]
- Browning JD, Horton JD. Molecular mediators of hepatic steatosis and liver injury. J Clin Invest. 2004;114:147–152. doi: 10.1172/JCI22422. [DOI] [PMC free article] [PubMed] [Google Scholar]
- Brunt EM. Pathology of fatty liver disease. Mod Pathol. 2007;20(Suppl 1):S40–S48. doi: 10.1038/modpathol.3800680. [DOI] [PubMed] [Google Scholar]
- Cairns SR, Peters TJ. Biochemical analysis of hepatic lipid in alcoholic and diabetic and control subjects. Clin Sci (Lond) 1983;65:645–652. doi: 10.1042/cs0650645. [DOI] [PubMed] [Google Scholar]
- Carbone DL, Doorn JA, Kiebler Z, Sampey BP, Petersen DR. Inhibition of Hsp72-mediated protein refolding by 4-hydroxy-2-nonenal. Chem Res Toxicol. 2004;17:1459–1467. doi: 10.1021/tx049838g. [DOI] [PMC free article] [PubMed] [Google Scholar]
- Chang BH, Li L, Paul A, Taniguchi S, Nannegari V, Heird WC, Chan L. Protection against fatty liver but normal adipogenesis in mice lacking adipose differentiation-related protein. Mol Cell Biol. 2006;26:1063–1076. doi: 10.1128/MCB.26.3.1063-1076.2006. [DOI] [PMC free article] [PubMed] [Google Scholar]
- Clifford GM, Londos C, Kraemer FB, Vernon RG, Yeaman SJ. Translocation of hormone-sensitive lipase and perilipin upon lipolytic stimulation of rat adipocytes. J Biol Chem. 2000;275:5011–5015. doi: 10.1074/jbc.275.7.5011. [DOI] [PubMed] [Google Scholar]
- Das SK, Vasudevan DM. Alcohol-induced oxidative stress. Life Sci. 2007;81:177–187. doi: 10.1016/j.lfs.2007.05.005. [DOI] [PubMed] [Google Scholar]
- Day CP, Yeaman SJ. The biochemistry of alcohol-induced fatty liver. Biochim Biophys Acta. 1994;1215:33–48. doi: 10.1016/0005-2760(94)90089-2. [DOI] [PubMed] [Google Scholar]
- Ducharme NA, Bickel PE. Lipid droplets in lipogenesis and lipolysis. Endocrinology. 2008;149:942–949. doi: 10.1210/en.2007-1713. [DOI] [PubMed] [Google Scholar]
- Esterbauer H, Cheeseman KH. Determination of aldehydic lipid peroxidation products: malonaldehyde and 4-hydroxynonenal. Methods Enzymol. 1990;186:407–421. doi: 10.1016/0076-6879(90)86134-h. [DOI] [PubMed] [Google Scholar]
- Forcheron F, Legedz L, Chinetti G, Feugier P, Letexier D, Bricca G, Beylot M. Genes of cholesterol metabolism in human atheroma: overexpression of perilipin and genes promoting cholesterol storage and repression of ABCA1 expression. Arterioscler Thromb Vasc Biol. 2005;25:1711–1717. doi: 10.1161/01.ATV.0000174123.19103.52. [DOI] [PubMed] [Google Scholar]
- French SW. Biochemical basis for alcohol-induced liver injury. Clin Biochem. 1989;22:41–49. doi: 10.1016/s0009-9120(89)80067-0. [DOI] [PubMed] [Google Scholar]
- Friedman SL. Seminars in medicine of the Beth Israel Hospital, Boston. The cellular basis of hepatic fibrosis. Mechanisms and treatment strategies. N Engl J Med. 1993;328:1828–1835. doi: 10.1056/NEJM199306243282508. [DOI] [PubMed] [Google Scholar]
- Fujii H, Ikura Y, Arimoto J, Sugioka K, Iezzoni JC, Park SH, Naruko T, Itabe H, Kawada N, Caldwell SH, Ueda M. Expression of perilipin and adipophilin in nonalcoholic fatty liver disease; relevance to oxidative injury and hepatocyte ballooning. J Atheroscler Thromb. 2009;16:893–901. doi: 10.5551/jat.2055. [DOI] [PubMed] [Google Scholar]
- Gao J, Serrero G. Adipose differentiation related protein (ADRP) expressed in transfected COS-7 cells selectively stimulates long chain fatty acid uptake. J Biol Chem. 1999;274:16825–16830. doi: 10.1074/jbc.274.24.16825. [DOI] [PubMed] [Google Scholar]
- Gross DN, Miyoshi H, Hosaka T, Zhang HH, Pino EC, Souza S, Obin M, Greenberg AS, Pilch PF. Dynamics of lipid droplet-associated proteins during hormonally stimulated lipolysis in engineered adipocytes: stabilization and lipid droplet binding of adipocyte differentiation-related protein/adipophilin. Mol Endocrinol. 2006;20:459–466. doi: 10.1210/me.2005-0323. [DOI] [PubMed] [Google Scholar]
- Guo Y, Walther TC, Rao M, Stuurman N, Goshima G, Terayama K, Wong JS, Vale RD, Walter P, Farese RV. Functional genomic screen reveals genes involved in lipid-droplet formation and utilization. Nature. 2008;453:657–661. doi: 10.1038/nature06928. [DOI] [PMC free article] [PubMed] [Google Scholar]
- Heal R, McGivan J. Induction of calreticulin expression in response to amino acid deprivation in Chinese hamster ovary cells. Biochem J. 1998;329(Pt 2):389–394. doi: 10.1042/bj3290389. [DOI] [PMC free article] [PubMed] [Google Scholar]
- Imai Y, Varela GM, Jackson MB, Graham MJ, Crooke RM, Ahima RS. Reduction of hepatosteatosis and lipid levels by an adipose differentiation-related protein antisense oligonucleotide. Gastroenterology. 2007;132:1947–1954. doi: 10.1053/j.gastro.2007.02.046. [DOI] [PubMed] [Google Scholar]
- James OF, Day CP. Non-alcoholic steatohepatitis (NASH): a disease of emerging identity and importance. J Hepatol. 1998;29:495–501. doi: 10.1016/s0168-8278(98)80073-1. [DOI] [PubMed] [Google Scholar]
- Kim AJ, Shi Y, Austin RC, Werstuck GH. Valproate protects cells from ER stress-induced lipid accumulation and apoptosis by inhibiting glycogen synthase kinase-3. J Cell Sci. 2005;118:89–99. doi: 10.1242/jcs.01562. [DOI] [PubMed] [Google Scholar]
- Kleiner DE, Brunt EM, Van Natta M, Behling C, Contos MJ, Cummings OW, Ferrell LD, Liu YC, Torbenson MS, Unalp-Arida A, et al. Design and validation of a histological scoring system for nonalcoholic fatty liver disease. Hepatology. 2005;41:1313–1321. doi: 10.1002/hep.20701. [DOI] [PubMed] [Google Scholar]
- Kojima H, Sakurai S, Uemura M, Takekawa T, Morimoto H, Tamagawa Y, Fukui H. Difference and similarity between non-alcoholic steatohepatitis and alcoholic liver disease. Alcohol Clin Exp Res. 2005;29:259S–263S. doi: 10.1097/01.alc.0000191776.37626.30. [DOI] [PubMed] [Google Scholar]
- Larigauderie G, Cuaz-Perolin C, Younes AB, Furman C, Lasselin C, Copin C, Jaye M, Fruchart JC, Rouis M. Adipophilin increases triglyceride storage in human macrophages by stimulation of biosynthesis and inhibition of beta-oxidation. Febs J. 2006;273:3498–3510. doi: 10.1111/j.1742-4658.2006.05357.x. [DOI] [PubMed] [Google Scholar]
- Lefkowitch JH. Morphology of alcoholic liver disease. Clin Liver Dis. 2005;9:37–53. doi: 10.1016/j.cld.2004.11.001. [DOI] [PubMed] [Google Scholar]
- Li L, Chen SH, Zhang Y, Yu CH, Li SD, Li YM. Is the hypoxia-inducible factor-1 alpha mRNA expression activated by ethanol-induced injury, the mechanism underlying alcoholic liver disease? Hepatobiliary Pancreat Dis Int. 2006;5:560–563. [PubMed] [Google Scholar]
- Lieber CS. Microsomal ethanol-oxidizing system (MEOS): the first 30 years (1968–1998)—a review. Alcohol Clin Exp Res. 1999;23:991–1007. [PubMed] [Google Scholar]
- Lieber CS. Alcoholic fatty liver: its pathogenesis and mechanism of progression to inflammation and fibrosis. Alcohol. 2004;34:9–19. doi: 10.1016/j.alcohol.2004.07.008. [DOI] [PubMed] [Google Scholar]
- Lieber CS, DeCarli LM. Hepatic microsomal ethanol-oxidizing system. In vitro characteristics and adaptive properties in vivo. J Biol Chem. 1970;245:2505–2512. [PubMed] [Google Scholar]
- Listenberger LL, Han X, Lewis SE, Cases S, Farese RV, Jr, Ory DS, Schaffer JE. Triglyceride accumulation protects against fatty acid-induced lipotoxicity. Proc Natl Acad Sci USA. 2003;100:3077–3082. doi: 10.1073/pnas.0630588100. [DOI] [PMC free article] [PubMed] [Google Scholar]
- Listenberger LL, Ostermeyer-Fay AG, Goldberg EB, Brown WJ, Brown DA. Adipocyte differentiation-related protein reduces lipid droplet association of adipose triglyceride lipase and slows triacylglycerol turnover. J Lipid Res. 2007;48:2751–2761. doi: 10.1194/jlr.M700359-JLR200. [DOI] [PubMed] [Google Scholar]
- Londos C, Sztalryd C, Tansey JT, Kimmel AR. Role of PAT proteins in lipid metabolism. Biochimie. 2005;87:45–49. doi: 10.1016/j.biochi.2004.12.010. [DOI] [PubMed] [Google Scholar]
- Mak KM, Ren C, Ponomarenko A, Cao Q, Lieber CS. Adipose differentiation- related protein is a reliable lipid droplet marker in alcoholic fatty liver of rats. Alcohol Clin Exp Res. 2008;32:683–689. doi: 10.1111/j.1530-0277.2008.00624.x. [DOI] [PubMed] [Google Scholar]
- Marcinkiewicz A, Gauthier D, Garcia A, Brasaemle DL. The phosphorylation of serine 492 of perilipin a directs lipid droplet fragmentation and dispersion. J Biol Chem. 2006;281:11901–11909. doi: 10.1074/jbc.M600171200. [DOI] [PubMed] [Google Scholar]
- Martinez-Botas J, Anderson JB, Tessier D, Lapillonne A, Chang BH, Quast MJ, Gorenstein D, Chen KH, Chan L. Absence of perilipin results in leanness and reverses obesity in Lepr(db/db) mice. Nat Genet. 2000;26:474–479. doi: 10.1038/82630. [DOI] [PubMed] [Google Scholar]
- Niemelä O, Parkkila S, Bradford B, Iimuro Y, Pasanen M, Thurman RG. Effect of Kupffer cell inactivation on ethanol-induced protein adducts in the liver. Free Radic BiolMed. 2002;33:350–355. doi: 10.1016/s0891-5849(02)00894-8. [DOI] [PubMed] [Google Scholar]
- Orlicky DJ, Degala G, Greenwood C, Bales ES, Russell TD, McManaman JL. Multiple functions encoded by the N-terminal PAT domain of adipophilin. J Cell Sci. 2008;121:2921–2929. doi: 10.1242/jcs.026153. [DOI] [PMC free article] [PubMed] [Google Scholar]
- Pan M, Cederbaum AI, Zhang YL, Ginsberg HN, Williams KJ, Fisher EA. Lipid peroxidation and oxidant stress regulate hepatic apolipoprotein B degradation and VLDL production. J Clin Invest. 2004;113:1277–1287. doi: 10.1172/JCI19197. [DOI] [PMC free article] [PubMed] [Google Scholar]
- Peng Z, Borea PA, Varani K, Wilder T, Yee H, Chiriboga L, Blackburn MR, Azzena G, Resta G, Cronstein BN. Adenosine signaling contributes to ethanol-induced fatty liver in mice. J Clin Invest. 2009;119:582–594. doi: 10.1172/JCI37409. [DOI] [PMC free article] [PubMed] [Google Scholar]
- Perides G, Tao X, West N, Sharma A, Steer ML. A mouse model of ethanol dependent pancreatic fibrosis. Gut. 2005;54:1461–1467. doi: 10.1136/gut.2004.062919. [DOI] [PMC free article] [PubMed] [Google Scholar]
- Pirola RC, Lieber CS. Hypothesis: energy wastage in alcoholism and drug abuse: possible role of hepatic microsomal enzymes. Am J Clin Nutr. 1976;29:90–93. doi: 10.1093/ajcn/29.1.90. [DOI] [PubMed] [Google Scholar]
- Postic C, Girard J. Contribution of de novo fatty acid synthesis to hepatic steatosis and insulin resistance: lessons from genetically engineered mice. J Clin Invest. 2008a;118:829–838. doi: 10.1172/JCI34275. [DOI] [PMC free article] [PubMed] [Google Scholar]
- Postic C, Girard J. The role of the lipogenic pathway in the development of hepatic steatosis. DiabetesMetab. 2008b;34:643–648. doi: 10.1016/S1262-3636(08)74599-3. [DOI] [PubMed] [Google Scholar]
- Reddy MA, Shukla SD. Potentiation of mitogen-activated protein kinase by ethanol in embryonic liver cells. Biochem Pharmacol. 1996;51:661–668. doi: 10.1016/s0006-2952(95)02239-2. [DOI] [PubMed] [Google Scholar]
- Robenek H, Hofnagel O, Buers I, Robenek MJ, Troyer D, Severs NJ. Adipophilin-enriched domains in the ER membrane are sites of lipid droplet biogenesis. J Cell Sci. 2006;119:4215–4224. doi: 10.1242/jcs.03191. [DOI] [PubMed] [Google Scholar]
- Roede JR, Orlicky DJ, Fisher AB, Petersen DR. Overexpression of peroxiredoxin 6 does not prevent ethanol-mediated oxidative stress and may play a role in hepatic lipid accumulation. J Pharmacol Exp Ther. 2009;330:79–88. doi: 10.1124/jpet.109.152983. [DOI] [PMC free article] [PubMed] [Google Scholar]
- Roede JR, Stewart BJ, Petersen DR. Decreased expression of peroxiredoxin 6 in a mouse model of ethanol consumption. Free Radic Biol Med. 2008;45:1551–1558. doi: 10.1016/j.freeradbiomed.2008.08.032. [DOI] [PubMed] [Google Scholar]
- Rubin E, Farber JL. Pathology. 3. Lippincott-Raven; Philadelphia: 1999. [Google Scholar]
- Russell TD, Palmer CA, Orlicky DJ, Fischer A, Rudolph MC, Neville MC, McManaman JL. Cytoplasmic lipid droplet accumulation in developing mammary epithelial cells: roles of adipophilin and lipid metabolism. J Lipid Res. 2007;48:1463–1475. doi: 10.1194/jlr.M600474-JLR200. [DOI] [PubMed] [Google Scholar]
- Saarikoski ST, Rivera SP, Hankinson O. Mitogen-inducible gene 6 (MIG-6), adipophilin and tuftelin are inducible by hypoxia. FEBS Lett. 2002;530:186–190. doi: 10.1016/s0014-5793(02)03475-0. [DOI] [PubMed] [Google Scholar]
- Sampey BP, Korourian S, Ronis MJ, Badger TM, Petersen DR. Immunohistochemical characterization of hepatic malondialdehyde and 4-hydroxynonenal modified proteins during early stages of ethanol-induced liver injury. Alcohol Clin Exp Res. 2003;27:1015–1022. doi: 10.1097/01.ALC.0000071928.16732.26. [DOI] [PMC free article] [PubMed] [Google Scholar]
- Song J, Finnerty CC, Herndon DN, Boehning D, Jeschke MG. Severe burn-induced endoplasmic reticulum stress and hepatic damage in mice. MolMed. 2009;15:316–320. doi: 10.2119/molmed.2009.00048. [DOI] [PMC free article] [PubMed] [Google Scholar]
- Sozio M, Crabb DW. Alcohol and lipid metabolism. Am J Physiol Endocrinol Metab. 2008;295:E10–E16. doi: 10.1152/ajpendo.00011.2008. [DOI] [PMC free article] [PubMed] [Google Scholar]
- Stewart S, Jones D, Day CP. Alcoholic liver disease: new insights into mechanisms and preventative strategies. Trends MolMed. 2001;7:408–413. doi: 10.1016/s1471-4914(01)02096-2. [DOI] [PubMed] [Google Scholar]
- Straub BK, Stoeffel P, Heid H, Zimbelmann R, Schirmacher P. Differential pattern of lipid droplet-associated proteins and de novo perilipin expression in hepatocyte steatogenesis. Hepatology. 2008;47:1936–1946. doi: 10.1002/hep.22268. [DOI] [PubMed] [Google Scholar]
- Sztalryd C, Bell M, Lu X, Mertz P, Hickenbottom S, Chang BH, Chan L, Kimmel AR, Londos C. Functional compensation for adipose differentiation- related protein (ADFP) by TIP47 in an ADFP null embryonic cell line. J Biol Chem. 2006;281:34341–34348. doi: 10.1074/jbc.M602497200. [DOI] [PubMed] [Google Scholar]
- Tansey JT, Sztalryd C, Gruia-Gray J, Roush DL, Zee JV, Gavrilova O, Reitman ML, Deng CX, Li C, Kimmel AR, et al. Perilipin ablation results in a lean mouse with aberrant adipocyte lipolysis, enhanced leptin production, and resistance to diet-induced obesity. Proc Natl Acad Sci USA. 2001;98:6494–6499. doi: 10.1073/pnas.101042998. [DOI] [PMC free article] [PubMed] [Google Scholar]
- Tuma DJ, Casey CA. Dangerous byproducts of alcohol breakdown– focus on adducts. Alcohol Res Health. 2003;27:285–290. [PMC free article] [PubMed] [Google Scholar]
- Wolins NE, Brasaemle DL, Bickel PE. A proposed model of fat packaging by exchangeable lipid droplet proteins. FEBS Lett. 2006;580:5484–5491. doi: 10.1016/j.febslet.2006.08.040. [DOI] [PubMed] [Google Scholar]
- Wolins NE, Quaynor BK, Skinner JR, Schoenfish MJ, Tzekov A, Bickel PE. S3–12, Adipophilin, and TIP47 package lipid in adipocytes. J Biol Chem. 2005;280:19146–19155. doi: 10.1074/jbc.M500978200. [DOI] [PubMed] [Google Scholar]
- Wu CC, Howell KE, Neville MC, Yates JR, III, McManaman JL. Proteomics reveal a link between the endoplasmic reticulum and lipid secretory mechanisms in mammary epithelial cells. Electrophoresis. 2000;21:3470–3482. doi: 10.1002/1522-2683(20001001)21:16<3470::AID-ELPS3470>3.0.CO;2-G. [DOI] [PubMed] [Google Scholar]
- Yamaguchi K, Yang L, McCall S, Huang J, Yu XX, Pandey SK, Bhanot S, Monia BP, Li YX, Diehl AM. Inhibiting triglyceride synthesis improves hepatic steatosis but exacerbates liver damage and fibrosis in obese mice with nonalcoholic steatohepatitis. Hepatology. 2007;45:1366–1374. doi: 10.1002/hep.21655. [DOI] [PubMed] [Google Scholar]
Associated Data
This section collects any data citations, data availability statements, or supplementary materials included in this article.