

Abstract
Focal adhesions (FAs) are discrete plasma membrane-associated adhesive organelles that play dual roles in cell force transduction and signaling. FAs consist of clustered transmembrane heterodimeric integrin extracellular matrix (ECM) receptors and a large number of cytoplasmic proteins that collectively form thin plaques linking the ECM to actin filament bundles of the cytoskeleton. FAs are complex organelles that can change their composition in response to biochemical or mechanical cues. These compositional differences may underlie the ability of FAs to mediate an array of important cell functions including adhesion, signaling, force transduction, and regulation of the cytoskeleton. These functions contribute to the physiological processes of the immune response, development, and differentiation. However, linking FA composition to FA function has been difficult since there has been no method to isolate intact FAs reproducibly and determine their composition. We report here a new method for isolating FA structures in cultured cells distinct from cytoplasmic, nuclear, and internal membranous organellar components of the cell. We provide protocols for validation of the fractionation by immunofluorescence and immunoblotting, procedures for preparing the isolated FAs for mass spectrometric proteomic analysis, tips on data interpretation and analysis, and an approach for comparing FA composition in cells in which small GTPase signaling is perturbed.
Keywords: Focal adhesion, Immunofluorescence, Western blotting, Mass spectrometry, Integrin
1. Introduction
Focal adhesions (FAs) are specialized adhesion organelles that can mediate various biological functions and responses through engagement of one specific class of surface receptor, integrins (1-3). Integrins are a family of alpha–beta heterodimer transmembrane receptors that specifically bind extracellular matrix or cell surface-bound ligands. Following integrin activation and binding to ligands, FA-associated proteins are recruited from the cytosol to bind to integrin cytoplasmic tails and one another. Together, these proteins form thin (~200 nm), discrete, (~0.1–10 μm2) plasma membrane-associated FAs plaques linking the ECM to actin filament bundles of the cytoskeleton. Integrins together with FA-associated proteins perform four basic cellular functions that mediate their physiological roles in development, immune response, cardiovascular function, and maintaining tissue integrity. First, integrins in FAs bind extracellular ligands to mediate cell adhesion to ECM or other cells. Second, FAs mediate signaling from integrin engagement to induce dramatically different cellular responses, including proliferation, differentiation, or death. Third, FAs proteins link the cytoskeleton to integrins, allowing cells to transduce force generated in the actomyosin system to the ECM or other cells to drive tissue morphogenesis and cell movement. And finally, FAs act as regulators of the cytoskeleton, modulating its organization through physical interactions with actin filaments and regulating its dynamics via signaling to control the activity of actin-binding proteins and myosin motors (1-3). In addition to mediating these important cell functions, FAs are dynamic, mechanosensitive structures that change composition, grow or disintegrate in response to physical as well as biochemical cues (1, 4). For example, during cell migration, FAs undergo spatiotemporally coordinated cycles of formation and disassembly that enable directional whole cell motion (5). Thus, FAs are complex, dynamic organelles that integrate several distinct cell responses to mediate a diverse array of physiological functions.
One mechanism by which FAs could mediate differential responses through the same class of receptor is by variation of FA protein composition (3, 6). However, a method for systematic analysis of FA composition under different biological conditions has been lacking. Over several decades of research, it has become apparent that FA composition is exceedingly complex. By a variety of methods including protein localization and analysis of FA–protein interactions, more than 155 components (150 proteins plus 4 lipids and calcium ions) have been identified as associating with FAs which, again based on the literature, may be capable of >750 possible protein–protein interactions (7). The FA proteome includes ECM, integrins, cytoskeletal proteins, adaptor proteins, and enzymes, including but not limited to kinases, phosphatases, nucleotide triphosphatases, and their exchange factors. To gain insight into how FAs mediate the downstream responses of integrins through compositional variation of the FA proteome, we present a method for the systematic biochemical isolation of FAs from fibroblasts in tissue culture, and their full compositional analysis by tandem mass spectrometry to ascertain the constituents of complex mixtures of proteins. The protocol includes procedures for validation of the FA isolation by immunofluorescence and immunoblotting, preparation of isolated FAs for proteomic analysis, and tips on data interpretation and analysis. In addition, we present an example application for comparative analysis of FA proteome compositional change in response to perturbation of small GTPase signaling.
2. Materials
2.1. Biochemical FA Isolation Method
Human foreskin fibroblasts (HFF1, ATCC): Cultured in 100-mm tissue culture dishes in Dulbecco’s modified Eagle’s medium (DMEM) containing 15% fetal bovine serum (FBS), 2 mM l-glutamine, and penicillin/streptomycin.
Trypsin/EDTA contains trypsin (0.5 g/L) and EDTA-4Na (0.2 g/L) in Hanks’ balanced salt solution without CaCl2, MgCl2-6H2O, and MgSO4-7H2O.
Human plasma fibronectin purified protein: Diluted to 15 μg/ml in Dulbecco’s phosphate-buffered saline, pH 7.4.
TEA-containing low ionic strength buffer: 2.5 mM triethanolamine (TEA), pH 7.0. Store at room temperature.
Protease inhibitor tablets (complete mini EDTA-free, Roche) containing serine and cysteine protease inhibitors: Dissolved in 10 ml solution just prior to use.
Cell scrapers (L-18, LabScientific, inc.).
Waterpik™ dental water jet (Interplak dental water jet WJ6RW, Conair): Available from most drug stores.
2.2. Immunofluorescence
Cleaned 22 × 22 mm #1.5 cover slips: The brand, thickness, and cleanliness of the coverslip are very important for even adhesion of ECM proteins and low-background epifluorescence microscopy (see Note 1).
HFF cells plated on cleaned 22 × 22 mm #1.5 cover slips and cultured in 35-mm tissue culture dishes.
Cytoskeleton buffer (CB): 10 mM MES, pH 6.1, 138 mM KCl, 3 mM MgCl2, and 2 mM EGTA. Stored at 4°C.
Paraformaldehyde: diluted from a freshly opened ampoule to 4% in CB just prior to use.
Columbia coverslip staining jars.
Blocking reagent: 10% (w/v) fraction V bovine serum albumin and 0.5 mM NH4Cl in PBS.
0.5% Triton X-100 in CB: prepared immediately before use.
0.1 M glycine in CB.
Tris-buffered saline with Tween-20 (TBS-T): Prepare 10× TBS stock with 1.37 M NaCl, 27 mM KCl, and 250 mM Tris–HCl, pH 7.4. Dilute 100 ml with 900 ml distilled water and add Tween-20 at 0.1% (v/v) just prior to use.
Mouse anti-chicken paxillin antibody (see Note 2).
AlexaFluor 488 phalloidin (Gibco/Invitrogen).
Secondary antibody: Cy3-conjugated donkey anti-mouse IgG (Jackson ImmunoResearch).
Fluorescent mounting medium.
Nail polish (Electron Microscopy Science).
Microscope slides (Gold Seal Micro Slides) (see Note 3).
Epifluorescence microscope equipped with a 60× or 100× oil immersion objective lens and a digital camera (Nikon).
Digital image analysis software: We use MetaMorph software (MDS Analytical Technologies); however, freeware such as Image J (http://rsbweb.nih.gov/ij/) and MicroManager (http://www.micro-manager.org/) both have capability sufficient for the analysis described below.
2.3. Western Blotting
Radioimmuno precipitation assay (RIPA) buffer without SDS: 50 mM Tris–HCl, pH 8.0, 150 mM NaCl, 1.0% NP-40, and 0.5% sodium deoxycholate. Store at 4°C.
Primary antibodies: Mouse anti-chicken vinculin antibody (Sigma), mouse anti-human talin antibody (Chemicon), mouse anti-chicken actin antibody (BD), mouse anti-chicken tubulin antibody (Sigma), rabbit anti-human GAPDH antibody (Open Biosystem), and rabbit anti-mouse Akt antibody (Cell Signaling).
Secondary antibodies: Horseradish peroxidase (AffiniPure goat anti-mouse IgG, Jackson ImmunoResearch) and horseradish peroxidase (AffiniPure goat anti-rabbit IgG, Jackson ImmunoResearch).
PAGE/Western blot apparatus.
Immobilon transfer membrane (IPVH304F0, Millipore).
Thermo Scientific Pierce BCA protein assay kits (Fisher).
2.4. Proteomic Analysis
Agarose-conjugated goat anti-human actin antibody (Santa Cruz).
Agarose-conjugated mouse anti-human fibronectin antibody (Santa Cruz).
5-μm Partisphere strong cation exchange resin (Whatman, Clifton, NJ).
5-μm Aqua C18 resin (Phenomenex, Ventura, CA).
3-μm Aqua C18 resin (Phenomenex, Ventura, CA).
Urea.
Protein reduction and alkylation solution: Tris (2-carboxyethyl) phosphine hydrochloride and iodoacetamide.
Calcium chloride.
Trypsin, mass spectrometry grade: Store at 4°C.
Formic acid.
Acetonitrile.
Ammonium acetate.
Buffers for a modified 12-step MudPIT analysis (REF): Buffer A, 5% acetonitrile and 0.1% formic acid; buffer B, 80% acetonitrile and 0.1% formic acid; and buffer C, 500 mM ammonium acetate, 5% acetonitrile, and 0.1% formic acid.
Zero-dead volume union (Upchurch Scientific, Oak Harbor, WA).
Agilent 1100 quaternary HPLC (Agilent, Palo Alto, CA).
LTQ linear ion trap mass spectrometer (Thermo Fisher Scientific, San Jose, CA).
Xcalibur data system (Thermo Fisher Scientific, San Jose, CA).
2.5. Modulation of FA Composition by Manipulation of Cell Signaling
Electroporation is used to transfect plasmid DNA transiently into HFF1.
Human Dermal Fibroblast Nucleofector kit (Amaxa biosystem).
Nucleofector II (Amaxa Biosystem): Program: U-024 is used.
3. Methods
Here, several protocols are described for isolating FA from tissue culture cells, including methods to validate the fractionation protocol morphologically and biochemically, to identify the protein composition from the fractionated FA structures by proteomic analysis, and to utilize this fractionation protocol for isolating FA structures from cells under different perturbation conditions. The overall procedure is outlined in Fig. 1.
Fig. 1.

Diagram of the major steps for isolation of FA from HFF1 cells, followed by validation of FA morphology preservation by immunofluorescence, validation of FA isolation by Western blotting, or determination of FA protein composition by proteomic analysis.
3.1. FA Isolation from Cultured Fibroblasts
The goal of FA isolation from tissue culture cells is to maintain the native FA protein composition and structure bound to the tissue culture substratum for collection, while carefully removing nuclei; internal membrane-bounded organelles; the bulk of the actin, microtubule, and intermediate filament cytoskeletons; most of the cell plasma membrane; and soluble cytoplasmic proteins. Similar to methods introduced by Fujiwara for stress fiber isolation (8), TEA-containing low ionic strength buffer, a pH-balanced hypotonic solution, is used to create osmotic pressure inside cells, which swells cells and thus weakens the membrane integrity. Once the plasma membrane is weakened, membrane-bound organelles, nuclei, and soluble materials of the cytoplasm can be removed by hydrodynamic forces induced by strong trituration using a protease inhibitor-containing, detergent-free, osmotically balanced buffer (PBS), which is important to avoid protein degradation and maintain the FA proteins in their native state (Fig. 2).
Fig. 2.
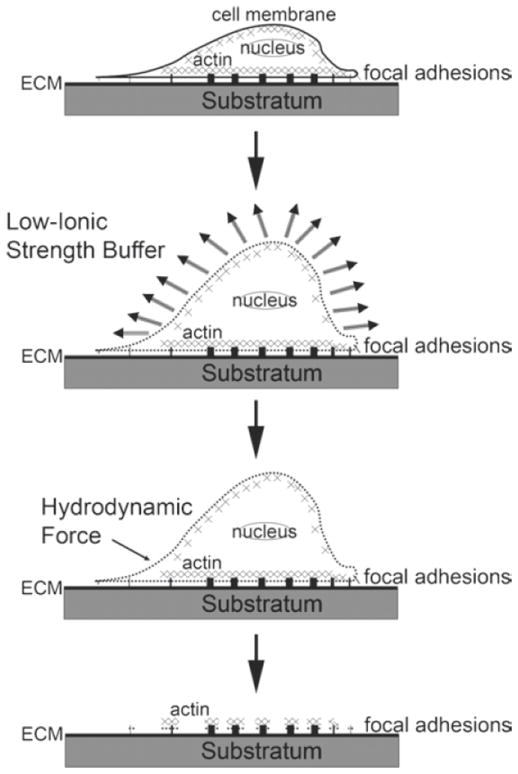
Schematic diagram of the FA isolation procedure.
In contrast to the Fujiwara method (8) that was optimized for preservation of actomyosin stress fibers, our method is aimed at isolating native FA. We put in a considerable amount of work in optimizing our protocol to ensure that major FA components were maintained in the FA fraction, as the Fujiwara method alone was unsuccessful for maintaining many FA proteins in the stress fiber preparation. We present methods for validating preservation of FA proteins in the FA fraction in Subheadings 3.2 and 3.3. Although FA fractions isolated by our method will contain a significant amount of actin, this is unavoidable, as the actin cytoskeleton and FA are interdependent structures, and perturbations of the actin cytoskeleton will unavoidably alter FA structure and composition. As noted in Subheading 3.4, following isolation of FA fractions, excess actin can be removed by immunodepletion prior to proteomic or biochemical analysis.
The protocol below shows the details of the FA isolation method optimized for HFF1 cells grown adhered to human fibronectin. This cell type was chosen by us for its human origin, its robust adherent growth in tissue culture, its amenability to transfection, its robust in vitro cell migration behavior, and its well-developed FA morphology. Our protocol could be adapted to other cell types by experimenting with and optimizing the osmotic shock (step 4) and trituration (step 5) steps below. 15 μg/ml human fibronectin was chosen as the growth substrate because this concentration was found to promote optimal migration of HFF1 cells in culture (unpublished observations). Cells could easily be grown adhered to different ECM proteins or a different concentration of human fibronectin simply by modifying step 1.
Coat tissue culture dishes or microscope coverslips for immunofluorescence with fibronectin for growth of cells. Tissue culture dishes or coverslips are incubated overnight at 4°C in a solution of 15 μg/ml human fibronectin diluted in PBS. This is followed by rinsing three times with PBS. Subsequently, substrates are incubated in 1% BSA-containing DMEM for 1 h at 37°C for blocking. After blocking, the substrates are rinsed once with PBS prior to plating the cells.
Culture HFF1 cells for experiments. HFF1 cells are grown in tissue culture dishes and passaged when approaching confluence with trypsin/EDTA to provide new experimental cultures plated on 15 μg/ml fibronectin-coated 100-mm culture dishes or cover slips. A 1:4 split of near-confluent HFF1 cells can provide experimental cultures that are at approximately 50% confluence after 24 h.
Choose the proper amount of cells. The yield of total FA protein per cm2 of HFF1 cells grown at 50% confluence on 15 μg/ml fibronectin-coated dishes is approximately 0.13 μg. The total protein requirement for Western blot analysis is 4 μg, for 2-D DIGE proteomic analysis 500 μg, and for MudPit Mass spectrometry analysis 60 μg. Plan accordingly when plating cells for your experiments.
Hypotonically shock the cells to weaken the plasma membrane. At 24 h after plating, the cells are rinsed once with 1× PBS and then incubated in TEA-containing low ionic strength buffer to induce cell swelling and weaken the cell membrane integrity. To minimize effects on FA composition and structure, incubation time must be as short as possible. To optimize incubation time for HFF1, we analyzed the morphology of HFF1 cells during treatment with TEA-containing low ionic strength buffer using time-lapse phase-contrast microscopy. Figure 3 shows that HFF1 cells start to swell after 3 min of TEA-containing low ionic strength buffer incubation and explode by 50-min treatment. Based on this analysis, we use 3-min hypotonic shock for HFF1 as the minimum time to induce swelling and still allow removal of the cell bodies (Fig. 4).
Remove cell bodies with hydrodynamic force. Immediately after the cells are incubated with TEA-containing low ionic strength buffer for 3 min at room temperature, 1× PBS containing protease inhibitor is used in the Waterpik to apply strong, pulsed hydrodynamic forces to the cells in order to remove the cell bodies, membrane-bound organelles, nuclei, cytoskeleton, and soluble materials of the cytoplasm. The power of Waterpik trituration needs to be adjusted carefully, since flushing too strongly will remove some low-abundance FA-associated proteins, and flushing too weakly will fail to remove other cell structures. The Waterpik we use has a 7-setting pressure control, and we adjust it to setting “3” for HFF1 cells. During trituration, we hold the nozzle ~0.5 cm from and at an approximate angle of 90° to the surface of the tissue culture dish, and slowly move the nozzle back and forth across the dish, being careful to spray the whole dish surface evenly, for a total time of about 10 s. These recommendations will have to be adjusted to account for your own dental water jet apparatus, trituration style, and cell type. Validation of the cell body removal procedure is discussed in Subheadings 3.2 and 3.3 below. A total volume of 50 ml buffer is used in the Waterpik reservoir. Following the trituration of one dish of cells, the buffer containing the cell bodies is collected from that dish and recycled into the reservoir for use in the trituration of the next dish of cells. This 50 ml of buffer containing all the cell bodies is collected after trituration of all dishes is complete to serve as a sample for Western blot analysis to validate separation of the FA and cell body fractions (see Subheading 3.3). Subsequently, a total volume of 400 ml fresh buffer is used in the Waterpik reservoir to rinse all the dishes again prior to FA fraction collection.
Isolate the FAs that remain attached to the tissue culture dish. Following trituration, excess buffer is removed from the dish using a vacuum manifold, and the remaining buffer and FA structures on the tissue culture dish are collected by adding 300 μl of buffer (1× RIPA containing 0.1% SDS for Western analysis or 1× RIPA containing 1% SDS for mass spectrometric analysis), thoroughly scraping the remaining cellular material from the dish (Fig. 4), and collecting it with a pipette. The material from all dishes is then pooled and used in the analysis of FA-associated proteins without substantial contamination from proteins in the cell body.
Fig. 3.

Time-lapse phase-contrast image series of HFF1 cell morphology after treatment (time in minutes shown) with TEA-containing low ionic strength buffer. As cells appear swollen but not fully rounded up by 3-min treatment, we chose this time point as optimal for our protocol. Scale bar, 20 μm.
Fig. 4.

Comparison of FAs and actin cytoskeleton in HFF1 cells and isolated HFF1 FAs. Intact HFF1 and isolated FAs were fixed and stained with Alexa 488 phalloidin to visualize filamentous actin (green) and indirect immuno-localization of paxillin (red) to show the distribution of FAs. Scale bar, 20 μm.
3.2. Validation of FA Isolation by Immunofluorescence
To validate that the FA isolation method does not adversely affect FA morphology prior to the collection step, the size of individual FAs in intact cells and the FAs remaining adhered to coverslips after cell body removal are determined and compared. We use immunofluorescence to localize paxillin in fixed cells and the FA fraction. Paxillin is a well-known FA adaptor protein (9) whose distribution in digital fluorescence images can indicate the size of individual FAs (Fig. 5a). Figure 5b shows that the proportion of different-sized FAs between intact HFF1 and isolated FA fractions does not significantly differ. This indicates that the FA isolation method does not influence the morphology of FA structures. The protocol below shows how to compare the morphology of FAs in cells and isolated FAs by immunofluorescence. It is also a good idea to validate the loss of nuclear, organellar, or cytoskeletal structures from isolated FAs by double labeling with markers for these structures. We recommend staining with DAPI for nuclei, fluorescent phalloidin for actin, and using indirect immunofluorescence with antibodies to tubulin (microtubules) to determine the degree to which these structures are present or absent in the isolated FA fraction.
Fig. 5.
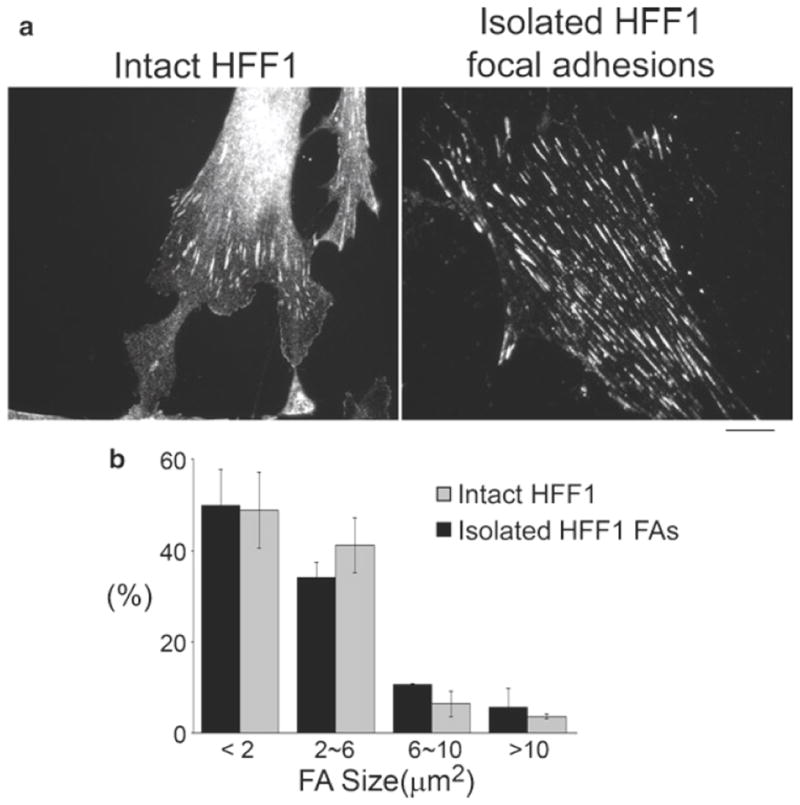
Immunofluorescence and quantitative analysis for validating the preservation of native FA morphology after FA isolation. (a) Intact HFF1 and isolated HFF1 FAs were fixed and processed for indirect immuno-localization of paxillin to show the distribution of FAs. Scale bar, 20 μm. (b) Histogram of the size distribution of thresholded paxillin-containing FAs in images of intact HFF1 cells (n = 3 cells 408 FAs) and the isolated FA fraction (n = 3 cells, 344 FA). Statistical analysis indicates no significant difference in the percentage of FAs of each size range between FAs from intact cells or isolated FAs.
Fix intact HFF1 and the isolated HFF1 FAs adhered to microscope coverslips. Incubate cells/isolated FAs bound to 15 μg/ml fibronectin-coated coverslips with 4% paraformaldehyde in CB for 20 min at room temperature. Use of Columbia coverslip staining jars is helpful for this and remaining steps.
Permeablize the cells with 0.5% Triton X-100 in CB for 5 min at room temperature. Since the isolated FA fraction mostly lacks plasma membrane, permeabilization is not necessary.
Quench free aldehydes for both the fixed cells and isolated FA fraction with 0.1 M glycine in CB for 10 min at room temperature.
Wash the coverslips with TBS-T three times for 5 min each wash.
Block the cells and the isolated FA fraction with blocking reagent for 60 min at room temperature or overnight at 4°C.
Incubate the permeabilized HFF1 cells and the isolated FA fraction with anti-paxillin antibody, diluted 1:1,000 in blocking reagent, for 60 min at room temperature or overnight at 4°C.
Wash the coverslips three times with TBS-T for 5 min each wash.
Incubate the coverslips with secondary antibody. We use a Cy3-conjugated donkey anti-mouse IgG diluted 1:300 in blocking reagent for 60 min at room temperature.
Wash the coverslips three times with TBS-T for 5 min each wash.
Mount the coverslips on microscope slides with fluorescence mounting medium and seal the coverslip to the slide with nail polish.
Obtain fluorescence images of FAs in intact cells and isolated FAs. Analysis of FA size distribution requires that images be acquired with a high magnification, high-resolution objective lens and a digital camera. A lens with a magnification >/= 60× should be used (see Note 4) (10). When acquiring images, utilize the proper filter cube for the fluorophore of your choice, and adjust image brightness by altering the camera exposure time or introducing neutral density filters in the illumination path such that small FAs at the cell periphery are visible, and large FAs do not saturate the camera (Fig. 5a).
Measure the segmented area of individual paxillin-marked FA. After acquiring images, open them in your image analysis software and use the image thresholding function to highlight only regions of the cell that are included within FAs. You may need to convolve the image with a smoothing filter to eliminate “hot pixels” that will be counted as bright FAs. Also, an image “flattening” filter can be helpful if cytoplasmic background causes central cell regions that are bright, but contain no FAs, to be included in the threshold. Convert the thresholded regions to areas, and record the area of each FA. The pixel-to-micron conversion factor must be determined using images of a stage micrometer. If the background level in your immunofluorescence staining is high, it will be difficult to segment FAs by thresholding. Experiment with the rinsing and blocking steps, as well as the choice of fluorescent-labeled secondary antibodies to optimize nice, low-background images suitable for efficient FA segmentation (see Note 5). For the FA size comparison, we set the smallest size of FA we can identify in intact HFF1 as the threshold size for FA in the FA fraction to filter out possible background signal due to nonspecific fluorescence that tends to occur on the coverslip containing isolated FAs.
To determine if any specific population of FAs is adversely affected by the isolation procedure, bin the individual FA areas from both intact cells and the FA fraction into four groups, including <2, 2–6, 6–10, and >10 μm2 (Fig. 5b). Other analysis of FA morphometry (ellipticity, length, width, etc.) can also be performed to add support to the conclusions.
Reduction in small FA in the FA fraction compared to intact cells is likely the result of either too long osmotic shock or excessive trituration, while the presence of excessive cell structures in the FA fraction would likely be due to the opposite issues.
3.3. Validation of FA Isolation by Western Blotting
To confirm that the FA isolation method is able to separate FA structures from cell body components, the levels of some well-known FA-associated proteins, as well as organellar and cytosolic proteins, are analyzed by Western blot to compare their level in the isolated FA and cell body fractions. We use paxillin, talin, and vinculin as our standard FA-associated proteins, and GAPDH, tubulin, and Akt as the standard cell body proteins. The results in Fig. 6 indicate efficient FA isolation, as the standard FA-associated proteins are concentrated in the isolated FA fraction, but present at much lower levels in the cell body fraction. In contrast, the cell body proteins are nearly absent from the FA fraction and concentrated in the cell body fraction. It should be noted that most FA proteins are normally cycling between FA-bound and soluble cytoplasmic pools, and that some FA proteins perform functions in the nucleus. These non-FA functions should be taken into consideration in interpreting the distribution of the protein between FA and cell body fractions. In contrast, many cell body and cytosolic proteins have no (known) association with FA, and for a good preparation, these proteins should be close to 100% depleted from the FA fraction. The protocol below shows how to evaluate the efficiency of FA isolation by determining the degree of separation of FA-associated and cell body proteins by Western blotting.
Fig. 6.

Western blot comparison of cell body and isolated FA fractions as a validation of the efficiency of FA isolation. Equal total protein of isolated FA (FA) and cell body (CB) fractions were subjected to SDS-PAGE and Western analysis with antibodies to the indicated proteins. Paxillin, talin, and vinculin are known FA-associated proteins, while GAPDH, tubulin, and Akt should not be concentrated in FAs. The results indicate efficient FA isolation, as the FA-associated proteins are concentrated in the isolated FA fraction, but present at much lower levels in the cell body fraction. In contrast, the cell body proteins are nearly absent from the FA fraction and concentrated in the cell body fraction.
Collect the cell body (step 5 of Subheading 3.1) and FA fractions (step 6 of Subheading 3.1) from HFF1 cells plated on 15 μg/ml fibronectin-coated 100-mm tissue culture plates. Remember that ~4 μg total FA protein is needed for Western blot analysis. For HFF1 at 50% confluence, we have found that one dish of cells should suffice. The FA fraction is collected in 1× RIPA buffer containing 0.1% SDS. Add 2× RIPA buffer containing 0.2% SDS to the cell body fraction at a 1:1 volume.
Sonicate the denatured fractions on ice at 0°C for 15 s at a constant frequency.
Quantify the protein concentration of the cell body and FA fractions using BCA reagent. The concentration of protein in the cell body fraction is generally much higher than that of the FA fraction, so the cell body fraction can be diluted tenfold before quantifying to improve the accuracy of the measurement (see Note 6).
Perform SDS-PAGE and Western blot. Load equal amount of total protein of cell body fraction and FA fraction onto an SDS-PAGE for Western blotting. We use an 8% gel to detect vinculin, talin, and Akt; a 12% gel to detect paxillin, GAPDH, and tubulin; and a 15% gel to detect actin (Fig. 6). Following electrophoresis, proteins are electrotransferred to Imobilon membrane, and the membranes processed for immunoidentification of proteins by enhanced chemiluminescence. Primary antibodies are used at the following dilutions: vinculin, 1:2,000; talin, 1:1,000; paxillin, 1:10,000; tubulin, 1:5,000, actin, 1:4,000; GAPDH, 1:200; and Akt, 1:1,000. Horseradish peroxidase-AffiniPure goat anti-mouse or anti-rabbit antibodies are used at 1:5,000 and 1:10,000, respectively.
Determine the efficiency of the FA isolation procedure. Western blots are developed with ECL reagent, films exposed, and band intensities quantified. As noted above, FA proteins should be strongly enriched (>70–75%) in the FA fraction compared to the cell body fraction, while cell body proteins should be >95% depleted from the FA fraction.
3.4. Preparation of FA Fractions for Proteomic Analysis
We utilize a “bottom-up” proteomic approach to identify the protein composition of isolated FA fractions. A “bottom-up” approach is a general strategy for analyzing proteomic samples that exploits tandem mass spectrometry to ascertain the constituents of a sample consisting of a complex mixture of fragmented peptides (11). This approach consists of three steps: sample separation, mass analysis, and protein identification. The goal of sample separation is to separate proteins in complex mixtures. Proteins can be separated without enzymatic digestion, by methods such as two-dimensional gel electrophoresis (2D-GE), or after enzymatic digestion into a collection of peptides and are then separated by multidimensional liquid chromatography (LC) approaches. Mass analysis is the driving engine of proteomics that consists of three major elements: ion source, mass analyzer, and detector. Ionization is generally driven by matrix-assisted laser desorption ionization (MALDI) or electrospray ionization (ESI). Mass analysis is generally managed through quadrupole, ion trap (quadrupole ion trap; linear ion trap), time-of flight (TOF), or Fourier-transform ion cyclotron resonance (FTICR) analyzers. Detectors record the ion signals from the analyzer followed by mass spectrometric identification of peptides through sequence database search algorithms.
Our method of choice for protein separation is 2D-LC. Although 2D-GE separates proteins in mixtures by size and by isoelectric focusing, after which spots in the gel are subjected to mass spectrometry, this approach may fail to retain proteins of extreme pI, molecular weight, hydrophobicity, or low concentration. Because of these limitations, we perform 2D-LC for the digested peptides separation of the protein mixtures in a technique developed by the Yates lab for comprehensive analysis of complex protein mixtures called multidimensional protein identification technology (MudPIT) (12). In MudPIT, proteins are reduced, alkylated, and digested to peptides and subsequently separated via 2D-LC rather than 2D-GE. The MudPIT separation uses a biphase column to separate the peptide mixture by both their charge and hydrophobicity. The first separation is a strong cation exchange (SCX) column to capture charged peptides. The second separation is a reverse phase chromatography to bind the uncharged peptides. Acetonitrile and ammonium acetate proceed in gradient to elute the peptides and flow them directly into the mass spectrometer. Thus, all the peptides, even from low-abundance proteins in isolated FA fractions, can be analyzed without loss of extreme pI and hydrophobicity components.
Here, we describe the protocols including how to prepare the FA fractions for MudPIT analysis and how to identify the protein composition through MudPIT (Fig. 8). Note that we include a critical step (Subheading 3.4.1, step 3) of immunodepleting the two major protein components from the FA fraction, actin and fibronectin. We found that without this important step, many of the low-abundance FA proteins could not be detected.
Fig. 8.
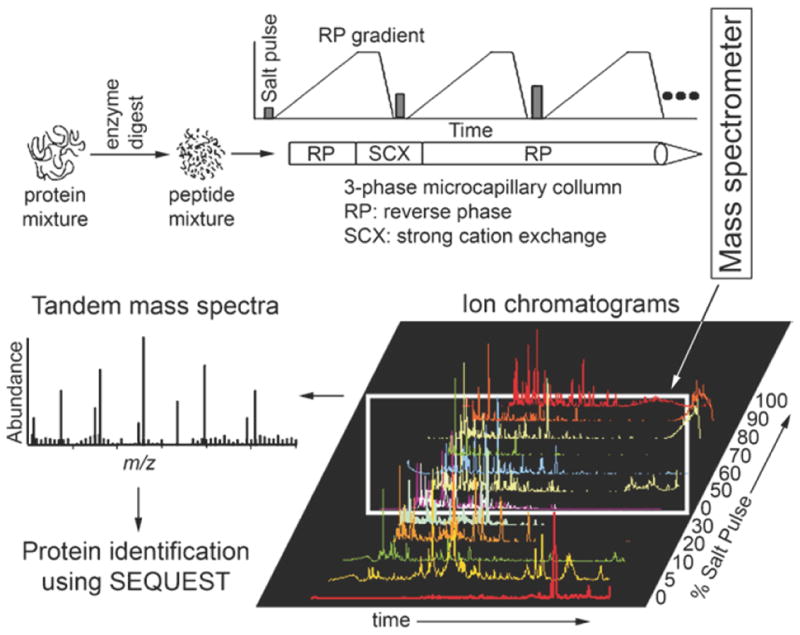
Flow diagram of the major steps of multidimensional protein identification technology (MudPIT) for protein identification in a complex mixture.
3.4.1. Preparation of the Isolated FA Proteins for MudPIT Proteomic Analysis
Isolate FA fraction from HFF cells at 50% confluence and grown in 15 μg/ml fibronectin-coated 100-mm culture dishes. Once cell bodies are removed, collect the FA fraction in 1× RIPA buffer containing 1% SDS, and incubate for 5 min on ice. Remember that ~60 μg total FA protein is needed for MudPIT analysis. For HFF1 at 50% confluence, six dishes should suffice.
Sonicate FA proteins for 15 s on ice at constant frequency.
Immunodeplete fibronectin and actin from the denatured FA fraction (Fig. 7). Fibronectin (used to plate the cells on) and actin (which remains adhered to many isolated FAs) are in such excess over most FA proteins that they mask detection of lower abundance FA proteins. To improve the dynamic range of the mass spectrum, the concentration of fibronectin and actin in the samples can be greatly reduced by immunodepletion. For immunodepletion, commercial agarose-conjugated goat antihuman actin and agarose-conjugated mouse-antihuman fibronectin antibodies are used. The linkage between antibody and agarose is covalent and not denatured by 1% SDS. If lots of IgG are detected in mass spectrometry, this indicates poor efficiency of cross-linking, and can be overcome by washing with 1× RIPA containing 1% SDS three to five times. Add anti-fibronectin and anti-actin antibodycoupled agarose beads to the FA fraction at a ratio of 1:1:1 (1 μg of fibronectin antibody:1 μg of actin anibody:1 μg FA total protein) and rotate for overnight at 4°C. Subsequently, pellet the agarose-conjugated antibodies and save the supernatant, which consists of the actin/fibronectin-depleted FA fractions. Load equal volume of FA fraction, before and after immunodepletion, onto SDS-PAGE for Western blot analysis of the level of actin, fibronectin, and paxillin in the FA fraction before and after immunodepletion. Figure 7 shows that the majority of actin and fibronectin is depleted, but paxillin still exists in the FA fraction.
Concentrate proteins from the actin/fibronectin-depleted FA fractions by ethanol precipitation. 1 volume of the actin/ fibronectin-depleted FA fraction is mixed with 9 volumes of ice-cold 100% ethanol. Incubate overnight at −20°C. Collect precipitated proteins by centrifugation for 15 min at 4°C at 15,000 × g. After carefully removing the supernatant, the precipitated FA protein pellets can be stored at −80°C without further treatment until use for MudPit analysis.
Fig. 7.

Western blot analysis of the efficiency of immunodepletion of actin and fibronectin from isolated FA fractions. Equal total protein of isolated HFF1 FA fractions that had been subjected to immunodepletion of actin and fibronectin (+) or not (−) was subjected to SDS-PAGE and Western analysis with antibodies to the indicated proteins. The results indicate substantial depletion of actin and fibronectin, but no effect on the level of paxillin in the samples.
3.4.2. Protein Identification by Multidimensional Protein Identification Technology
Denature proteins and reduce oxidative cross-links. Resuspend the precipitated FA protein pellets (~50 μg) in digestion buffer (8 M urea, 100 mM Tris–HCl, pH 8.5). Proteins are reduced and alkylated to eliminate cysteine cross-links with tris(2-carboxyethyl)phosphine (TCEP) and iodoacetamide. Add 500 mM TCEP stock to bring the solution to 5 mM and incubate for 15 min at room temperature. Subsequently, add 500 mM iodoacetamide stock to 10 mM final concentration and incubate at room temperature for 20 min in the dark. Dilute the mixture to 2 M urea with 100 mM Tris–HCl, pH 8.5, and add CaCl2 to 2 mM.
Trypsin digest denatured proteins. Add trypsin at a 1:50 enzyme:protein molar ratio and incubate at 37°C overnight for digestion. Terminate digestion by bringing to 5% formic acid. This mixture of digested protein can then be stored at −80°C without further treatment until mass spectrometry analysis.
Load proteins and prepare columns for mass spectrometry. Pressure-load the digested peptide mixtures onto a Kasilfritted fused silica capillary column (250-μm i.d.) packed with 3 cm of 5-μm Partisphere strong cation exchange resin and 3 cm of 5-μm Aqua C18 resin. Desalt the column with buffer containing 95% water, 5% acetonitrile, and 0.1% formic acid. After desalting, connect the sample-loaded backend column through a zero-dead-volume union to a 100-μm i.d. capillary column with a 5-μm pulled tip and packed with 10 cm 3-μm Aqua C18 material, and place the entire threephase column in line with an Agilent 1100 quaternary HPLC.
Perform a modified 12-step MudPIT analysis. The first step consists of a 70-min gradient from 0 to 100% buffer B. Steps 2–12 have the following gradient profile: 3 min of 100% buffer A, 5 min of X% buffer C, a 10-min gradient from 0 to 10% buffer B, a 70-min gradient from 10 to 45% buffer B, a 10-min gradient from 45 to 100% buffer B, and a 10-min equilibration of 100% buffer A. The 5-min buffer C percentages (X) are 5, 10, 20, 30, 40, 50, 60, 70, 80, 90, and 100%, respectively, for the 2–12-step analysis. As peptides are eluted from the microcapillary column, they are electrosprayed directly into an LTQ linear ion trap mass spectrometer with the application of a distal 2.5-kV spray voltage. A cycle of one full-scan mass spectrum (400–1,400 m/z) followed by five data-dependent tandem mass (MS/MS) spectra at a 35% normalized collision energy is repeated continuously throughout each step of the multidimensional separation. Application of mass spectrometer scan functions and HPLC solvent gradients is controlled by the Xcalibur data system, which provides instrument control and data analysis (13).
3.4.3. Data Interpretation
Generate tandem mass (MS/MS) spectra via the Xcalibur data system, which consists of an automated spectral quality assessment algorithm (13) to remove poor-quality spectra.
Match the filtered MS/MS spectral data of peptides against amino acid sequences in a human protein database (14). The database may be downloaded from the International Protein Index ((IPI), version 3.30 in June 2007) using the SEQUEST™ algorithm (14). The peptide identification is based on the determination of whether detected tandem mass spectra of the target peptide match the theoretical fragmentation pattern generated on the predicted peptides that would be produced from trypsin digestion of proteins in the human proteome. Each protein can thus be represented by multiple mass spectra, each representing different peptide fragments (sequence count), and each individual peptide can be detected multiple times. Thus, the total “spectrum counts” that match to a specific protein roughly represent that protein’s abundance in the sample.
Assemble the protein “hit list” based on two criteria.
Criteria 1
There must be a single sequence count (or more) indicating the presence of the protein, and that the chances that it is a false-positive match between the detected peptide and the human protein sequence must be determined to be less than 1%. In the proteomics field, often this first “hit” criterion is two sequence counts and has a false positive rate of 5%. We used a lower cutoff for sequence counts to increase inclusion of important low-abundance proteins, but increase the stringency of the false-positive rate to maintain our confidence in the protein identification. To determine the false-positive protein identification rate, we use the targetdecoy approach in which the actual determined peptide sequences are matched to a decoy database made up of the peptides predicted from digestion of the reverse amino acid sequence of the human proteome (15). Basically, SEQUEST converts the character-based representation of amino acid sequences of peptides of similar precursor masses in a protein database to theoretically predicted fragmentation patterns, which are compared against the tandem spectrum generated on the target peptide. The algorithm initially identifies amino acid sequences in the database that match the measured precursor mass of the peptide, compares fragment ions against the MS/MS spectrum, and generates a preliminary score for each amino acid sequence. A cross-correlation analysis is then performed on the top 500 preliminary scoring peptides by correlating theoretical, reconstructed spectra against the experimental spectrum. All of our searches were parallelized and performed on a Beowulf computer cluster consisting of 100 1.2-GHz Athlon CPUs (16). No digestion enzyme specificity is considered for any search. A fixed modification (+57.02146 Da) on cysteines, introduced by reduction and alkylation by our protein preparation protocol, is also considered. SEQUEST results are assembled and filtered using the DTASelect (version 2.0) program (17), a tool for assembling and comparing protein identifications. DTASelect 2.0 uses a linear discriminate analysis to set XCorr and DeltaCN thresholds dynamically for the entire dataset to achieve a user-specified false-positive rate. The false-positive rates are estimated by the program from the number and quality of spectral matches to the decoy database. Finally, the protein hit list contains protein IDs with spectrum counts (18, 19).
Criteria 2
To decrease the chance of variations from sample preparation, comparing protein hits from multiple runs using CONTRAST software (20) is necessary. We include proteins in the hit list that are identified at least twice out of three or four biological replicate runs.
3.4.4. Expectations and Troubleshooting
In our studies, we routinely identify ~1,000 different proteins in our HFF1 FA preps, ~600 of which end up passing the two criteria (Subheading 3.4.3) for inclusion in the final hit list. In examining the results, one should compare what is known to be in FA from the literature. A good resource for this is the recent comprehensive review by Zaidel-Bar and Geiger (7) which contains an assembled list of proteins known to associate with FA based on the literature. You may find that well-known FA proteins that should be present in your FA fraction are absent from your protein hit list. We had this problem with the well-known FA protein, paxillin, which was easily detected in isolated FA fractions by both immunofluorescence and immunoblotting (as described in Subheadings 3.2 and 3.3), but was not detected by MudPIT analysis. Through much effort, we determined that the lack of detection of low-abundance proteins might be due to the presence of too much actin and fibronectin in the FA fractions. This led us to develop the inclusion of the immunoprecipitation step for the removal of actin and fibronectin from the FA fraction to improve the dynamic range of the MudPIT analysis. Other possibilities for loss of low-abundance proteins from the FA fraction include improper hypotonic shock or excess trituration. On the contrary, many proteins are not expected in FA fractions, such as nuclear proteins, soluble proteins, “housekeeping” proteins, or microtubule-associated proteins, but you may find that they pass the two criteria for inclusion in the hit list. Some of them may be novel FA-associated proteins or proteins included by indirect protein–protein interactions as members of multi-protein complexes, only a subset of which may have been shown to associate with FAs. In addition, some proteins in the FA hit list may be from contamination of the sample preparation. Although we set the second criterion of presence in multiple sample replicates to decrease the chance of contamination from sample preparation, it is still possible to get contamination if the skill of FA isolation is not practiced. It is suggested that the proteins that the experimenter finds interesting for their inclusion in FAs be further validated by literature search and assays including localization in cell culture.
3.5. Comparative Analysis of FA Composition Under Different Biological Conditions
The most important use of the FA isolation method is for comparative analysis of FA protein composition under various conditions. The conditions can include pharmacological, genetic, molecular, or physical manipulations of cells, as well as comparison of cells of different tissue origin or from disease models. Results of comparative proteomic analysis of FAs from cells under different conditions can provide insight into molecular mechanisms by which FA mediate responses to specific stimuli, or the role of specific proteins in FA function. In addition, since MudPIT analysis is such a sensitive technique, the presence or absence of specific proteins detected in isolated FA fractions under multiple conditions will add confidence to either including or excluding certain proteins as bona fide FA components.
In this section, we describe the approach for comparative analysis of FA proteins under different biological conditions. We describe as a test model the manipulation of Rho family small GTPases by expression of constitutively active mutants of Rac1 and RhoA. It is well known that members of the Rho GTPase family serve as biochemical regulators of FA structure and function (1, 21). Rac1 GTPase activity initiates formation of small focal complexes beneath the lamellipodium that drive cell protrusion, while RhoA activity promotes FA elongation and maturation that may inhibit motility via activation of myosin II contractility (1, 21). In spite of their known effects on FA morphology, how Rac1 and RhoA affect FA protein composition is not known. Therefore, examples of how the biochemical FA isolation method is applied to analyze the composition of the different types of FA structures induced by constitutive activation of these small GTPases are shown below. Obviously, this procedure could be applied to perturbation of any protein of choice using expression of dominant negative mutants or shRNAi. We include tips on how to obtain homogenous perturbation across a cell population, and how to interpret results and quantitate the changes in FA protein composition under these conditions of genetic perturbation compared to untreated control cells.
3.5.1. Determining the Protein Composition of FAs from Experimental and Control Cells
To obtain homogeneous perturbation of Rho family small GTPase function across an entire cell population, isolate HFF1 cells expressing GFP fusions of activated mutants of Rac1 and RhoA. The cDNA constructs driving expression of the mutant proteins should include a selectable marker for isolation of expressing cells by antibiotic selection if desired, or a GFP fusion tag for isolation of expressing cells by flow cytometry. In addition, the promoter should drive high level expression (such as CMV) for relatively homogenous, high level expression. To generate HFF1 cells expressing GFP-tagged versions of the constitutively active Rac1 or RhoA (1, 21), in this example, we utilize transient transfection followed by flow cytometry isolation of expressing cells. Obviously, different methods of protein expression including adeno- or lentivirus-based systems can be used, and stable and/or clonal cell lines can be selected. First, transiently transfect eukaryotic expression vectors coding GFP-tagged constitutively active Rac1 (Rac1Q61L) or RhoA (RhoAV14) into HFF1 cells using your method of choice. GFP-only in a similar vector as the mutant proteins should be transfected into cells as a control. We use a Nucleofector electroporator, which achieves up to 50% transfection efficiency when used according to the manufacturer’s instructions (kit: Human Dermal Fibroblast Nucleofector kit, program: U-024). Remember to take the transfection efficiency into account when determining how many cells you will need to transfect to obtain the total amount of protein you will need for FA isolation for immunofluorescence, Western blotting, or proteomic analysis.
Following transfection, cells are grown for 24 h and then subjected to flow cytometry to isolate the GFP-positive cells.
The isolated GFP protein-expressing HFF1 are plated on 15 μg/ml fibronectin-coated culture dishes or coverslips overnight.
The FA isolation method is performed as described above (Subheading 3.1) to isolate the Rac1-mediated small FA structures and the larger, RhoA-induced FA (Fig. 9), as well as FA from cells expressing GFP alone as a control.
Perform FA morphology validation. Using the procedure described in Subheading 3.2, validate preservation of FA morphology in isolated FA fractions and intact cells under each experimental and control condition. In the case of Rac1 GTPase activation, the results of this validation reveal that FAs are smaller than those in control and those in cells expressing activated RhoA. This will reduce the total protein isolated in an FA prep from Rac1-expressing cells, and should be taken into consideration when plating cells for FA isolation validation by Western blotting (step 6 below) or FA proteomic analysis (step 7 below).
Perform FA isolation validation. Using the procedure described in Subheading 3.3, validate separation of FA proteins from cell body proteins for each experimental and control condition. It is imperative that the total protein loaded onto the gel be the same for all experimental and control conditions. In examining the results of the validation, in addition to the efficiency of separation of FA and cell body proteins, attention should also be paid to the relative level of FA proteins in control and Rac1- or RhoA-expressing cells. This can serve as validation of the MudPIT-based quantitative comparison of proteins in FAs under the different experimental conditions, and can also provide information for choosing an internal normalization standard for the quantitative comparison between conditions (see Subheading 3.5.2).
Perform MudPIT proteomic analysis. It is imperative that the total protein loaded into the 2D-LC system be the same for all experimental conditions. Using the procedure described in Subheading 3.4, identify the protein components in isolated FA fractions for each experimental and control condition that pass both selection criteria, and assemble hit lists of proteins, including spectrum counts, for each experimental condition.
Fig. 9.
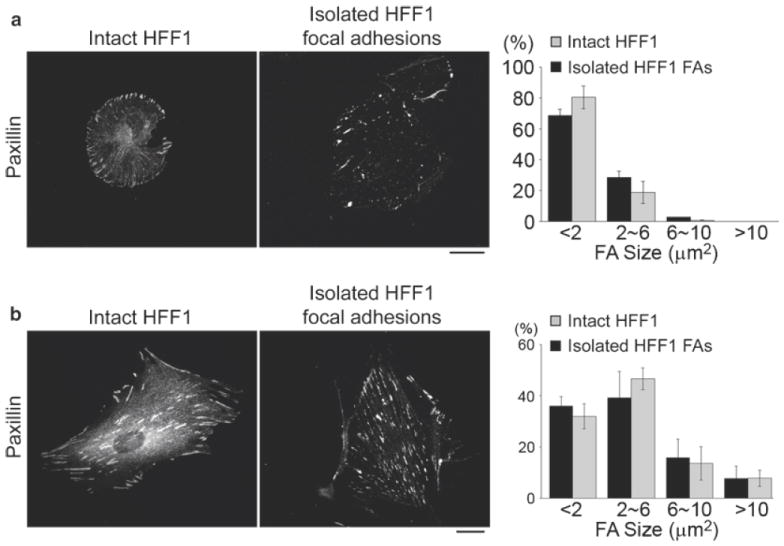
Immunofluorescence and quantitative analysis for validating the preservation of native FA morphology after FA isolation in HFF1 cells expressing either constitutively activated Rac1 (a) or constitutively activated RhoA (b). Intact HFF1 and isolated HFF1 FAs were fixed and processed for indirect immuno-localization of paxillin to show the distribution of FAs. Scale bar, 20 μm. Right shows histogram of the size distribution of thresholded paxillin-containing FAs in images of intact HFF1 cells (n = 3 cells, 403 FAs for activated Rac1; n = 3 cells, 460 FAs for activated RhoA) and the isolated FA fraction (n = 3 cells, 96 FAs for activated Rac1; n = 4 cells, 533 FAs for activated RhoA). Statistical analysis indicates no significant difference in the percentage of FAs of each size range between FAs from intact cells or isolated FAs.
3.5.2. Quantitative Comparison of Relative Protein Abundance in Isolated FA Under Different Experimental Conditions
Changes in FA protein composition of experimental cells versus control fall into two categories. First, there is the binary gain or loss of proteins from experimental FAs compared to control. This occurs when a protein that is present on the hit list of control cells is absent from the hit list of experimental FAs, or vice versa. This tends to occur for lower abundance proteins, and thus its validity can be questionable. Alternatively, the relative abundance of a protein may change in FAs with an experimental perturbation, i.e., its level in FA may increase or decrease relative to control. Here, we discuss the rationale for our quantitation of changes in relative protein abundance in FAs under different experimental conditions.
A semi-quantitative readout of protein abundance in a complex mixture that is obtained from MudPIT analysis is the total spectrum counts for each protein. The number of spectrum counts is related to both the efficiency of the digestion process (dependent on protein sequence and length) and the amount of total protein input (20, 22). Thus, since different proteins are digested with different efficiency, the number of spectrum counts for each protein within a given sample is not a direct measure of the relative abundance of those proteins in the sample. However, since the digestion efficiency of a specific protein should be independent of the origin of the sample, spectrum counts can serve as a quantitative measure of the relative change in abundance of specific proteins in similarly prepared samples from different experimental conditions. Since we are interested in how proteins change relative abundance in FAs under different cellular perturbation conditions, and we can assume that the proteins are digested similarly in the different samples, the quantitative comparison of specific FA proteins can be obtained based on the ratio of spectrum counts for each protein in the hit lists of experimental and control FA. However, since mass spectrometry is much more sensitive that our ability to determine protein concentration accurately by simple assays such as BCA, the spectrum counts should be normalized relative to a medium-abundance protein that can unequivocably shown to remain constant in level between experimental and control samples. To normalize relative to the constant protein, we divide the spectrum counts of this constant protein in the control sample into the spectrum counts of all proteins (including the constant) in the hit list of the experimental sample. Finally, the normalized spectrum counts can be used to obtain the ratio of spectrum counts, and thus the relative protein abundance, between control and experimental FAs.
Compare protein hit lists from control and experimental cells to determine proteins with a binary response in terms of their presence in FAs under different experimental perturbations. This will produce a list of proteins that are either gained or lost in FAs of cells expressing activated GTPases compared to FAs from control cells. Since the complete loss or gain of a protein cannot be used to calculate a ratio, the ratio of normalized spectrum counts cannot be used as a measure of the change in relative protein abundance between samples. However, the relative abundance can be estimated from the number of spectrum counts of these binary response proteins in the sample in which they are present. The validity of the binary gain or loss of a protein from FAs should be considered questionable when the protein is present only in very low abundance. If such proteins are of interest, their gain or loss from FAs should be validated by Western blotting of isolated FA under different conditions, as in Subheading 3.3 and by immunofluorescence of intact cells.
Determine a protein appropriate for use as a normalization standard whose relative abundance in FAs does not change between control and experimental conditions. Using the same protocol as for Western blot-based validation of the FA isolation procedure (Subheadings 3.3 and 3.5.1), load the same amount of total isolated FA protein (without immunodepletion) from the isolated FA fractions of control and experimental cells into SDS-PAGEs and subsequently blot to Immobilon. Probe the blots with antibodies to known FA proteins that were found from their spectrum counts in MudPIT analysis to be present at similar, intermediate levels in the hit lists from control and experimental FA preps. Develop the blots and quantitate the band intensities to see which protein(s) keep the same level of relative abundance in FAs across experimental conditions. Once a protein appears to be a good candidate as a constant for normalization, it is a good idea to run a Western analysis of a dilution series of FA proteins from control and experimental cells to provide confidence that the amount of the normalization constant protein is really similar in each sample, independent of signal in the developed blot. One can support the notion that the protein is present in similar levels in FAs of intact cells under the different experimental perturbation conditions by quantifying the average intensity of FAs either in fluorescence images of cells expressing a GFP-tagged version of the protein or in fixed cells processed for immunofluorescence localization of the protein, although this may not be as reliable as Western blotting. It is wise to find a few FA proteins whose relative abundance does not change across experimental conditions to allow comparison of results with different normalization standards, which will add confidence to one’s conclusions.
Normalize the spectrum counts of proteins in FAs from experimental cells. Using the procedure above, we found that paxillin does not change its relative abundance in FAs under Rac1 or RhoA perturbations compared to in FAs of GFP-expressing control cells, and therefore use the number of spectrum counts of paxillin in control cells as the normalization standard. Divide the spectrum counts for each protein in the hit lists for FA proteins from cells expressing activated Rac1 or activated RhoA by the number of spectrum counts for paxillin in FAs from cells expressing GFP alone.
Determine the ratio of the normalized spectra counts for each protein present in both experimental and control conditions. If the ratio is close to 1, it indicates that the experimental condition does not influence the abundance of this protein in FAs. If the ratio is extremely high or low, it indicates the increase or reduction, respectively, in the relative abundance of this protein in FAs dependent on the experimental condition. To categorize proteins according to how strongly their relative abundance in FAs is affected by the perturbation of Rho GTPase signaling, we divide proteins into groups based on the calculated ratio. We consider proteins with less than twofold change in abundance (ratios of >0.5 or <2) to have little change between conditions, those with between two- and five-fold change (ratios of 0.2–0.5 or 2–5) as having intermediate change, and proteins with more than five-fold change (ratios of <0.2 or >5) to be strongly affected by the perturbation in terms of their abundance in FAs. Together, these results will provide a comprehensive analysis of how Rac1 and RhoA activity affect the protein composition of FAs.
Footnotes
Coverslips should be cleaned by sequential 30-min periods of bath sonication immersed in the following solutions: Hot tap water with Versaclean detergent; hot tap water; 1 mM EDTA in distilled, deionized water; distilled, deionized water; 10% ethanol in distilled, deionized water; and 100% ethanol. Each sonication step should be interspersed with 5–10 rinsings in the subsequent (and final) solution. This procedure can be performed in coverslips in bulk, and cleaned coverslips stored in a jar immersed in 100% ethanol until use.
This antibody is excellent for both Western blotting and immunofluorescence.
The Gold Seal brand is recommended because of its high-quality glass and cleanliness, which reduces background fluorescence in images.
The resolution of the lens is defined by the numerical aperture, which is listed below the magnification on the lens body. A lens with a numerical aperture greater than 1, preferably 1.4, should be used. Such high-resolution lenses require immersion oil for full resolution.
We always buy Jackson “minimal cross” secondaries as these tend to have the lowest nonspecific background staining. In addition, use of old permeabilization buffer in which the triton was not added immediately prior to use may inhibit the efficiency of permeabilization, which will lead to a high level of cytosolic staining that obscures FA staining in intact cells.
Do not use Bradford reagent for protein quantification, as SDS inhibits its accuracy.
References
- 1.Bershadsky AD, Balaban NQ, Geiger B. Adhesion-dependent cell mechanosensitivity. Annu Rev Cell Dev Biol. 2003;19:677–695. doi: 10.1146/annurev.cellbio.19.111301.153011. [DOI] [PubMed] [Google Scholar]
- 2.Burridge K, Fath K, Kelly T, Nuckolls G, Turner C. Focal adhesions: transmembrane junctions between the extracellular matrix and the cytoskeleton. Annu Rev Cell Biol. 1988;4:487–525. doi: 10.1146/annurev.cb.04.110188.002415. [DOI] [PubMed] [Google Scholar]
- 3.Hynes RO. Integrins: bidirectional, allosteric signaling machines. Cell. 2002;110:673–687. doi: 10.1016/s0092-8674(02)00971-6. [DOI] [PubMed] [Google Scholar]
- 4.Discher DE, Janmey P, Wang YL. Tissue cells feel and respond to the stiffness of their substrate. Science. 2005;310:1139–1143. doi: 10.1126/science.1116995. [DOI] [PubMed] [Google Scholar]
- 5.Lauffenburger DA, Horwitz AF. Cell migration: a physically integrated molecular process. Cell. 1996;84:359–369. doi: 10.1016/s0092-8674(00)81280-5. [DOI] [PubMed] [Google Scholar]
- 6.Zamir E, Geiger B. Molecular complexity and dynamics of cell-matrix adhesions. J Cell Sci. 2001;114:3583–3590. doi: 10.1242/jcs.114.20.3583. [DOI] [PubMed] [Google Scholar]
- 7.Zaidel-Bar R, Itzkovitz S, Ma’ayan A, Iyengar R, Geiger B. Functional atlas of the integrin adhesome. Nat Cell Biol. 2007;9:858–867. doi: 10.1038/ncb0807-858. [DOI] [PMC free article] [PubMed] [Google Scholar]
- 8.Katoh K, Kano Y, Masuda M, Onishi H, Fujiwara K. Isolation and contraction of the stress fiber. Mol Biol Cell. 1998;9:1919–1938. doi: 10.1091/mbc.9.7.1919. [DOI] [PMC free article] [PubMed] [Google Scholar]
- 9.Brown MC, Turner CE. Paxillin: adapting to change. Physiol Rev. 2004;84:1315–1339. doi: 10.1152/physrev.00002.2004. [DOI] [PubMed] [Google Scholar]
- 10.Murphy DB. Fundamentals of light microscopy and electronic imaging. Wiley-Liss; New York: 2001. pp. 85–91. [Google Scholar]
- 11.Han X, Aslanian A, Yates JR., III Mass spectrometry for proteomics. Curr Opin Chem Biol. 2008;12:483–490. doi: 10.1016/j.cbpa.2008.07.024. [DOI] [PMC free article] [PubMed] [Google Scholar]
- 12.Washburn MP, Wolters D, Yates JR., III Large-scale analysis of the yeast proteome by multidimensional protein identification technology. Nat Biotechnol. 2001;19:242–247. doi: 10.1038/85686. [DOI] [PubMed] [Google Scholar]
- 13.Bern M, Goldberg D, McDonald WH, Yates JR., III Automatic quality assessment of peptide tandem mass spectra. Bioinformatics. 2004;20:s49–s54. doi: 10.1093/bioinformatics/bth947. [DOI] [PubMed] [Google Scholar]
- 14.Eng JK, McCormack AL, Yates JR., III An approach to correlate tandem mass spectral data of peptides with amino acid sequences in a protein database. J Am Soc Mass Spectrom. 94 A.D;5:976–989. doi: 10.1016/1044-0305(94)80016-2. [DOI] [PubMed] [Google Scholar]
- 15.Peng J, Elias JE, Thoreen CC, Licklider LJ, Gygi SP. Evaluation of multidimensional chromatography coupled with tandem mass spectrometry (LC/LC-MS/MS) for large-scale protein analysis: the yeast proteome. J Proteome Res. 2003;2:43–50. doi: 10.1021/pr025556v. [DOI] [PubMed] [Google Scholar]
- 16.Peng J, Schwartz D, Elias JE, Thoreen CC, Cheng D, Marsischky G, Roelofs J, Finley D, Gygi SP. A proteomics approach to understanding protein ubiquitination. Nat Biotechnol. 2003;21:921–926. doi: 10.1038/nbt849. [DOI] [PubMed] [Google Scholar]
- 17.Sadygov RG, Eng J, Durr E, Saraf A, McDonald H, MacCoss MJ, Yates JR., III Code developments to improve the efficiency of automated MS/MS spectra interpretation. J Proteome Res. 2002;1:211–215. doi: 10.1021/pr015514r. [DOI] [PubMed] [Google Scholar]
- 18.Chen EI, Hewel J, Krueger JS, Tiraby C, Weber MR, Kralli A, Becker K, Yates JR, III, Felding-Habermann B. Adaptation of energy metabolism in breast cancer brain metastases. Cancer Res. 2007;67:1472–1486. doi: 10.1158/0008-5472.CAN-06-3137. [DOI] [PubMed] [Google Scholar]
- 19.Tabb DL, McDonald WH, Yates JR., III DTASelect and Contrast: tools for assembling and comparing protein identifications from shotgun proteomics. J Proteome Res. 2002;1:21–26. doi: 10.1021/pr015504q. [DOI] [PMC free article] [PubMed] [Google Scholar]
- 20.Liu H, Sadygov RG, Yates JR., III A model for random sampling and estimation of relative protein abundance in shotgun proteomics. Anal Chem. 2004;76:4193–4201. doi: 10.1021/ac0498563. [DOI] [PubMed] [Google Scholar]
- 21.Etienne-Manneville S, Hall A. Rho GTPases in cell biology. Nature. 2002;420:629–635. doi: 10.1038/nature01148. [DOI] [PubMed] [Google Scholar]
- 22.Paoletti AC, Parmely TJ, Tomomori-Sato C, Sato S, Zhu D, Conaway RC, Conaway JW, Florens L, Washburn MP. Quantitative proteomic analysis of distinct mammalian Mediator complexes using normalized spectral abundance factors. Proc Natl Acad Sci USA. 2006;103:18928–18933. doi: 10.1073/pnas.0606379103. [DOI] [PMC free article] [PubMed] [Google Scholar]