Abstract
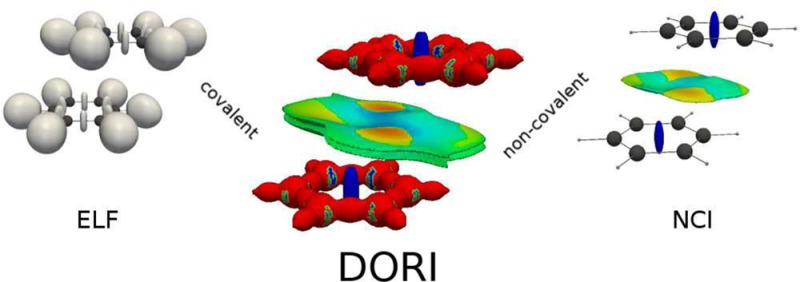
We introduce a density-dependent bonding descriptor that enables simultaneous visualization of both covalent and noncovalent interactions. The proposed quantity is tailored to reveal the regions of space, where the total electron density results from a strong overlap of shell, atomic, or molecular densities. We show that this approach is successful in describing a variety of bonding patterns as well as nonbonding contacts. The Density Overlap Regions Indicator (DORI) analysis is also exploited to visualize and quantify the concept of electronic compactness in supramolecular chemistry. In particular, the scalar field is used to compare the compactness in molecular crystals, with a special emphasis on quaterthiophene derivatives with enhanced charge mobilities.
1. Introduction
Visualization of bonding interactions between atoms and molecules is a long-standing quest in computational chemistry. During its development many methods have been proposed to serve this purpose. The main interest lies in creating a tool that enables not only to see the interaction but also to interpret its character and properties. There is no general agreement on how to derive an optimal method and the existing ones are based on many very different ideas based on orbital transformations, localization descriptors, topological density analysis, and others. This problem can be traced back to the lack of a clear and unambiguous definition of a bond in quantum mechanics. Therefore, a chemical bond together with other notions such as electron shells, lone pairs, aromaticity, atomic charges, (hyper-) conjugation, strain, etc. constitute a rich set of “fuzzy”, yet invaluably useful concepts.1−4
The fundamental model of chemical bonding is based on one-determinantal electronic structure methods such as Hartree–Fock or Kohn–Sham density functional theory (DFT). The fundamental ingredients of these methods, namely canonical molecular orbitals (CMO), represent bonds, lone pairs, and core electrons. The analysis of bonding effects is based on their symmetry as well as corresponding orbital energies. An undesired feature of CMOs is that they are delocalized over large parts of a molecule, which is not compatible with a typically two-center character of an individual bond, that is, the Lewis picture. This character is restored by localized molecular orbitals (LMO), which are obtained by some unitary transformation of occupied CMOs. A number of localization procedures has been proposed, which differ by the criterion used for the transformation.5−14 As LMOs are not eigenfunction of a one-electron Hamiltonian, they do not have well-defined energies. Also, depending on the method, LMOs can be a combination of CMOs of different symmetry.
The Lewis picture of chemical bonding can be restored from a one-particle density matrix in atomic orbitals basis by Natural Bond Orbitals (NBO) analysis.15,16 NBOs can be seen as an extension of LMOs, where the constraint on occupation numbers has been released in favor of stricter localization. Therefore, NBOs yield maximum occupancy one- and two-center orbitals. The bonding patterns beyond the two-center paradigm, can be studied with the Adaptive Natural Density Partitioning (AdNDP)17,18 method, which is a generalization of the NBO concepts.
The interpretation of chemical bonding in terms of molecular orbitals remains nonetheless ambiguous. For an N electron closed-shell system, there are N/2 occupied orbitals, which extend over the entire space or a restricted region of space, which means that orbital densities overlap with each other. As a result, the do not offer an intuitive depiction and detailed information on the nature and location of electron pairs. A different class of bonding analysis methods is based on scalar fields, which detect localized electrons in real space. These localization functions are usually computed from molecular orbitals or density matrices, such as Electron Localization Function (ELF),19−21 Localized Orbital Locator (LOL),22,23 Electron Localizability Indicator (ELI),24−26 or nonadditive Fisher information.27,28 Methods relying only on electron density have also been proposed recently, such as Localized Electrons Detector (LED)29,30 or Single-Exponential Decay Detector (SEDD).31,32 The starting point and rationale for different bonding detectors is based on different physical assumptions, nevertheless, usually they provide some local measure of Pauli repulsion, which is related directly to the kinetic energy of electrons.
Another prominent method for bonding analysis is the quantum theory of atoms in molecules (QTAIM).33,34 Within this theory, the total electron density is partitioned into nonoverlapping atomic basins. The whole analysis is based on topological properties of electron density, such as the character of stationary points and existence of bonding paths defined in terms of the density gradient. The Laplacian of the density is used as an indicator of local charge concentration,35 which yields also information about bonding in real space. Additional information about the character of the bond can be extracted from various characteristics calculated at the bond critical point, such as the bond ellipticity36 or metallicity.37−39
All the above-mentioned approaches have gained much popularity and were applied to many computational studies of molecular systems. Additionally, QTAIM is widely used in analysis of experimental charge densities,40−42 whereas application of orbital-based localization functions requires further approximations.43,44 QTAIM, in principle, allows to characterize both covalent and noncovalent interactions; however, their representation in terms of stationary points and bond paths is not very intuitive. On the other hand, localization functions provide a meaningful representation of atomic shells, lone pairs, and covalent bonds, but usually, they do not detect noncovalent interactions. This gap has been filled recently by the noncovalent interaction (NCI) index,45,46 which is based on the reduced density gradient (RDG) and uses concepts from QTAIM to distinguish the character of interactions. The dependence of NCI on electron density only enables a straightforward analysis of experimental charge densities.47 NCI visualizes both intra- and intermolecular weak interactions through RDG isosurfaces at low electron density values, however, does not reveal covalent bonds. The interest in studying simultaneously strong and weak interactions has led to applications of combined ELF/NCI analysis.48,49
In this work, we introduce a scalar field, which reveals both covalent and noncovalent interactions in the same value range. It should be seen as a modification of the Single-Exponential Decay Detector,31,32,50 which was proposed by one of us as a density-based bonding descriptor. Although, in principle, SEDD reveals both covalent and noncovalent interactions, the latter ones are often not well resolved due to the significant numerical noise in the low density regions, stemming from the use of finite atomic basis sets. The approach presented here is free from this flaw and additionally allows for a convenient transformation to the range of values restricted between 0 and 1. Contrary to the majority of bonding descriptors, the introduced quantity does not directly measure where do the electrons locate but rather focuses on geometrical features of the electron density. More specifically, one here reveals regions of space where the electron density between atoms, molecules or atomic shells clashes. As detailed in the next section, these overlapping regions can be identified by the deviation of their densities from that of localized electrons, which decay approximately exponentially from an arbitrary point. A physical interpretation of the proposed descriptor has been provided in terms of the local wave vector51−53 (i.e., ∇ρ(r)/ρ(r)), which is constant for single-exponential densities and thus reflective of the shape of the density.
We apply the introduced scalar field to several illustrative studies of bonding effects in molecular systems. They include illustrations of covalent bonds of varying nature, π-electron delocalization and intermolecular interactions. We also use this approach to visualize and quantify electronic implications of compactness in organic molecular crystals. In particular, we analyze the relation between so understood compactness and charge mobilities in a molecular crystal relevant to the field of organic electronics.
2. Theory
Considering solid foundations and the remarkable success of density functional theory, today there is very little doubt that electron density contains all the useful information about electronic structure of molecular systems. However, there are not many well established methods to visualize bonding patterns in molecules, that are based solely on electron density. The recently introduced single-exponential decay detector31,32,50 succeeds in revealing atomic shells, lone electron pairs and core electrons. Moreover, SEDD-based atomic shell populations50 stay in close quantitative agreement with the Aufbau principle, which fixes the integer number of electrons in atomic shells. Initially, SEDD was introduced as an arbitrary dimensionless function of electron density, meant to discover single-exponential regions of the density,
 |
1 |
where a square of a vector refers to a scalar product. This convention is used throughout this work and the explicit form of this equation and the following ones in terms of density derivatives is given in the Supporting Information. The idea behind SEDD was based on an Ansatz that, for localized electrons, the density can be described locally by a single orbital, which decays approximately exponentially from an arbitrary point. Later, a physical interpretation was attributed to it in terms of the local wave vector k(r) = ((∇ρ(r))/(ρ(r)) and the homogeneous electron gas (HEG) reference system.50 The properties of SEDD are such that it has low values within localized electron shells, bonds, and lone pairs and goes to infinity far from the molecule. For noncovalent intermolecular interactions, a decrease in SEDD values was observed in the region between two molecules;31 so in principle, it discerns strong at weak interactions simultaneously. Unfortunately, SEDD suffers from relatively strong basis set dependence resulting in numerical noise in low density regions. Therefore, analysis of noncovalent interactions is difficult in practice. We propose a new descriptor, which is also based on the idea of detecting single-exponential parts of the density, however, exhibits a more regular behavior and enables a simultaneous analysis of covalent and noncovalent interactions.
For exponential densities, ρ(r) ∼ e–λ|r–r0|, the term ξ(r) = ∇((∇ρ(r)/ρ(r))2/ρ(r))2 in eq 1 is proportional to η(r) = (∇k2(r)/(kF3))2, where k(r) is the local wave vector and kF = (3π2ρ)1/3 is the Fermi wave vector in the HEG model. Therefore, SEDD has low values where the gradient of the squared local wavenumber is small compared to the volume of the Fermi sphere. The square of the local wavenumber can be intuitively related to the local kinetic energy per particle; however, the latter is not a well-defined quantity.54−57 The reference of HEG is employed to obtain a dimensionless quantity, nevertheless, it is not the only possibility. Another choice is to use self-reference and divide ▽k2(r) by the proper power of k2(r) itself. This leads to the following dimensionless quantity
 |
2 |
Both, ξ(r) and θ(r) are equal to 0 if ρ(r) is exactly single-exponential; however, they have different properties for approximately exponential densities, which can be found in molecular systems. In vicinity of nuclei, the density behaves similar to e–2Zα|r–rα|, where Z is the nuclear charge and rα is the position of a nucleus.58 Therefore, in these regions θ ≈ 0, as the nominator in eq 2 is approximately 0 and the denominator is a constant. The same holds far from the molecule, where the single-exponential decay is dictated by the ionization potential I: ρ(r) ∼ e–2(2I)1/2|r|.59
In bonding regions, the density is characterized by small gradients, in particular ▽ρ(r) = 0 at the bond critical point (BCP). In this case, both, the nominator and the denominator go to zero. Since the denominator decays to zero faster while approaching the BCP, θ(r) → + ∞. This contrasting behavior in the atomic core regions and at bonds shows that θ(r) cannot be treated as a localization function. Instead, it is a renormalization of the density, allowing to distinguish its character from geometrical properties and indicating bonding regions wherever θ(r) → + ∞.
Considering that θ(r) is unbound from above, it is not very convenient from the point of view of its visualization. Therefore, we make use of the standard mapping to the [0,1] range
| 3 |
Now, γ(r) is close to 1 in bonding regions and close to 0 at nuclei and far from the molecule. The asymptotic behavior of γ(r) at nuclear positions, BCPs and infinity was deduced from its analytic form. Nevertheless, the performance in detecting bonding regions of realistic systems has to be verified numerically.
The role of γ is to probe geometrical features of electron density by measuring the deviations from single-exponentiality. This idea is based on the fact that atomic densities are approximately piecewise exponential,60−62 whereas in the interaction regions they are not, due to the overlap of two or more atomic densities. The same is true for interactions between whole molecules as the molecular density tails also decay exponentially. This is a different approach compared to the majority of bonding descriptors, which aim at revealing where electrons are localized. Therefore, it is instructive to show how γ performs in practice for a model system representing an overlap of two simple densities. To this end, we take a density which is a sum of two displaced hydrogen densities, i.e. an H2 promolecule.
Figure 1a shows such density ρ (blue line) for a separation of 1.4 au between hydrogen atoms, which is very close to the equilibrium bond length of the real H2 molecule. The decomposition of ρ into atomic contributions is marked with green lines. It is evident that γ (purple line) is 0 outside the bonding region, where the total density is strongly dominated by the density of a single hydrogen. On the other hand, within the bond, the curvature of ρ is dictated by the overlap of two tails and γ > 0. In the bond midpoint, where the overlap is the strongest, γ reaches its upper bound.
Figure 1.
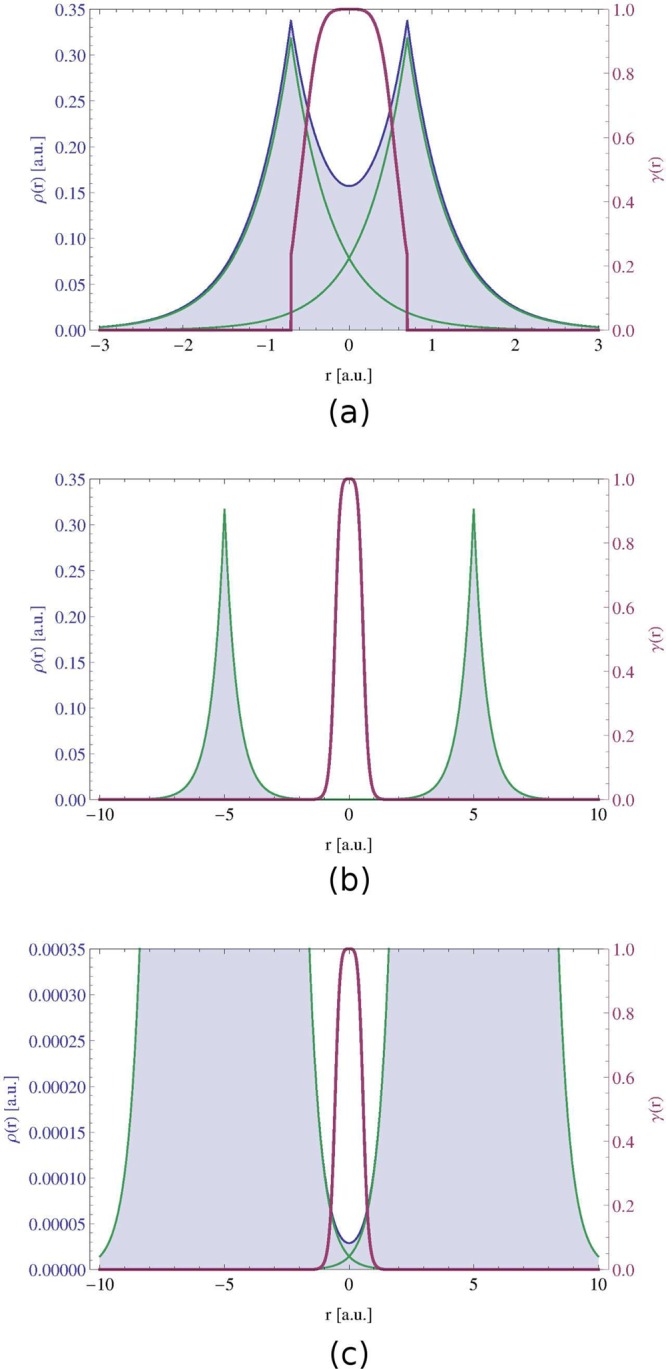
Density ρ(r) (blue) and γ(r) (purple) for the H2 promolecule at the internuclear separation of (a) 1.4 au, (b) 10 au, (c) 10 au (close-up on low density values). Densities of two constituting hydrogen atoms are in green.
An analogous picture, but for a 10 au separation, is given in Figure 1b. Here, the two densities are very well separated and their overlap is negligible on the scale of the density itself. Nevertheless, γ gives a similar picture as for the strong overlap case. Figure 1c shows the same density but only up to a 1000 times smaller value. Now it is evident that γ reveals strong atomic density overlap regions regardless of the magnitude of the density, which means that strong and weak interactions are treated on an equal footing. It has to be noted, that the overlap region between two densities is discovered just by analyzing the shape of the total density, without any a priori knowledge of how it was constructed.
Since the meaning of γ has been identified as a detector of strong relative density overlap regions, we propose a name Density Overlap Regions Indicator (DORI), which will replace the γ symbol from now on.
3. Computational Details
Electronic structure of the investigated molecules was calculated with the ADF63 package at the generalized Kohn–Sham level of theory using B3LYP exchange-correlation functional and the TZP basis set. Unless otherwise stated, geometries were optimized at the same level. All presented properties, including DORI, were calculated on a grid with a locally modified version of DGrid program.64 ParaView65 was used to visualize the results.
Patches to compute DORI with DGrid64 and NCIPLOT46 programs are available from the authors on request.
4. Typical Chemical Interactions
4.1. Intramolecular Interactions
The capability of DORI to visualize typical bonding patterns is evaluated on a selection of small molecular systems that are (a) H2, (b) O2, (c) N2, (d) F2, (e) CO, (f) CO2, (g) LiH, (h) B2H6, (i) C2H6, (j) C2H4, (k) C2H2, (l) C6H6. Figure 2 shows color-coded maps of DORI, where blue color corresponds to DORI(r) ≈ 1 and the red DORI(r) ≈ 0. The positions of nuclei and bonds are indicated explicitly only when needed for the sake of clarity.
Figure 2.
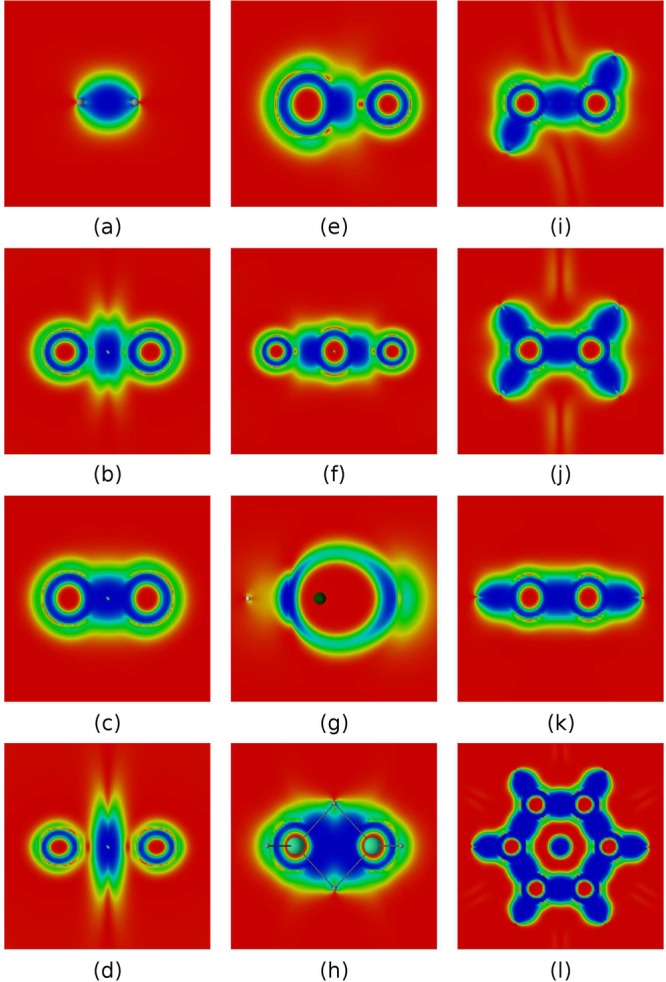
DORI representation of typical bonds in a selection of molecular systems: (a) H2, (b) O2, (c) N2, (d) F2, (e) CO, (f) CO2, (g) LiH, (h) B2H6, (i) C2H6, (j) C2H4, (k) C2H2, (l) C6H6. Values in the range from 0 (red) to 1 (blue).
The hydrogen molecule (Figure 2a) is characterized by the presence of a direct lenticular bond. This contrasts with the picture given by bonding descriptors based on local Pauli repulsion measures (e.g., ELF), which intrinsically cannot reveal any bonding for a closed-shell two-electron system. The double bond in the triplet oxygen O2 (Figure 2b) is described by a basin of DORI values close to 1, which is located around the bond midpoint. Around nuclei, DORI is close to zero, indicating the position of localized 1s electrons. Outside localized cores, the overlap region between core and valence electrons results in high DORI values. Between these overlap regions and the bonding region DORI ≈ 0.5. In contrast with ELF, the lone electron pairs on oxygen atoms, which do not stem from the overlap of atomic densities, are not explicitly revealed by DORI. N2 (Figure 2c) and F2 (Figure 2d) shows essentially the same features as O2 but with larger (triple bond) and smaller (single bond) bonding regions, respectively. The bonding region of N2 merges with core/valence overlap domains, whereas in F2 DORI falls to 0 in between the atomic and bonding zones and exhibit a more discotic shape. This distinct character of the DORI bonding domain in F2 is in line with the fact that the F–F bond is one of the weakest of all covalent bonds due to large electrostatic repulsion.66
Unlike their contrasting Lewis structures, the DORI pictures of CO and CO2 (Figure 2e and f) are very similar. The bonds merge with the carbon’s atomic region that is bigger than that of the oxygen atoms. This results from a larger spatial extent of core electrons density due to a smaller nuclear charge. In case of an ionic LiH (Figure 2g), the density on lithium is strongly polarized and forms a cavity inside the interaction region between two atoms. The strong interaction region is present not only between hydrogen and lithium, but also on the other side of the latter atom. Figure 2h shows the bonding pattern of B2H6. From the valence perspective, diborane is an example of a three-center two-electron bond, where hydrogen acts as a bridging atom. From the perspective of DORI the bond results from a clash of atomic densities inside the BHBH four-member ring. The interaction region is delocalized over the four atoms, but still, one discerns a direct B–H bonding.
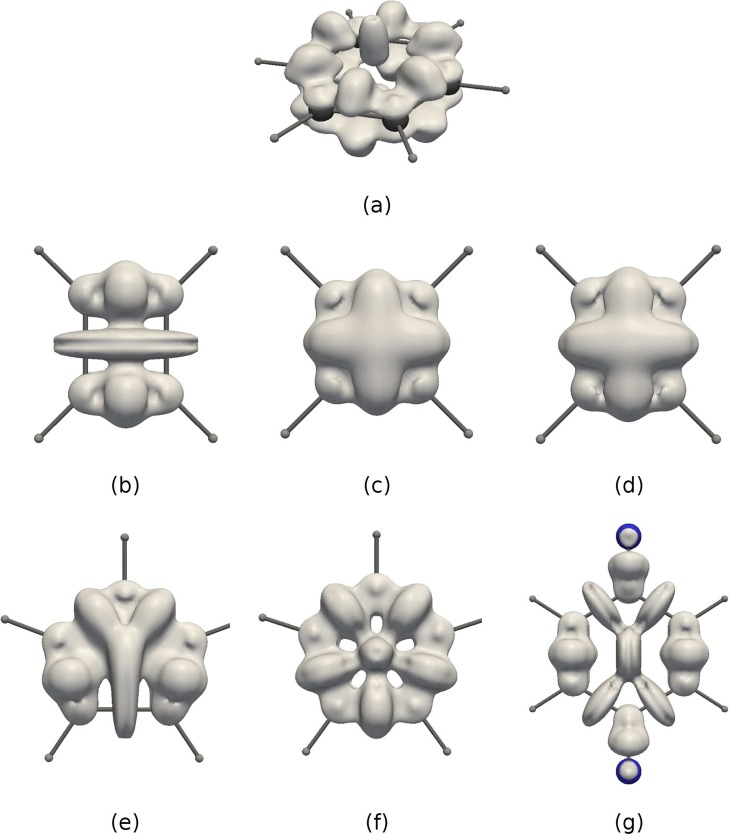
The pictures of ethane, ethene, ethyne, and benzene are given in Figures 2i–l. All these hydrocarbons display direct C–C and C–H bonds. The shape of the single C–C bond is lenticular, whereas multiple bonds become more cylindrical. π bonds are not explicitly discernible as atomic densities overlap strongly along the bond axis. In the case of benzene (Figure 2l and 3a vide infra), the delocalized bonding pattern, manifested in the lack of bond alternation, is nevertheless clearly visible along with a steric clash at the ring center. The latter feature, not captured by ELF, demonstrates DORI’s ability to reveal noncovalent interactions within molecule in addition to covalent bonds. In this context, the π electronic structure of C4H4 is certainly the most striking example. As emphasized by Schleyer and Politzer67−69 the small 4π-electron annulene should be regarded as a unique molecule rather than as the antiaromatic paradigm. Its uniqueness arises from its ring strain and from the presence of two strongly localized and dense π bonds in close proximity. Consideration of isosurface of DORI calculated from the π electron density (Figure 3b) perfectly illustrates the density clash arising from this proximity. Removal of two electrons releases the π localization constrain typical for antiaromatic systems and restores the delocalized 4c–3e picture in D4h or even D2h C4H42+ (Figure 3c and d, respectively). DORI provides a concrete evidence for the repulsive π–π interaction (strong Pauli repulsion) between parallel double bonds. The repulsion between the two localized double bonds is also apparent in C5H5 (Figure 3e) or benzoquinone (Figure 3g) but to a lesser extent, due to broader angles or larger distance between them. Akin to C4H42+, the delocalization pattern is also recovered in aromatic C5H5 (Figure 3f).
Figure 3.
DORIπ = 0.7 isosurface for (a) benzene, (b) C4H4, (c) C4H42+, (d) C4H4 in the geometry of C4H4, (e) C5H5+, (f) C5H5, (g) 1,4-benzoquinone.
4.2. Intermolecular Interactions
So far, DORI was shown to reveal myriad bonding patterns as well as steric clashes within molecules. However, the same tool can be used to untangle the nature of intermolecular interactions. Since DORI identifies regions of overlapping density, it does not directly carry information on the strength of the interaction and does not distinguish between attraction and repulsion. In line with the NCI index,45 this limitation is resolved by combining the analysis of DORI with that of the electron density Laplacian (▽2ρ). The regions of noncovalent interactions are characterized by positive values of the density Laplacian irrespective of their attractive or repulsive nature. However, the decomposition of ▽2ρ into the sum of Hessian eigenvalues ▽2ρ = λ1 + λ2 + λ3, (λ1 ≤ λ2 ≤ λ3) provides a much clearer view. In particular, the second eigenvalue λ2 < 0 is known to identify bonding regions, while λ2 > 0 indicates nonbonding interactions. Along with its sign, the magnitude of the interaction is estimated from the values of the density itself; therefore, we use sgn(λ2)ρ(r) as a complementary scalar field (see ref (45) for more details). A valuable alternative for characterizing the interactions would be to use eigenvalues of the stress tensor70−74 instead of the electron density Hessian. However, calculating the stress tensor is more computationally demanding and requires knowledge of the one-particle reduced density matrix. Since we aim at a solely density-based analysis, we do not exploit this possibility in the current work.
The DORI capability of depicting intermolecular interactions is demonstrated on a series of typical noncovalently bound dimers taken from the S22 set,75 which enable a direct comparison with the NCI index (Supporting Information to ref (45)). Figure 4 shows DORI = 0.9 isosurfaces for the selected dimers with color-coded values of sgn(λ2)ρ(r). As both NCI and DORI probe the shape of the density, the character and magnitude of the noncovalent interactions are captured in a similar manner by their isosurfaces and sgn(λ2)ρ(r). It is evident that DORI reveals all sorts of intermolecular interactions going from hydrogen bonds, pure dispersion interactions to steric clashes. However, what clearly distinguishes DORI is that covalent bonds and the core/valence interface of the constituent atoms are also visible in the same [0–1] range without imposing any arbitrary thresholds on the electron density. All in all, DORI offers a coherent and comprehensive description of all the chemically relevant interactions present in complex molecular systems.
Figure 4.
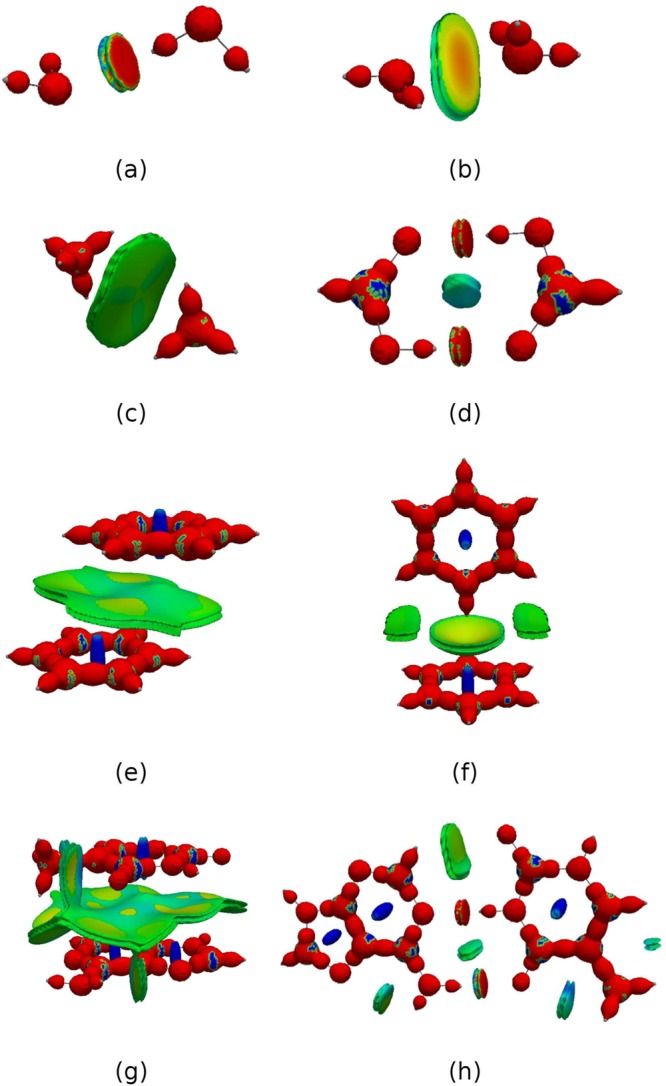
DORI = 0.9 isosurfaces for (a) water dimer, (b) ammonia dimer, (c) methane dimer, (d) formic acid dimer, (e) π-stacked benzene dimer, (f) T-shaped benzene dimer, (g) π-stacked adenine–thymine, (h) hydrogen bonded adenine–thymine. Isosurfaces are color-coded with sgn(λ2)ρ(r) in the range from −0.02 au (red) to 0.02 au (blue).
The interaction regions are detected based on the geometrical deformation of the electron density, discovering where densities of different entities clash in a molecular complex. As a result, π-stacking interactions (e.g., Figure 4e) will typically display larger intermolecular DORI domains than the more localized H-bonds or edge-to-face interactions (e.g., Figure 4f and h). To better understand this size variation, it is instructive to determine how does DORI relate to the shape of the density isocontours and how does the size of DORI domains depend on the distance between interacting species. Figure 5 shows two-dimensional color-coded maps with superimposed electron density isocontours for a water dimer at five intermolecular distances taken from the S22 × 5 set.76
Figure 5.

DORI maps with superimposed electron density isocontours (white lines) for water dimer at (a) 90%, (b) 100%, (c) 120%, (d) 150%, (e) 200% of the equilibrium bond length. Isovalues for density contours are on logarithmic scale. Values in the range from 0 (red) to 1 (blue).
The density isocontours can be divided into two categories: those encompassing only one water molecule and those encompassing the whole dimer. The interacting region (shown in blue/green) coincides with the one where the density isosurfaces of individual molecules collide and merge into a single isosurface. This contact region is characterized by a stronger curvature of isocontours, which is a result of the overlap of densities attributed to distinct molecules. At 90% of the water dimer equilibrium hydrogen bond length (Figure 5a), DORI identifies the region where the density isocontours distort due to the interactions.
At larger bond distances (Figures 5b–e), the merging between the water molecules occurs with contours of lower isovalues, which results in larger contact area. This means that for a given system, the volume of a DORI domain increases with decreasing the interaction strength. From another perspective, DORI identifies where the molecular densities merge into a strongly overlapping supermolecular density irrespective of how large this density is. One should remind, however, that the magnitude and sign of the interactions can be brought by the analysis of sgn(λ2)ρ(r). For the largest distance (Figure 5e), the interaction region splits into two domains due to a numerical artifact, stemming from the finite atomic orbital basis set expansion, which is know to have a nonphysical behavior at density tails.77
5. Illustrative Applications
5.1. Propellanes
DORI is evidently capable of probing covalent bonds and noncovalent interactions, but how does it perform for cases where the existence of a bond is ambiguous? Propellanes are good examples of such situations. The character of the so-called inverted C–C bond between bridgehead carbon atoms has been investigated with various methodologies,27,78−86 including analysis of experimental densities.87,88 The general agreement is that this bridgehead bond exhibits some degree of covalency in small propellanes although the pure covalent bond is only achieved in [2.2.2]-propellane. The conceptual explanations for the peculiar nature of the bond in the smallest [1.1.1]-propellane are specific to the employed method. For instance, the valence bond (VB) analysis85,86 uses the “charge-shift” bond terminology due to a dominant energy contribution coming from the covalent-ionic resonance structures. On the other hand, the analysis of the deformation density and entropy displacement83 leads to an interpretation in terms of “through-bridge” interaction, whereas “through-space” interactions are considered as more important in larger propellanes. This incoherent description and terminology results in an apparent controversy in the interpretation of the nature of the central bond.
The unusual character of the inverted bond in [1.1.1]-propellane can be traced back to the unique properties of cyclopropane. The smallest cycloalkane has a Baeyer strain far lower than expected based simply on angle deformation.89 This unexpected stability was originally attributed to σ-aromaticity,90 although most recent interpretations re-emphasize alternative electronic effects such as rehybridization and strong geminal hyperconjugation (see refs (16, 91, and 92)). While the strain affects mostly the energy, electronic effects manifest themselves in qualitative properties of the wave function and the density. It is therefore not surprising that three fused cyclopropane rings with a relatively short inverted bridgehead–bridgehead bond (ca. 1.60 Å93) such as in [1.1.1]-propellane may results in exceptional type of interactions. DORI is specifically devised to reveal information on electron density overlaps and is hence well suited to analyze the interacting region. In contrast to the deformation densities, DORI is achieved without referring to promolecular densities.
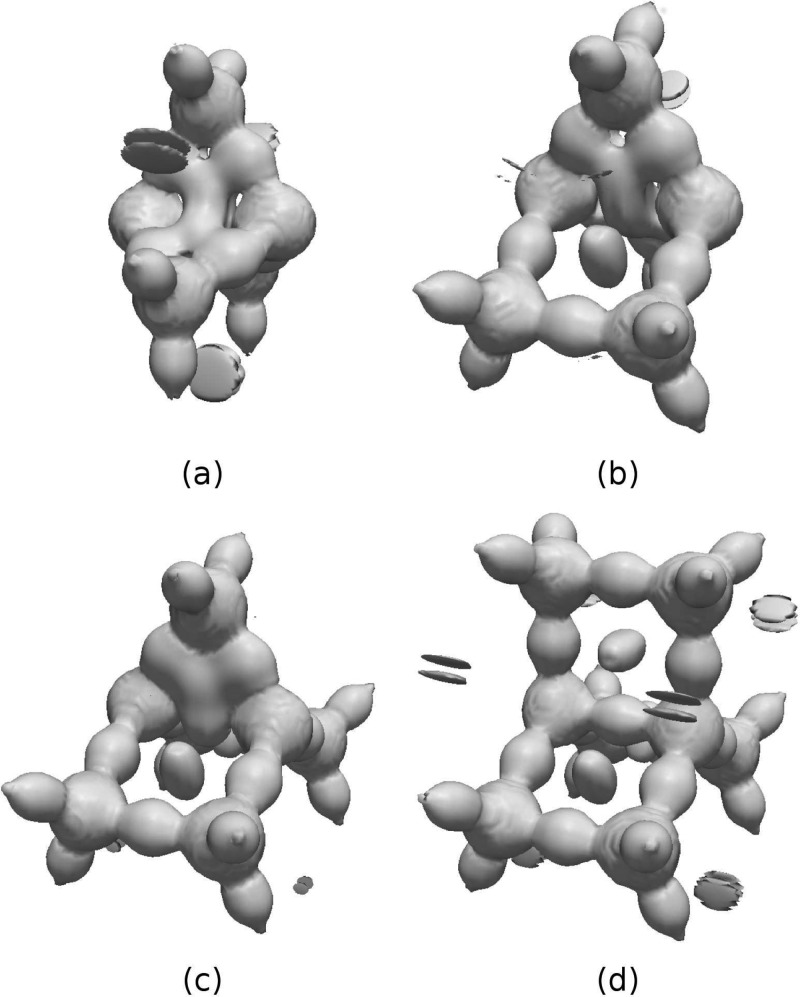
Figure 6 shows color-coded maps for [1.1.1]-, [2.1.1]-, [2.2.1]-, and [2.2.2]-propellanes. Each cut-plane contains one of the three rings of a given propellane. The planes for both the three- and four-membered rings are represented for [2.1.1]- and [2.2.1]-propellanes. In [1.1.1]-propellane, the interaction between bridgehead carbons is clearly different from the other covalent C–C bonds (Figure 6a). The bonding region does not connect the two carbons directly but merges with the two other bonds through the ring center. The feature occurs for all the three-membered rings as well as for the four-membered rings of [2.1.1]-propellane (Figure 6b,c). In contrast, the bridgehead C–C bonds of the four-membered rings in the larger [2.2.1] and [2,2,2] polycyclic analogues are separated from the DORI domain at the ring center akin to rest of the bonds.
Figure 6.
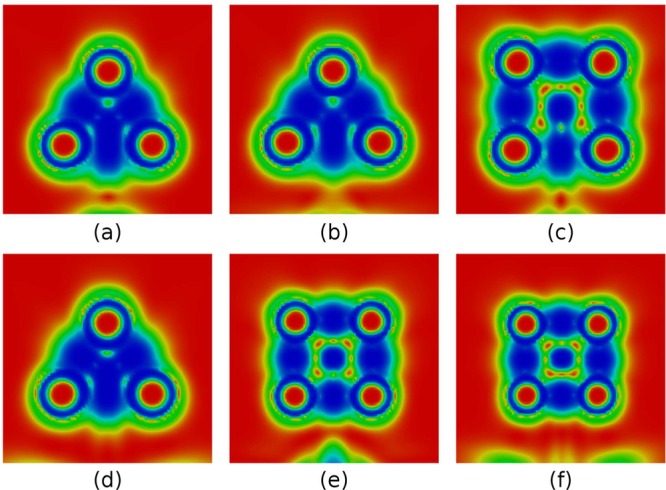
DORI maps for (a) [1.1.1]-propellane, (b) [2.1.1]-propellane (three-carbon ring plane), (c) [2.1.1]-propellane (four-carbon ring plane), (d) [2.2.1]-propellane (three-carbon ring plane), (e) [2.2.1]-propellane (four-carbon ring plane), (f) [2.2.2]-propellane. Values in the range from 0 (red) to 1 (blue).
The DORI isosurfaces given in Figure 7 help connecting the local character of the central bond with the overall bonding pattern of the same propellane series. They reveal a bonding domain delocalized among the three rings in the smallest system, which contrasts with [2.2.2]-propellane that shows 2c-2e covalent bonds only. [2.1.1]- and [2.2.1]-propellanes represent intermediate situations in which the 2c–2e bonding pattern is gradually strengthened through the substitution of a three- by a four-membered ring. The consideration of the combined DORI-Laplacian analysis (Figure 8) further amplifies and clarifies this contrast between the large and small polycyclic systems: the interaction between bridgehead atoms in [1.1.1]- and [2.1.1]-propellanes (Figures 8a, b) is noncovalent (blue, ▽2ρ(r) > 0), whereas, the red ▽2ρ(r) < 0 zone in [2.2.2]-propellane indicates covalence (Figure 8d). In line with other investigations, the DORI analysis distinguishes between the classical 2c-2e C–C bond between bridgehead carbon atoms of large propellane and the atypical noncovalent interactions characteristics of [1.1.1]-propellane. It is important to stress that the seemingly delocalized pattern of the latter is not reflective of a three-dimensional σ- delocalization but rather of a noncovalent interaction resembling a steric clash imposed by the small triangular framework.
Figure 7.
DORI = 0.9 isosurfaces for (a) [1.1.1]-propellane, (b) [2.1.1]-propellane, (c) [2.2.1]-propellane, (d) [2.2.2]-propellane.
Figure 8.
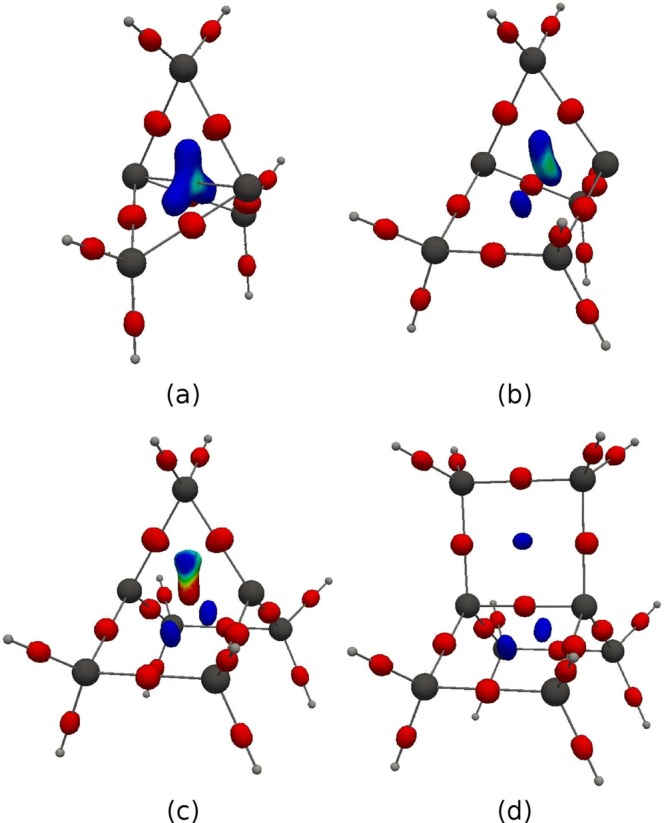
DORI = 0.995 isosurfaces for (a) [1.1.1]-propellane, (b) [2.1.1]-propellane, (c) [2.2.1]-propellane, (d) [2.2.2]-propellane, with color-coded ▽2ρ(r) in the range from −0.1 au (red) to 0.1 au (blue).
5.2. Compactness in Supramolecular Chemistry: Quaterthiophene Derivatives Case
Noncovalent interactions govern various structural and energetic phenomena in biology, chemistry, and materials science. A highly relevant example is the performance of organic electronic devices, which depends strongly on the supramolecular organization of the π-conjugated units. On this basis, we now push applications of DORI one step forward and draw a quantitative relationship between the mutual arrangement of oligothiophene derivatives in the condensed phase and charge mobility.
Charge transport in organic semiconductors relies upon numerous factors, including nuclear dynamics and reorganization energy with the main prerequisite being a large π-electron overlap.94 A practical means to enhance charge carrier mobility is to design molecular crystals in which constituent units are more densely packed.95 This compactness paradigm is driven by the relationship between increased molecular compactness and electronic coupling.
While compactness is easily defined in terms of unit cell size or more generally, in terms of atom pairwise distances, its electronic implication is not as straightforward. Surely, more compact materials exhibit larger overlap of electron densities but there is no unique way to quantify, visualize and validate this assumption. Since the electron overlap is the major factor influencing semiconducting properties, it would be useful to exploit DORI as a direct measure of “electronic compactness”.
A well-suited application is to compare the compactness of bare quaterthiophene molecules in a unit cell with that of quaterthiophene substituted with terminal hydrogen-bonded side groups. As recently demonstrated,96 the realization of unprecedented motifs that include terminal acetamide functions offers the possibility of intermolecular NH···O=C hydrogen-bonding. The hydrogen-bonded acetamides provide an ideal way to guide crystallization and improve the performance of π-type organic semiconductors through the reinforcement of π- stacking and edge-to-face interactions. The crystalline quaterthiophene diacetamide is believed to exhibit denser packing compared to bare quaterthiophene crystal structure. In fact, the reported volume of a quaterthiophene diacetamide unit cell is 291 Å3, which is noticeably smaller than for α-quaterthiophene (307 Å3), α,ω-dimethylquaterthiophene (297 Å3) and α,ω-dihexylquaterthiophene (307 Å3). It was proven experimentally that the apparent denser atomic packing results in enhanced field-effect mobility.
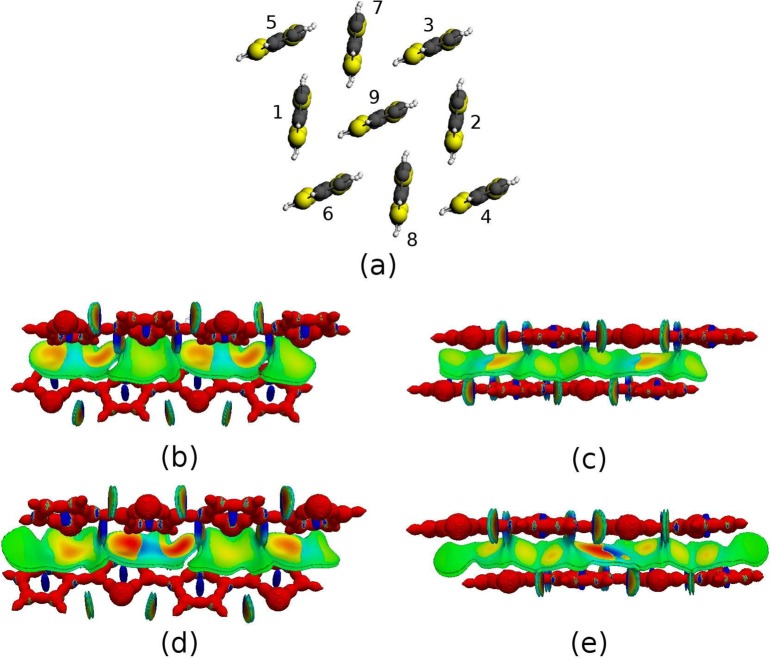
Thus, DORI will serve to visualize and compare the strength of the electron density overlap between neighboring molecules in individual crystals. DORI was computed for all nearest-neighbor dimers in a unit cell of quaterthiophene diacetamide, α-quaterthiophene, α,ω-dimethylquaterthiophene, and α,ω-dihexylquaterthiophene. Since, the charge transport properties depend upon the coupling of π-electrons between the thiophene moieties, the side chains were replaced by hydrogen atoms in order to ensure that only the overlap between quaterhiophene cores’ densities was probed. The X-ray structures were taken from ref (96), and the positions of the hydrogen atoms were optimized computationally for a single unit cell. Figure 9a displays a unit cell of the quaterthiophene diacetamide without the terminal chains. The molecular labeling is used consistently for all the quaterthiophene derivatives. Note that the only important structural difference between the investigated crystals is the symmetry breaking occurring in the presence of hydrogen bonds, which results in symmetry distinct (1–7, 6–9) and (1–9, 8–9) dimer pairs in quatertiophene diacetamide. The latter crystallizes in the triclinic P-1 instead of monoclinic or orthorhombic space group.
Figure 9.
(a) Structure of a unit cell of the quatertiophene diacetamide; DORI = 0.9 isosurfaces for (b) 1–9, (c) 6–9, α-quaterthiophene dimer, and (d) 1–9, e) 6–9, quaterthiophene diacetamide dimer. Isosurfaces are color-coded with sgn(λ2)ρ(r) in the range from −0.01 au (red) to 0.01 au (blue).
Figures 9b–e display DORI = 0.9 isosurfaces for 1–9 and 6–9 dimers of α-quatherthiophene and quaterthiophene diacetamide. Color-coded sgn(λ2)ρ(r) is visible on the surfaces. For each of the dimers, DORI visualizes four types of interactions: covalent bonds, steric clashes at the thiophene ring centers, intramolecular noncovalent interactions between the sulfur and hydrogen atoms and the intermolecular interactions between the quaterthiophene units, which are most relevant to the present purpose. A clear manifestation of electronic compactness is that the DORI domains associated with intermolecular interactions are affected by the mutual arrangement of the aromatic cores. Even though the changes are subtle, a close inspection reveals that the domains become more elongated in quaterthiophene diacetamide. Furthermore, due to the shorter intermolecular distances, a larger number of sulfur–hydrogen domains merge with those arising from intermolecular interactions at the chosen isovalue. Finally, the enhanced compactness of the diacetamide-containing crystal is also noticeable by the more intense coloring of the respective DORI isosurfaces.
These visual indicators are a direct consequence of a stronger density overlap. However, the electronic overlap between quaterthiophene units can be placed on a more quantitative ground by exploiting the intermolecular regions identified by DORI. The integral of the density over this interaction region gives the number of overlapping electrons. Obviously, the choice of the isovalue for the surface enclosing the integration volume is arbitrary, but for a fixed and carefully chosen value the overlap between analogous dimers in the crystal lattice can be directly compared. Since the intermolecular interaction region may merge with other domains representing intramolecular interactions, the isovalue should be either large enough to fully disconnect the distinct domains or relatively small to account for the same interactions in all the systems. We have investigated both options, setting the isovalues to DORI = 0.8 and DORI = 0.95, which fulfilled the above-mentioned conditions.
We define a DORI-based compactness index for the systems under investigation as an integral of the electron density over the intermolecular interaction region determined by a DORI isosurface
| 4 |
This concept is general and can serve to quantify overlap effects between any two fragments as long as the isovalue is chosen in a way that produces well-separated domains. It is important to stress that the DORI-based compactness carries different information than the volume of a unit cell, which, unlike the present index, also reflects the volume of the terminal chains.
The computed integrals are given in Tables 1 and 2. For the quaterthiophene diacetamide, they are consistently larger than those of other quaterthiophenes, irrespective of the chosen isovalue and of the dimer considered. This strongly indicates that insertion of hydrogen-bonded substituents leads to enhanced density overlap that is at the origin of the measured increased field-effect mobility. More subtle effects such as the symmetry breaking expected for the dimer pairs (1–9, 8–9) and (6–9, 1–7) or the relative ordering of the three other quatertiophene crystals are difficult to capture and, consequently, rely more upon the chosen DORI isovalue. The consideration of two distinct isovalues is thus generally recommended but one expects that meaningful differences in density overlap should lead to robust trends independent of the chosen isovalue.
Table 1. Electron Density Integrals Over VintDORI=0.8 Intermolecular Interaction Domains.
| system | dimer 1–9 | dimer 8–9 | dimer 6–9 | dimer 1–7 |
|---|---|---|---|---|
| α-quaterthiophene | 1.07 | 1.07 | 0.78 | 0.78 |
| α,ω-dimethylquaterthiophene | 1.12 | 1.12 | 0.80 | 0.80 |
| α,ω-dihexylquaterthiophene | 1.03 | 1.03 | 0.77 | 0.77 |
| quaterthiophene diacetamide | 1.31 | 1.31 | 0.85 | 0.84 |
Table 2. Electron Density Integrals Over VintDORI=0.95 Intermolecular Interaction Domains.
| system | dimer 1–9 | dimer 8–9 | dimer 6–9 | dimer 1–7 |
|---|---|---|---|---|
| α-quaterthiophene | 0.20 | 0.20 | 0.12 | 0.12 |
| α,ω-dimethylquaterthiophene | 0.23 | 0.23 | 0.13 | 0.13 |
| α,ω-dihexylquaterthiophene | 0.23 | 0.23 | 0.12 | 0.12 |
| quaterthiophene diacetamide | 0.26 | 0.24 | 0.18 | 0.21 |
6. Conclusions
In this work, we introduced a density-dependent scalar field designed to simultaneously identify covalent and noncovalent interactions in molecular systems. The proposed quantity, DORI, is a modification of a previously introduced SEDD detector,31,32,50 which uses a different reference to obtain the dimensionless quantity. This modification results in appealing properties enabling the use of DORI as a universal indicator of intra- and intermolecular interactions.
DORI carries information about regions in space where the total density arises from a strong overlap of individual atomic or molecular densities. As such, it should be seen as a scalar field discovering particular geometrical features of the density, which can be rationalized in terms of local wavenumber. The analytical properties ensure that DORI is a versatile tool to study bonding patterns and to visualize myriad intra- and intermolecular interactions, understood as regions of large density deformations. The combination of DORI with the analysis of the quantity sgn(λ2)ρ(r) allows for further differentiations between bonding and nonbonding interactions and for an estimate of their magnitude.
The utility of DORI was illustrated on various intramolecular phenomena involving visualization of covalent bonding patterns, steric clashes as well as of typical noncovalent interactions occurring between and within molecules. The analysis has also been exploited to visualize and quantify the concept of electronic compactness in supramolecular chemistry. Our approach can probe compactness not in terms of nuclear arrangement but rather in terms of overlap of electron densities. The capability of the index was demonstrated on a quaterthiophene derivative designed to crystallize in denser packing environment and exhibit better charge transport properties.
Several attractive features distinguish DORI from other bonding detectors. First the introduced scalar field depends only on the electron density; thus, it is well-defined at any level of theory. In particular, the DORI analysis is easily applicable to densities obtained from post-Hartree–Fock methods, orbital-free approaches as well as to experimental densities. Second, the values of the descriptor are system-independent. Due to the effective [0–1] mapping, bonding patterns and noncovalent interactions can simultaneously be visualized on equal footing for every system. Finally, the ability of DORI to reveal the local character of electron density is also a promising prerequisite for its use in the development of approximate density functionals.
Acknowledgments
Funding from EPFL, from the European Research Council (ERC Grants 306528, COMPOREL) and from the Swiss NSF Grant no. 200021_137529 is gratefully acknowledged. We thank Prof. Holger Frauenrath and his group members for their inspiring experimental work on quaterthiophene diacetamide.
Supporting Information Available
Expansion of equations in the form explicitly dependent on electron density derivatives. This material is available free of charge via the Internet at http://pubs.acs.org/.
The authors declare no competing financial interest.
Supplementary Material
References
- Schleyer P. v. R. Chem. Rev. 2005, 105, 3433–3435. [Google Scholar]
- Popelier P. L. A. Faraday Discuss. 2007, 135, 3–5. [Google Scholar]
- Alabugin I. V.; Gilmore K. M.; Peterson P. W. Wiley Interdiscip. Rev. Comput. Mol. Sci. 2011, 1, 109–141. [Google Scholar]
- Gonthier J. F.; Steinmann S. N.; Wodrich M. D.; Corminboeuf C. Chem. Soc. Rev. 2012, 41, 4671–4687. [DOI] [PubMed] [Google Scholar]
- Boys S. F. Rev. Mod. Phys. 1960, 32, 296. [Google Scholar]
- Edmiston C.; Ruedenberg K. Rev. Mod. Phys. 1963, 35, 457. [Google Scholar]
- Pipek J.; Mezey P. G. J. Chem. Phys. 1989, 90, 4916. [Google Scholar]
- Subotnik J. E.; Dutoi A. D.; Head-Gordon M. J. Chem. Phys. 2005, 123, 114108. [DOI] [PubMed] [Google Scholar]
- Auqilante F.; Pedersen T. B.; de Merás A. S.; Koch H. J. Chem. Phys. 2006, 125, 174101. [DOI] [PubMed] [Google Scholar]
- Jansík B.; Høst S.; Kristensen K.; Jørgensen P. J. Chem. Phys. 2011, 134, 194104. [DOI] [PubMed] [Google Scholar]
- de Silva P.; Giebułtowski M.; Korchowiec J. Phys. Chem. Chem. Phys. 2012, 14, 546–552. [DOI] [PubMed] [Google Scholar]
- de Silva P.; Makowski M.; Korchowiec J. Chimia 2012, 66, 178–181. [DOI] [PubMed] [Google Scholar]
- Høyvik I.-M.; Jansik B.; Jørgensen P. J. Chem. Phys. 2012, 137, 224114. [DOI] [PubMed] [Google Scholar]
- Høyvik I.; Jansik B.; Jørgensen P. J. Comput. Chem. 2013, 34, 1456–1462. [DOI] [PubMed] [Google Scholar]
- Foster J.; Weinhold F. J. Am. Chem. Soc. 1980, 102, 7211–7218. [Google Scholar]
- Reed A. E.; Curtiss L. A.; Weinhold F. Chem. Rev. 1988, 88, 899–926. [Google Scholar]
- Zubarev D. Y.; Boldyrev A. I. Phys. Chem. Chem. Phys. 2008, 10, 5207–5217. [DOI] [PubMed] [Google Scholar]
- Zubarev D. Y.; Boldyrev A. I. J. Org. Chem. 2008, 73, 9251–9258. [DOI] [PubMed] [Google Scholar]
- Becke A. D.; Edgecombe K. E. J. Chem. Phys. 1990, 92, 5397. [Google Scholar]
- Savin A.; Nesper R.; Wengert S.; Fässler T. F. Angew. Chem., Int. Ed. Engl. 1997, 36, 1808–1832. [Google Scholar]
- Savin A.; Becke A.; Flad J.; Nesper R.; Preuss H.; Von Schnering H. Angew. Chem., Int. Ed. Engl. 1991, 30, 409–412. [Google Scholar]
- Schmider H.; Becke A. J. Mol. Struct.: THEOCHEM 2000, 527, 51–61. [Google Scholar]
- Schmider H. L.; Becke A. D. J. Chem. Phys. 2002, 116, 3184–3193. [Google Scholar]
- Kohout M. Int. J. Quantum Chem. 2004, 97, 651–658. [Google Scholar]
- Kohout M.; Pernal K.; Wagner F. R.; Grin Y. Theor. Chem. Acc. 2004, 112, 453–459. [Google Scholar]
- Kohout M.; Pernal K.; Wagner F.; Grin Y. Theor. Chem. Acc. 2005, 113, 287–293. [Google Scholar]
- Nalewajski R. F.; de Silva P.; Mrozek J. J. Mol. Struct.: THEOCHEM 2010, 954, 57–74. [Google Scholar]
- Nalewajski R. F.; de Silva P.; Mrozek J. In Theoretical and Computational Developments in Modern Density Functional Theory; Roy A., Ed.; Nova Science Publishers, Inc., 2012; pp 561–587. [Google Scholar]
- Bohórquez H. J.; Boyd R. J. Theor. Chem. Acc. 2010, 127, 393–400. [Google Scholar]
- Bohórquez H. J.; Matta C. F.; Boyd R. J. Int. J. Quantum Chem. 2010, 110, 2418–2425. [Google Scholar]
- de Silva P.; Korchowiec J.; Wesolowski T. A. ChemPhysChem 2012, 13, 3462–3465. [DOI] [PubMed] [Google Scholar]
- de Silva P.; Korchowiec J.; Ram J. S N.; Wesolowski T. A. Chimia 2013, 67, 253–256. [DOI] [PubMed] [Google Scholar]
- Bader R. F.Atoms in Molecules: A Quantum Theory; Oxford University Press, 1994. [Google Scholar]
- Bader R. F. Chem. Rev. 1991, 91, 893–928. [Google Scholar]
- Bader R.; MacDougall P.; Lau C. J. Am. Chem. Soc. 1984, 106, 1594–1605. [Google Scholar]
- Bader R.; Slee T.; Cremer D.; Kraka E. J. Am. Chem. Soc. 1983, 105, 5061–5068. [Google Scholar]
- Jenkins S. J. Phys.: Condens. Matter 2002, 14, 10251. [Google Scholar]
- Jenkins S.; Ayers P. W.; Kirk S. R.; Mori-Sánchez P.; Martn Pendás A. Chem. Phys. Lett. 2009, 471, 174–177. [Google Scholar]
- Seriani N. J. Phys.: Condens. Matter 2010, 22, 255502. [DOI] [PubMed] [Google Scholar]
- Koritsanszky T. S.; Coppens P. Chem. Rev. 2001, 101, 1583–1628. [DOI] [PubMed] [Google Scholar]
- Espinosa E.; Molins E.; Lecomte C. Chem. Phys. Lett. 1998, 285, 170–173. [Google Scholar]
- Volkov A.; Gatti C.; Abramov Y.; Coppens P. Acta Crystallogr., Sect. A 2000, 56, 252–258. [DOI] [PubMed] [Google Scholar]
- Tsirelson V.; Stash A. Chem. Phys. Lett. 2002, 351, 142–148. [Google Scholar]
- Tsirelson V.; Stash A. Acta Crystallogr. Sect. B 2002, 58, 780–785. [DOI] [PubMed] [Google Scholar]
- Johnson E. R.; Keinan S.; Mori-Sanchez P.; Contreras-García J.; Cohen A. J.; Yang W. J. Am. Chem. Soc. 2010, 132, 6498–6506. [DOI] [PMC free article] [PubMed] [Google Scholar]
- Contreras-García J.; Johnson E. R.; Keinan S.; Chaudret R.; Piquemal J.-P.; Beratan D. N.; Yang W. J. Chem. Theory Comput. 2011, 7, 625–632. [DOI] [PMC free article] [PubMed] [Google Scholar]
- Saleh G.; Gatti C.; Lo Presti L.; Contreras-García J. Chem.—Eur. J. 2012, 18, 15523–15536. [DOI] [PubMed] [Google Scholar]
- Gillet N.; Chaudret R.; Contreras-García Ì.; Yang W.; Silvi B.; Piquemal J.-P. J. Chem. Theory Comput. 2012, 8, 3993–3997. [DOI] [PMC free article] [PubMed] [Google Scholar]
- Fang D.; Chaudret R.; Piquemal J.-P.; Cisneros G. A. J. Chem. Theory Comput. 2013, 9, 2156–2160. [DOI] [PubMed] [Google Scholar]
- de Silva P.; Korchowiec J.; Wesolowski T. A. J. Chem. Phys. 2014, 140, 164301. [DOI] [PubMed] [Google Scholar]
- Nagy A.; March N. Mol. Phys. 1997, 90, 271–276. [Google Scholar]
- Bohórquez H. J.; Boyd R. J. J. Chem. Phys. 2008, 129, 024110. [DOI] [PubMed] [Google Scholar]
- Nagy A.; Liu S. Phys. Lett. A 2008, 372, 1654–1656. [Google Scholar]
- Cohen L. J. Chem. Phys. 1979, 70, 788–789. [Google Scholar]
- Cohen L. J. Chem. Phys. 1984, 80, 4277–4279. [Google Scholar]
- Ayers P. W.; Parr R. G.; Nagy A. Int. J. Quantum Chem. 2002, 90, 309–326. [Google Scholar]
- Anderson J. S.; Ayers P. W.; Hernandez J. I. R. J. Phys. Chem. A 2010, 114, 8884–8895. [DOI] [PubMed] [Google Scholar]
- Kato T. Commun. Pure Appl. Math. 1957, 10, 151–177. [Google Scholar]
- Morrell M. M.; Parr R. G.; Levy M. J. Chem. Phys. 1975, 62, 549. [Google Scholar]
- Wang W.-P.; Parr R. G. Phys. Rev. A 1977, 16, 891. [Google Scholar]
- Kohout M.; Savin A.; Preuss H. J. Chem. Phys. 1991, 95, 1928–1942. [Google Scholar]
- Sperber G. Int. J. Quantum Chem. 1971, 5, 189–214. [Google Scholar]
- Te Velde G.; Bickelhaupt F. M.; Baerends E. J.; Fonseca Guerra C.; van Gisbergen S. J.; Snijders J. G.; Ziegler T. J. Comput. Chem. 2001, 22, 931–967. [Google Scholar]
- Kohout M. DGrid, version 4.6, Radebeul. 2011.
- Henderson A.; Ahrens J.; Law C.. The ParaView Guide; Kitware Clifton Park, NY, 2004. [Google Scholar]
- Forslund L. E.; Kaltsoyannis N. New J. Chem. 2003, 27, 1108–1114. [Google Scholar]
- Politzer P.; Grice M. E.; Murray J. S.; Seminario J. M. Can. J. Chem. 1993, 71, 1123–1127. [Google Scholar]
- Mo Y.; Schleyer P. v. R. Chem.—Eur. J. 2006, 12, 2009–2020.16342222 [Google Scholar]
- Wu J. I.; Mo Y.; Evangelista F. A.; von Ragué Schleyer P. Chem. Commun. 2012, 48, 8437–8439. [DOI] [PubMed] [Google Scholar]
- Bader R. J. Chem. Phys. 1980, 73, 2871–2883. [Google Scholar]
- Tao J.; Vignale G.; Tokatly I. Phys. Rev. Lett. 2008, 100, 206405. [DOI] [PubMed] [Google Scholar]
- Tachibana A. J. Mol. Struct.: THEOCHEM 2010, 943, 138–151. [Google Scholar]
- Guevara-García A.; Echegaray E.; Toro-Labbe A.; Jenkins S.; Kirk S. R.; Ayers P. W. J. Chem. Phys. 2011, 134, 234106. [DOI] [PubMed] [Google Scholar]
- Jenkins S.; Kirk S. R.; Guevara-García A.; Ayers P. W.; Echegaray E.; Toro-Labbe A. Chem. Phys. Lett. 2011, 510, 18–20. [DOI] [PubMed] [Google Scholar]
- Jurec̆ka P.; Šponer J.; C̆ernỳ J.; Hobza P. Phys. Chem. Chem. Phys. 2006, 8, 1985–1993. [DOI] [PubMed] [Google Scholar]
- Gráfová L.; Pitonák M.; Rezac J.; Hobza P. J. Chem. Theory Comput. 2010, 6, 2365–2376. [DOI] [PubMed] [Google Scholar]
- de Silva P.; Wesolowski T. A. Phys. Rev. A 2012, 85, 032518. [Google Scholar]
- Jackson J. E.; Allen L. C. J. Am. Chem. Soc. 1984, 106, 591–599. [Google Scholar]
- Wiberg K. B.; Bader R. F.; Lau C. D. J. Am. Chem. Soc. 1987, 109, 985–1001. [Google Scholar]
- Kar T.; Jug K. Chem. Phys. Lett. 1996, 256, 201–206. [Google Scholar]
- Adcock W.; Brunger M.; Clark C.; McCarthy I.; Michalewicz M.; Von Niessen W.; Weigold E.; Winkler D. J. Am. Chem. Soc. 1997, 119, 2896–2904. [Google Scholar]
- Ebrahimi A.; Deyhimi F.; Roohi H. J. Mol. Struct.: THEOCHEM 2003, 626, 223–229. [Google Scholar]
- Nalewajski R. F.; Broniatowska E. J. Phys. Chem. A 2003, 107, 6270–6280. [Google Scholar]
- Polo V.; Andres J.; Silvi B. J. Comput. Chem. 2007, 28, 857–864. [DOI] [PubMed] [Google Scholar]
- Wu W.; Gu J.; Song J.; Shaik S.; Hiberty P. C. Angew. Chem., Int. Ed. Engl. 2009, 121, 1435–1438. [DOI] [PubMed] [Google Scholar]
- Shaik S.; Chen Z.; Wu W.; Stanger A.; Danovich D.; Hiberty P. C. ChemPhysChem 2009, 10, 2658–2669. [DOI] [PubMed] [Google Scholar]
- Seiler P.; Belzner J.; Bunz U.; Szeimies G. Helv. Chim. Acta 1988, 71, 2100–2110. [Google Scholar]
- Messerschmidt M.; Scheins S.; Grubert L.; Pätzel M.; Szeimies G.; Paulmann C.; Luger P. Angew. Chem., Int. Ed. Engl. 2005, 44, 3925–3928. [DOI] [PubMed] [Google Scholar]
- Schleyer P. v. R.; McKee W. C. J. Phys. Chem. A 2010, 114, 3737–3740. [Google Scholar]
- Dewar M. J. Bull. Soc. Chim. Belg. 1979, 88, 957–967. [Google Scholar]
- Wu W.; Ma B.; Wu J. I.; von Ragué Schleyer P.; Mo Y. Chem.—Eur. J. 2009, 15, 9730–9736. [DOI] [PubMed] [Google Scholar]
- Wu J. I.; von Ragué Schleyer P.. Pure Appl. Chem. 2013, 85.
- Wiberg K. B.; Dailey W. P.; Walker F. H.; Waddell S. T.; Crocker L. S.; Newton M. J. Am. Chem. Soc. 1985, 107, 7247–7257. [Google Scholar]
- Coropceanu V.; Cornil J.; da Silva Filho D. A.; Olivier Y.; Silbey R.; Brédas J.-L. Chem. Rev. 2007, 107, 926–952. [DOI] [PubMed] [Google Scholar]
- Brédas J.-L.; Calbert J. P.; da Silva Filho D.; Cornil J. Proc. Natl. Acad. Sci. U.S.A. 2002, 99, 5804–5809. [DOI] [PMC free article] [PubMed] [Google Scholar]
- Gebers J.; Hartmann L.; Schaer M.; Suàrez S.; Bugnon P.; Steinrück H.-G.; Magerl A.; Brinkmann M.; Petraglia R.; Corminboeuf C.; Frauenrath H. (submitted) 2014,.
Associated Data
This section collects any data citations, data availability statements, or supplementary materials included in this article.


