Abstract
In this study a UPLC-tandem (Waters Xevo TQ) MRM based MS method was developed for rapid, broad profiling of hydrophilic metabolites from biological samples, in either positive or negative ion modes without the need for an ion pairing reagent, using a reversed-phase pentafluorophenylpropyl (PFPP) column. The developed method was successfully applied to analyze various biological samples from C57BL/6 mice; including urine, duodenum, liver, plasma, kidney, heart, and skeletal muscle. As result, a total 112 of hydrophilic metabolites were detected within 8 min of running time to obtain a metabolite profile of the biological samples. The analysis of this number of hydrophilic metabolites is significantly faster than previous studies. Classification separation for metabolites from different tissues was globally analyzed by PCA, PLS-DA and HCA biostatistical methods. Overall, most of the hydrophilic metabolites were found to have a “fingerprint” characteristic of tissue dependency. In general, a higher level of most metabolites was found in urine, duodenum and kidney. Altogether, these results suggest that this method has potential application for targeted metabolomic analyzes of hydrophilic metabolites in a wide ranges of biological samples.
Keywords: metabolomics, metabolic networks, metabolic complexity, hydrophilic metabolites, LC/MS, MRM, reversed-phase HPLC, C57BL/6 mice
Introduction
Metabolomics is the “systematic study of the unique chemical fingerprints that specific cellular processes leave behind”-specifically, the study of their small -molecule metabolite profiles [1]. The metabolome represents an instantaneous snapshot of the physiology and pathology of a biological sample, as it is the collection of all metabolites in a biological cell, tissue, organ, organism or biofluids [2]. There is still a need have a rapid broad based metabolomic profiling platform that accurately reflects the metabolic complexity seen in the tissues primarily used for metabolomic analyses. Comparative analyses of metabolic profiles are extremely useful to phenotype the physiological and pathological conditions induced by diseases, drug, food, environments, aging, strains, and genotypes [3–6]. Currently, two strategies in metabolomics/biomarker studies (targeted and non-targeted metabolite profiling) are widely used for analyzing metabolites [7–9]. In general, when using LC methods for targeting a more limited number of metabolite biomarkers, triple quadrapole (TQ) tandem mass spectrometry (MS) operating in multiple reaction monitoring (MRM) mode may be a preferred solution, with high mass-resolution full scan mass spectrometry (FT-ICR, Orbitrap and hybrid quadrapole time of flight (qTOF)) preferred for its potential ability for untargeted metabolite biomarker profiling [8,9]. TQ-MS theoretically, has the highest sensitivity and linearity of LC-MS systems, but has the drawbacks of being able to detect a relatively limited number of known metabolites for which pre-optimization must first be done to find the best MRM signature and collision energies. With the availability of UPLC and fast chromatographic runs, the newest tandem MS systems, such as the Waters Xevo used here, have overcome the need for relatively slow compound elution formerly needed to accommodate a large number of selected reaction monitoring scan events.
In vivo, the hydrophilic metabolites are involved in multiple metabolic pathways, as glycolysis, TCA cycle, pentose phosphate pathway and amino acids [15–17]. Liquid chromatography is well suited to analyze polar, hydrophilic molecules typically encountered in biological samples without the need for prior derivatization [18]. The issue becomes which chromatographic method best allows a broad range of polar metabolites to be quantitatively assessed. Many have found hydrophilic interaction chromatography (HILIC) based methods to have great utility for targeted and untargeted metabolite biomarker profiling (10–12). For example, Bajad et al (10) compared the performance of nine different chromatography approaches involving seven different column chemistries, and identified HILIC on an aminopropyl column as an effective method to separate a broad range of cellular metabolites including amino acids, nucleosides, nucleotides, coenzyme A derivatives, carboxylic acids, and sugar-phosphates. Others have also found hydrophilic compounds are well suited for hydrophilic (HILIC) separation [13,14,27). The use of HILIC overcame difficulties found with early versions of classic reversed-phase column methods, which can have poor performance with polar metabolites, as many polar compounds have poor retention, eluting near the void volume, and highly polar nucleotide triphosphate compounds like ATP do not elute as well defined peaks [10]. However, great improvement for detection of hydrophilic compounds using reversed-phase chromatography has been seen when an amine ion pairing agent is used for separation of a broad range of negatively charged metabolites, including nucleotides, sugar phosphates, and carboxylic acids [7, 10, 19–21]. However, amine ion pairing reagents cause ion suppression in positive mode, leading to cumbersome metablome coverage methods where a reversed-phase ion pairing method is used for the negative ion mode, and a HILIC column is used for the positive ion mode [7, 22, 23].
In this study, we developed a rapid and simple LC/MS-based method on a reversed-phase pentafluorophenylpropyl (PFPP) column, which has been shown better separation than reversed-phase C18 methods, without the need for an ion pairing reagent, but with a comparatively slow elution time (original PFPP paper). This PFPP method was optimized to work in positive and negative ion MRM modes, and allows a rapid profiling of hydrophilic metabolites with high sensitivity and reliable reproducibility for assessment of metabolic complexity in a wide range of biological samples.
Materials and Methods
Reagents
Acetonitrile (HPLC grade), formic acid (HPLC grade) and water (LC/MS grade) were purchased from Fisher Scientific (Fisher Scientific, Pittsburg, PA, USA); the standard compounds of amino acids lysine, valine, proline, alanine, tyrosine, histidine, choline, serine, phenylalaninie was purchased from Fisher (Fisher Scientific, Pittsburg, PA, USA); the standard compounds of lactate, glutamine, glutamate, pyruvate, fumarate, α-ketuglutarate (α-KG), succinate, malate, phosphoenolpyruvate (PEP), glyceraldehyde 3-phosphate (G-3-P), alpha-glycerol phosphate (α-GP), isocitrate, citrate, erythrose 4-phosphate (E-4-P), ribulose 5-phosphate (R-5-P), glucose 6-phosphate (G-6-P), adenosine monophosphate (AMP), adenosine diphosphate (ADP), fructose 1,6-biphosphate (F-1,6-P), Fructose 6-phosphate (F-6-P), reduced glutathione (Gluta-red), oxidized glutathione (Gluta-Oxi) were purchased from Sigma (Sigma-Aldrich Corp., Saint Louis, MO, USA). All other used reagents, such as pH adjusting solution, were all ACS grade reagents.
Animal samples
Animal used in this study were kept in concordance with the USA National Research Council Guidelines and approved by the Subcommittee on Research Animal Care and Laboratory for Animal Resources of the Albert Einstein College of Medicine. Four Mus musculus C57BL/6 male mice (age: 5 weeks, body weight: 20 ± 2 g) were purchased from the Jackson (The Jackson Laboratory, Bar Harbor, ME USA). The animals were housed individually in cages in a well-ventilated room with temperature: 25 ± 2 °C, humidity: 60 ± 5% and a 12 h dark to light cycle. Standard chow diet and water were provided ad libitum. The mice were sacrificed by exsanguination under isoflurane anesthesia. Liver, duodenum, kidney, heart and quadriceps muscles samples were collected and rapidly freeze-clamped, and then kept in liquid nitrogen until extraction. The bladder containing urine and blood samples were collected and immediately spun down to 6500 g at 4 °C, then urine and plasma were transferred to new tubes and kept frozen at −80 °C until processing.
Sample processing
Urine samples were centrifuged to 20000 g at 4 °C for 5 min and the supernatant diluted with 1 vol of water for LC/MS analysis. Plasma samples were prepared by mixing it with 2 vol of acetonitrile, then centrifuged to 20000 g at 4 °C for 5 min and the supernatant was separated for LC/MS analysis. Approximately 100 mg of tissue samples from heart, liver, skeletal muscle, kidney, and duodenum were weighed and placed into a 5 ml of glass tube, then the tissue was homogenized using 1 ml of 50% ice-cold methanol, after that and working in a fume hood 1 ml of chloroform was added and the mix was vortexed by 30 sec and spun down to 6500 g at 4 °C. Following, the supernatant was transferred to a new tube, mixed with 2 vol of acetonitrile, centrifuged to 20000 g at 4 °C for 5 min, and then the supernatant was analyzed by LC/MS.
HPLC/MS
Chromatographic analysis was performed in a Waters Acquity UPLC system (Waters Corp., Milford, MA, USA) using the below indicated columns A flow rate of 0.3 ml/min was used for the pentafluorophenyl columns, 0.2 ml/min for the BEH and amino columns and 10 μl injection volume were used for all cases. The column eluent was directed into the mass spectrometer without split. The columns used in this work were: Discovery HS F5 PFPP (150 mm × 2.1 mm,3 μm particle size) (Sigma -Aldrich Corp., Saint Louis, MI, USA), PFP (150 mm × 2.1 mm, 2.6 μm particle size) (Phenomenex, Torrance, CA, USA), Luna NH2column (150 mm × 1 mm, 3 μm particle size) (Phenomenex, Torrance, CA, USA) and BEH C18(50 mm × 2.1 mm, 1.7 μm particle size) (Waters Corp., Milford, MA, USA). The flow rates and HPLC gradients for distinct columns were accordingly adjusted using the software, Waters UPLC Columns Calculator v1.1.1 (Waters Corp., Milford, MA, USA).
Targeted analysis of metabolites from biological samples was performed using a linear gradient: 0–27% B over 8.0 min (A: 0.1% formic acid in water, pH 4.5; B: 100% acetonitrile). Mass spectrometry detection was performed using a Xevo Triple Quadrupole MS (Waters Corp., Milford, MA, USA) equipped with an electrospray ionization source (ESI) operating simultaneously in positive and negative ionization mode. The desolvation gas flow rate was set to 900 l/h at a temperature of 500 °C, the cone gas flow rate was set at 50 l/h and the source temperature at 150 °C. The capillary voltage was set to 3000 volts for positive ion mode; 2800 volts for negative ion mode; the cone voltage was set depending upon each specific MRM for each metabolite. Data was collected in MRM mode by screening parent and daughter ions simultaneously [10, 11], The dwell time was automatically set by the MassLynx software. By default, a minimum of 12 point per peaks were set to be collected; dwell times were automatically adjusted by the software depending on how many metabolites are being determined at any given time.
Calibration curves
Eight concentrations of mixed standards were prepared by diluting concentrated stock solutions down to 10000, 8000, 5000, 1000, 100, 10, 1, 0.01 ng/ml for glutamine, glutamate, pyruvate, fumarate, α-KG, succinate, malate, PEP, G-3-P, α-GP, isocitrate, citrate, E-4-P, R-5-P, G-6-P, F-1,6-P, F-6-P, Gluta-red and Gluta-Oxi. Dilutions of 500, 400, 250, 50, 5, 0.5, 0.05 and 0.0005 ng/ml were prepared for AMP; 20000, 16000, 10000, 2000, 200, 20, 2, 0.02 ng/ml for ADP; 353, 282.4, 176.5, 35.3, 3.53, 0.353, 0.0353, 0.000353 nmol/mL for lactate; 2500, 1500, 1000, 500, 100, 10, 1, 0. 1 ng/ml for the mix of amino acids. The chromatographic profiles based on the MRM screening mode of each targeted compounds were achieved by injecting 10 μl of each most concentrated of analytes solutions individually. Subsequently, the calibration curve for each targeted compounds were calculated in the software TargetLynx (Waters Corp., Milford, MA, USA) using the individual determinations of each targeted compounds standards. It was illustrated that the linearity of calibration curves is remarkably good for all the targeted compounds and they have ample linear range.
Data processing and statistical analysis
The MS raw data from the biological samples runs was processed by TargetLynx, which integrated the metabolite peaks and generated a peak area list of each metabolite from every sample. The collected data was normalized by the tissue weight or volume of each sample. Furthermore, the normalized data was analyzed by the Ezinfo sub-program from MarkerLynx XS v4.1 (Waters Corp., Milford, MA, USA).
The entire normalized data from all samples was imported into Ezinfo (MarkerLynx) to perform principal components analysis (PCA) and partial least square discriminate analysis (PLS-DA) [24]. Separately, hierarchical clustering analysis (HCA) was also performed by importing the normalized data into Pirouette software (Infometrix, Inc., Bothell, WA, USA) [25]. Using the complete metabolic profiles of the samples, significant differences in the targeted metabolites profiles was observed between the different types of samples. From PCA and PLS-DA analyses scores plots and variable importance plots were calculated. Scores plots showed clustering patterns of the samples based on their metabolite levels in qualitative and quantitative metabolomics data. The separation of clusters from different types of samples clearly reflects the differences in metabolite content from various metabolic pathways. The variable importance plot shows the contribution of each metabolite (biomarkers) in establishing the clustering patterns. Differences in the metabolites levels from different tissues had significant contributions to groups’ classification in the scores plot. Furthermore, the levels of biomarkers is quantitatively characterized by this plotted methods (bar plot). HCA was another multivariate statistical analysis applied that also quantitatively reflected the samples clustering patterns similarly observed with PCA and PLS-DA analyses. The heatmap overview of the data was plotted by using excel function (2007v/QI Macros 2009, Microsoft Corporation, NY, USA)
Results and discussion
Profiling of hydrophilic metabolites is key to the characterization of metabolic complexity that phenotypically describes normal and disease states, or is seen in response to treatment [26]. Both positively and negatively charged hydrophilic metabolites are involved in multiple key metabolic pathways of biological organisms, such as the glycolytic, pentose and TCA pathways, as well as redox and energy charge. A robust profiling method that can assess both these positively and negatively charged hydrophilic metabolites in one rapid run is a primary challenge in analytical method development for metabolomics. A method for comprehensive metabolome coverage must be balanced versus run time and yet achieve robust quantitative performance. Optimization of HPLC column conditions is a vital step during development of LC/MS methodologies to optimally separate metabolites of interest [10, 27, 28]. In this work, various columns have been evaluated using the same type of biological samples. Below the different HPLC columns selected to analyze water soluble metabolites are described.
Phenomenex PFP column (15 cm × 2.1 mm, 2.6 μm particle size). The solvents composition (A: Water with 0.1% formic acid; B: acetonitrile) and chromatographic conditions were based specifications previously described [28]. The Supplemental Figure 1 shows the typical total ion chromatogram (TIC) of several mixed standards profiled by MRM screening mode of UPLC-TQ using this column. The figure illustrate that separation of targeted compounds was non-optimal. Although some of acidic compounds were well profiled based on weak acidic eluent, most compounds could not been validated. Meanwhile, metabolites such as fumarate and pyruvate exhibited non-symmetric peaks, likely attributed to the change pH that can not meet PKa adaption of most of the targeted analytes. When the elution conditions were modified (A: Water/Acetonitrile 95:5 with 20 mM ammonium acetate and 20 mM ammonium hydroxide, pH 9.4–9.6; B: Acetonitrile) [10]. Some compounds peaks gained good shapes; however, the acidic compounds couldn’t be profiled with a basic pH solvent system (Supplemental Figure 2).
Waters BEH C18 (5 cm × 2.1 mm, 1.7 μm particle size). Solvents system (A: water with 0.1% formic acid; B: Acetonitrile) and separation conditions tested were the same described above [28]. The Supplemental Figure 3 shows that α-KG and many other metabolites couldn’t be detected, and the retention times of most compounds revealed that the C18 column has almost no retention capability for typical pentose, glycolytic and TCA metabolites. Therefore, this column can not be used for quantification of most of the targeted metabolites, due to its lack of separation resulting in significant peak interferences.
Phenomenex Luna NH2 column (15 cm × 1 mm, 3 μm particle size). Solvents system (A: Water/Acetonitrile 95:5 with 20 mm ammonium acetate and 20 mm ammonium hydroxide, pH 9.4–9.6; B: Acetonitrile) and separation condition used were previously described [10]. Supplemental Figure 4 illustrates that although some separation for TCA and pentose pathway compounds was achieved, α-KG and other metabolites could not be analyzed at the solvents high pH.
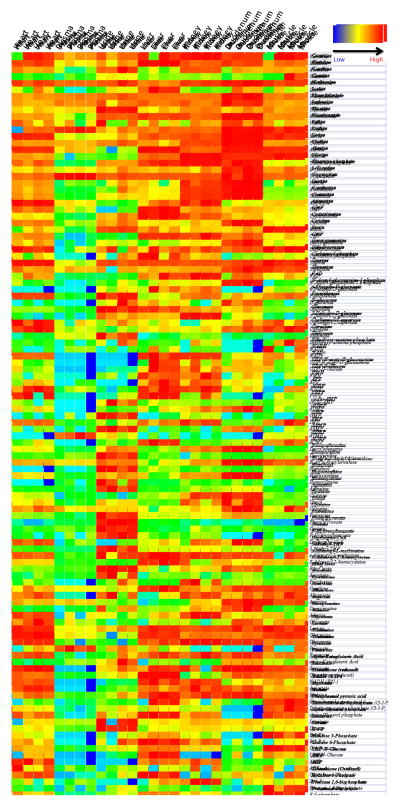
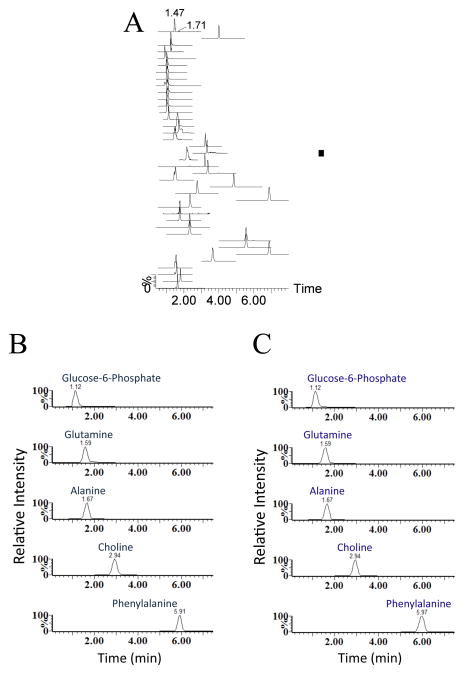
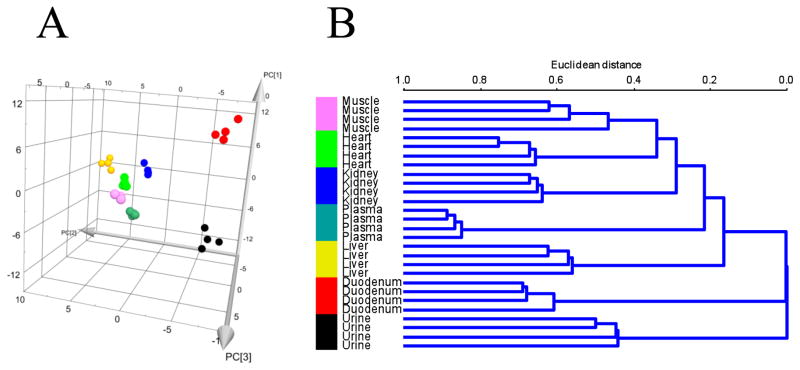
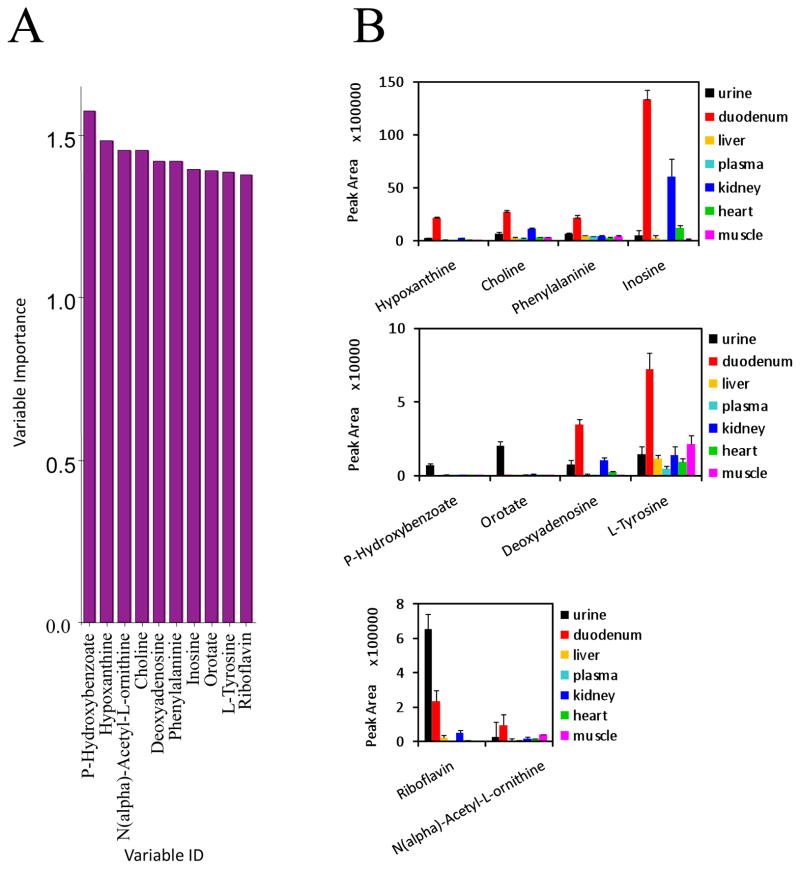
Discovery HS F5 PFPP column (15 cm × 2.1 mm, 3 μm particle size). The solvents and chromatographic conditions evaluated are described in [28]. The use of this column allows an adequate profiling of a total 112 hydrophilic metabolites from their specific MRMs detection methods (Figure 1) [10]. The Discovery HS F5 PFPP column was selected for qualification and quantification of the hydrophilic metabolites from the biological samples, due to its superior separation of metabolites. After testing various solvents systems, 0.1% formic acid versus 100% acetonitrile was found to be the most favorable solvent system. Using this combination of column and solvents, the total ions chromatograms (TIC) of most hydrophilic metabolites by MRM screenings typically showed high separation and excellent peak profiles in both standards (Figure 2A, B) and biological samples (Figure 2C). Furthermore, retention times and peak shapes proved to be very consistent, independent of whether analyzing standards or samples. Altogether, a LC/MS MRM screening method of 112 hydrophilic metabolites was developed and validated on the PFPP column (Fig. 1, Supplemental Table 1). The urine, plasma, heart, liver, skeletal muscle, kidney, and duodenum samples from C57BL/6 mice were subjected to metabolomic profiling analyses using above described LC/MS MRM method utilizing the PFPP column. Metabolite profiles containing 112 hydrophilic components from each of these seven types of biological samples were performed within 8 min, which is much faster than previous reports [7, 10, 11]. Targetlynx was used to integrate and normalize peaks areas of these 112 hydrophilic metabolites from all samples, and the method was characterized for the inter-sample accuracy and precision (Supplemental Table 2). Score plots from PCA analysis of the normalized samples shows that the different types of biological samples clearly cluster separately (Figure 3A). Additionally, the plasma, heart, liver, skeletal muscle and kidney clusters are relatively close together, and far away from the urine and duodenum groups. The cluster arrangement is reflects the higher normalized levels of metabolites in these last two types of biological samples. In addition, the clustering of these data by hierarchical analysis confirmed the principal component analysis results (Figure 3B). The variable importance plot obtained revealed that are many metabolites significantly contributing to the cluster separation, reflecting the metabolic complexity of these different sample types (Supplemental Figure 5). The first 10 most important metabolites that contribute to the sample type distinction are shown in the Figure 4A, and the relative levels from the different types of samples is appreciated in Figure 4B. It appears that there is a common pattern for urine, kidney, duodenum samples, as these tissues contain higher levels of metabolites that contribute greatly to the distinct clustering of these samples. A total of 30 from the 112 targeted metabolites were completely quantified, based on the use of standard curves.
Figure 1.
Heat map illustrating levels of 112 metabolites found in heart, liver, kidney, duodenum, skeletal muscle tissues, as well as plasma and urine from C57BL/6 mice (see Methods).
Figure 2.
TIC obtained from the MRM screening mode of hydrophilic metabolites of the standards versus biological samples taken from C57BL/6 mice by UPLC-TQ MS. A. Overview of MRM chromatograms of the standards used: B. representative MRM spectra of metabolite standards glucose 6-phosphate, glutamine, alanine, choline and phenylalanine assessed; C. Corresponding MRM spectra of glucose 6-phosphate, glutamine, alanine, choline and phenylalanine from biological samples.
Figure 3.
Multivariate principal component and hierarchical analyses using the normalized peaks areas of 112 hydrophilic metabolites detected in plasma, urine, duodenum, liver, kidney, heart, and skeletal muscle samples from C57BL/6 mice. A. Three-dimensional PCA score plot of the different types of samples. B. Hierarchical clustering plot of the different types of samples.
Figure 4.
Levels of the 10 more significant metabolites determined from the variable importance plot of PLS-DA analysis, reflecting the metabolic complexity differentiating different types of biological samples. A. Variable importance plot showing the 10 more significant hydrophilic metabolites contributing to the samples differential clustering pattern. B. Relative levels of the 10 more significant metabolites contributing to the samples distinctive metabolomics patterns.
In general, metabolites detection was linear and sensitive for most molecules. The similarities of the results among different samples indicate that the interferences due to ion suppression were minimized with few exceptions, and even those were tissue dependent, by maintaining the samples at relatively low concentration, chromatographically separating the analytes as much as possible, and ensuring the optimal MS ionizing conditions for each molecule during their elution time. For example carnitine had a high variability in heart and skeletal muscle, but not in plasma, urine, liver, kidney and duodenum (see Suppl. Table 2) Most of the quantified metabolites are intermediates of the glycolytic, TCA and pentose cycle pathways. The quantified metabolites were seen to have reproducible values, and a large dynamic range indicating high sensitivity for detection (Supplemental Table 3).
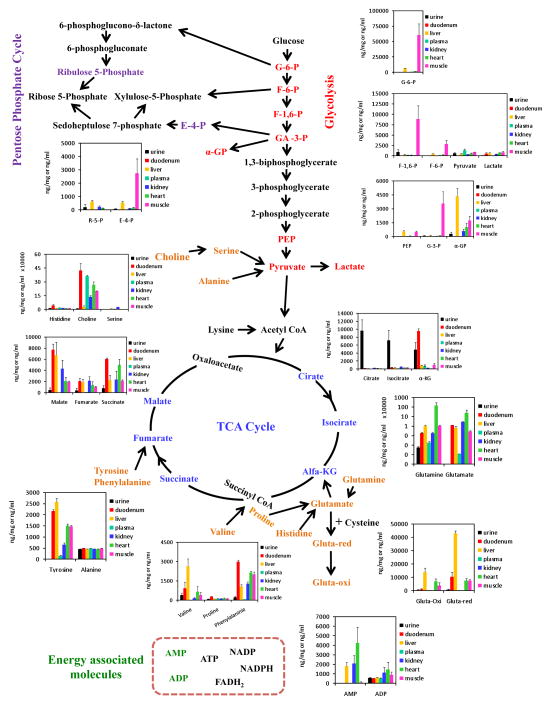
These quantifiable hydrophilic components, in particular, are key to targeted metabolite biomarker studies for assessment of key interlocking metabolic pathways (Figure 5). Several studies indicate that amino acids, and glycolytic, TCA cycle, pentose phosphate pathway intermediates are involved in diverse mechanisms associated with the interpretation of various diseases [29–31]. This work suggests that the PFPP column method developed for analysis of hydrophilic metabolites using the Waters Xevo TQ tandem MS possesses a strong application potential in both diagnostics, and for mechanism based investigations of disease etiologies.
Figure 5.
Metabolic pathway inter-dependence reflected by the quantitative levels of 30 hydrophilic metabolites from glycolysis TCA cycle, pentose phosphate cycle and amino acids. Colored words indicate that the metabolites were determined quantitatively; black words were metabolites analyzed in a relative manner.
Conclusion
The Tandem MS- pentafluorophenylpropyl (PFPP) stationary phase method described here offers the advantages of rapid, broad metabolomic profiling of positively and negatively charged hydrophilic metabolites in a single run, without the need for ion-pairing reagents. The suitability of this Tandem MS-PFPP stationary phase MRM method was demonstrated here by assessing the metabolic complexity seen in seven types of biological samples (plasma, urine, heart, liver, kidney and intestine). A total of 112 hydrophilic metabolites were rapidly detected and profiled within 8 min of chromatographic separation. This rapid method can be used for quantification, as shown here, and multi-parametric analyses (PCA, PLS-DA and HCA), revealed reliable reproducibility. This optimized HPLC-PFPP-MS method offers selectivity, high sensitivity and reliable reproducibility for assessment of metabolic complexity in a wide range of biological samples, when combined with advanced Tandem MS (Waters XevoTQ).
Supplementary Material
Acknowledgments
The present work was supported by NIH grant DK58132-01A2 grant to IJK, and LC/MS method development is additionally supported by Diabetes Research and Training Center (DRTC) NIH grant P60DK020541, and NIAID grant U19AI091175-01. The authors thank Dr. Bhavapriya Vaitheesvaran for assistance with animal experiments.
Footnotes
Supporting Information Available. This material is available free of charge via the Internet at http://pubs.acs.org.
Bibliography
- 1.Daviss B. Growing pains for metabolomics. The Scientist. 2005;19:25–28. [Google Scholar]
- 2.Jordan KW, Nordenstam J, Lauwers GY, Rothenberger DA, Alavi K, Garwood M, Cheng LL. Metabolomic characterization of human rectal adenocarcinoma with intact tissue magnetic resonance spectroscopy. Diseases of the Colon & Rectum. 2009;52:520–525. doi: 10.1007/DCR.0b013e31819c9a2c. [DOI] [PMC free article] [PubMed] [Google Scholar]
- 3.Jansson JK, Willing B, Lucio M, Fekete A, Dicksved J, Halfvarson J, Tysk C, Schmitt-Kopplin P. Metabolomics Reveals Metabolic Biomarkers of Crohn’s Disease. PloS one. 2009;4:e6386. doi: 10.1371/journal.pone.0006386. [DOI] [PMC free article] [PubMed] [Google Scholar]
- 4.Robertson D, Lindon JC, Nicholson JK, Holmes E, editors. Metabonomics in Toxicity Assessment. CRC Press; Boca Raton: 2005. [Google Scholar]
- 5.Brindle JT, Antti H, Holmes E, Tranter G, Nicholson JK, Bethell HWL, Clarke S, Schofield PM, McKilligin E, Mosedale D, Grainger DJ. Rapid and non-invasive diagnosis of the presence and severity of coronary heart disease using 1H-NMR based metabonomics. Nature Med. 2002;8:1439–1445. doi: 10.1038/nm1202-802. [DOI] [PubMed] [Google Scholar]
- 6.Lindon JC, Nicholson JK, Holmes E. The Handbook of Metabonomics and Metabolomics. Elsevier; Amsterdam: 2007. [Google Scholar]
- 7.Lu W, Clasquin MF, Melamud E, Amador-Noguez D, Caudy AA, Rabinowitz JD. Metabolomic analysis via reversed-phase ion-pairing liquid chromatography coupled to a stand alone orbitrap mass spectrometer. Anal Chem. 2007;82:3212–3221. doi: 10.1021/ac902837x. [DOI] [PMC free article] [PubMed] [Google Scholar]
- 8.Lu W, Bennett BD, Rabinowitz JD. Analytical strategies for LC-MS-based targeted metabolomics. J Chromatogr B. 2008;871:236–242. doi: 10.1016/j.jchromb.2008.04.031. [DOI] [PMC free article] [PubMed] [Google Scholar]
- 9.Bain JR, Stevens RD, Wenner BR, Ilkayeva O, Muoio DM, Newgard CB. Metabolomics applied to diabetes research: moving from information to knowledge. Diabetes. 2009;58:2429–2443. doi: 10.2337/db09-0580. [DOI] [PMC free article] [PubMed] [Google Scholar]
- 10.Bajad SU, Lu W, Kimball EH, Yuan J, Peterson C, Rabinowitz JD. Separation and quantitation of water soluble cellular metabolites by hydrophilic interaction chromatography-tandem mass spectrometry. J Chromatogr A. 2006;1125:76–88. doi: 10.1016/j.chroma.2006.05.019. [DOI] [PubMed] [Google Scholar]
- 11.Kitteringhama NR, Jenkinsa RE, Laneb CS, Victoria L, Elliott V, Parka K. Multiple reaction monitoring for quantitative biomarker analysis in proteomics and metabolomics. J Chromatogr B. 2009;877:1229–1239. doi: 10.1016/j.jchromb.2008.11.013. [DOI] [PubMed] [Google Scholar]
- 12.Tolstikov VV, Fiehn O, Tanaka N. Metabolomics, Methods and Protocols. Chapter 9. Humana Press; 2007. Application of Li quid Chromatography–Mass Spectrometry Analysis in Metabolomics Reversed-Phase Monolithic Capillary Chromatography and Hydrophilic Chromatography Coupled to Electrospray Ionization–Mass Spectrometry. [DOI] [PubMed] [Google Scholar]
- 13.Tolstikov VV, Fiehn O. Analysis of highly polar compounds of plant origin: combination of hydrophilic interaction chromatography and electrospray ion trap mass spectrometry. Anal Biochem. 2002;301:298–307. doi: 10.1006/abio.2001.5513. [DOI] [PubMed] [Google Scholar]
- 14.Kamleh A, Barrett MP, Wildridge D, Burchmore RJ, Scheltema RA, Watson DG. Metabolomic profiling using Orbitrap Fourier transform mass spectrometry with ydrophilic interaction chromatography: a method with wide applicability to analysis of biomolecules. Rapid Commun Mass Spectrom. 2008;22:1912–1918. doi: 10.1002/rcm.3564. [DOI] [PubMed] [Google Scholar]
- 15.Romano AH, Conway T. Evolution of carbohydrate metabolic pathways. Res Microbiol. 1996;147:448–455. doi: 10.1016/0923-2508(96)83998-2. [DOI] [PubMed] [Google Scholar]
- 16.Cavill R, Sidhu J, Kilarski W, Javerzat S, Hagedorn M, Ebbels T, Bikfalvi A, Keun HC. A combined metabonomic and transcriptomic approach to investigate metabolism during development in the chick chorio-allantoic membrane. J Proteome Res. 2010 May 5; doi: 10.1021/pr100033t. Epub ahead of print. [DOI] [PubMed] [Google Scholar]
- 17.Hirayama A, Kami K, Sugimoto M, Sugawara M, Toki N, Onozuka H, Kinoshita T, Saito N, Ochiai A, Tomita M, Esumi H, Soga T. Quantitative metabolome profiling of colon and stomach cancer microenvironment by capillary electrophoresis time-of-flight mass spectrometry. Cancer Res. 2009;69:4918–4925. doi: 10.1158/0008-5472.CAN-08-4806. [DOI] [PubMed] [Google Scholar]
- 18.Want EJ, Wilson ID, Gika H, Theodoridis G, Plumb RS, Shockcor J, Holmes E, Nicholson JK. Global metabolic profiling procedures for urine using UPLC-MS. Nat Protoc. 2010;5:1005–1018. doi: 10.1038/nprot.2010.50. [DOI] [PubMed] [Google Scholar]
- 19.Coulier L, Bas R, Jespersen S, Verheij E, van der Werf MJ, Hankemeier T. Simultaneous quantitative analysis of metabolites using ion-pair liquid chromatography-electrospray ionization mass spectrometry. Anal Chem. 2006;78:6573–6582. doi: 10.1021/ac0607616. [DOI] [PubMed] [Google Scholar]
- 20.Huck JH, Struys EA, Verhoeven NM, Jakobs C, van der Knaap MS. Profiling of pentose phosphate pathway intermediates in blood spots by tandem mass spectrometry: application to transaldolase deficiency. Clinical Chem. 2003;49:1375–1380. doi: 10.1373/49.8.1375. [DOI] [PubMed] [Google Scholar]
- 21.Luo B, Groenke K, Takors R, Wandrey C, Oldiges M. Simultaneous determination of multiple intracellular metabolites in glycolysis, pentose phosphate pathway and tricarboxylic acid cycle by liquid chromatography-mass spectrometry. J Chromatogr A. 2007;1147:153–164. doi: 10.1016/j.chroma.2007.02.034. [DOI] [PubMed] [Google Scholar]
- 22.Lu W, Bennett BD, Rabinowitz JD. Analytical strategies for LC-MS-based targeted metabolomics. J Chromatogr B Analyt Technol Biomed Life Sci. 871:236–242. doi: 10.1016/j.jchromb.2008.04.031. [DOI] [PMC free article] [PubMed] [Google Scholar]
- 23.Lu X, Bennet B, Mu E, Rabinowitz J, Kang Y. Metabolomic changes accompanying transformation and acquisition of metastatic potential in a syngeneic mouse mammary tumor model. J Biol Chem. 2010;285:9317–9321. doi: 10.1074/jbc.C110.104448. [DOI] [PMC free article] [PubMed] [Google Scholar]
- 24.Sreekumar A, Poisson LM, Rajendiran TM, Khan AP, Cao Q, Yu J, Laxman B, Mehra R, Lonigro RJ, Li Y, Nyati MK, Ahsan A, Kalyana-Sundaram S, Han B, Cao X, Byun J, Omenn GS, Ghosh D, Pennathur S, Alexander DC, Berger A, Shuster JR, Wei JT, Varambally S, Beecher C, Chinnaiyan AM. Metabolomic profiles delineate potential role for sarcosine in prostate cancer progression. Nature. 2009;457:910–914. doi: 10.1038/nature07762. [DOI] [PMC free article] [PubMed] [Google Scholar] [Research Misconduct Found]
- 25.Ali K, Maltese F, Zyprian E, Rex M, Choi YH, Verpoorte R. NMR Metabolic Fingerprinting Based Identification of Grapevine Metabolites Associated with Downy Mildew Resistance. J Agric Food Chem. 2009;57:9599–9606. doi: 10.1021/jf902069f. [DOI] [PubMed] [Google Scholar]
- 26.Vinayavekhin N, Homan EA, Saghatelian A. Exploring disease through metabolomics. ACS Chem Biol. 2010;5:91–103. doi: 10.1021/cb900271r. [DOI] [PubMed] [Google Scholar]
- 27.Cai X, Zou L, Dong J, Zhao L, Wang Y, Xu Q, Xue X, Zhang X, Liang X. Analysis of highly polar metabolites in human plasma by ultra-performance hydrophilic interaction liquid chromatography coupled with quadrupole-time of flight mass spectrometry. Anal Chim Acta. 2009;650:10–15. doi: 10.1016/j.aca.2009.01.054. [DOI] [PubMed] [Google Scholar]
- 28.Yoshida H, Mizukoshi T, Hirayama K, Miyano H. Comprehensive analytical method for the determination of hydrophilic metabolites by high-performance liquid chromatography and mass spectrometry. J Agric Food Chem. 2007;55:551–560. doi: 10.1021/jf061955p. [DOI] [PubMed] [Google Scholar]
- 29.Yao H, Shi P, Zhang L, Fan X, Shao Q, Cheng Y. Untargeted metabolic profiling reveals potential biomarkers in myocardial infarction and its application. Mol Biosyst. 2010;6:1061–1070. doi: 10.1039/b925612a. [DOI] [PubMed] [Google Scholar]
- 30.Heublein S, Kazi S, Ogmundsdóttir MH, Attwood EV, Kala S, Boyd CA, Wilson C, Goberdhan DC. Proton-assisted amino-acid transporters are conserved regulators of proliferation and amino-acid-dependent mTORC1 activation. Oncogene. 2010 May 24; doi: 10.1038/onc.2010.177. Epub ahead of print. [DOI] [PMC free article] [PubMed] [Google Scholar]
- 31.Roberts LD, Hassall DG, Winegar DA, Haselden JN, Nicholls AW, Griffin JL. Increased hepatic oxidative metabolism distinguishes the action of Peroxisome proliferator-activated receptor delta from Peroxisome proliferator-activated receptor gamma in the ob/ob mouse. Genome Med. 2009;1:115. doi: 10.1186/gm115. [DOI] [PMC free article] [PubMed] [Google Scholar]
Associated Data
This section collects any data citations, data availability statements, or supplementary materials included in this article.


