Abstract
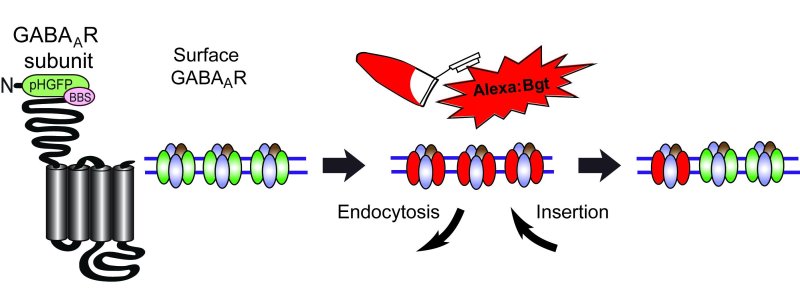
It is increasingly evident that neurotransmitter receptors, including ionotropic GABA A receptors (GABAAR), exhibit highly dynamic trafficking and cell surface mobility1-7. To study receptor cell surface localization and endocytosis, the technique described here combines the use of fluorescent α-bungarotoxin with cells expressing constructs containing an α-bungarotoxin (Bgt) binding site (BBS). The BBS (WRYYESSLEPYPD) is based on the α subunit of the muscle nicotinic acetylcholine receptor, which binds Bgt with high affinity8,9. Incorporation of the BBS site allows surface localization and measurements of receptor insertion or removal with application of exogenous fluorescent Bgt, as previously described in the tracking of GABAA and metabotropic GABAB receptors2,10. In addition to the BBS site, we inserted a pH-sensitive GFP (pHGFP11) between amino acids 4 and 5 of the mature GABAAR subunit by standard molecular biology and PCR cloning strategies (see Figure 1)12. The BBS is 3' of the pH-sensitive GFP reporter, separated by a 13-amino acid alanine/proline linker. For trafficking studies described in this publication that are based on fixed samples, the pHGFP serves as a reporter of total tagged GABAAR subunit protein levels, allowing normalization of the Bgt labeled receptor population to total receptor population. This minimizes cell to cell Bgt staining signal variability resulting from higher or lower baseline expression of the tagged GABAAR subunits. Furthermore the pHGFP tag enables easy identification of construct expressing cells for live or fixed imaging experiments.
Keywords: Neuroscience, Issue 85, α-bungarotoxin, binding site, endocytosis, immunostaining, rodent hippocampal neurons, receptor, trafficking, plasma membrane
Introduction
The use of fluorescently coupled α-bungarotoxin to study receptor localization and dynamics was pioneered in studies of the nicotinic acetylcholine receptor13-15, the toxin's endogenous target. Subsequently, incorporation of the minimal Bgt binding peptide (BBS) has been used to study trafficking of both excitatory and inhibitory ligand-gated ion channels and G protein coupled receptors2,10,16-21. This BBS-based technique provides advantages to other approaches used for trafficking studies such as surface biotinylation methods, antibody labeling of live cells with antibodies to extracellular epitopes, and fluorescence recovery after photobleaching (FRAP). During cell surface biotinylation free amines are covalently modified, with the potential to affect cellular activity. Antibody based studies have often been hampered by surface antigen clustering or capping, which can alter trafficking events. Due to the bleaching step for FRAP studies, an important concern is damaging the underlying cellular structure. An additional advantage is that BBS tagged constructs can also be used for biochemical methodologies with biotin-coupled bungarotoxin to asses receptor trafficking. This technique is readily applicable to cell lines and primary cells. For use in cells that express nicotinic acetylcholine (nAChR) receptors, the nAChR antagonist tubocurarine must be used throughout the protocol as indicated. Performing a simple surface Bgt labeling (equivalent to the T=0 time point for the endocytosis protocol) on untransfected cells in the absence of tubocurarine will provide evidence of endogenous nAChR.
An important consideration for using this technique is appropriate insertion of the BBS so that it is present at an extracellular location when the protein of interest is delivered to the plasma membrane. For example, the N-terminal domains of GABAAR subunits reside in the vesicular lumen during trafficking and become extracellular after receptor insertion in the plasma membrane, allowing specific labeling of cell surface receptors and assessment of their removal from the cell surface by endocytic events. We have previously shown that the addition of GFP, myc, or BBS epitopes to this domain of GABAAR subunits is functionally silent. Standard controls should be performed to ensure that the tagged protein is expressed at similar levels to an untagged construct, that it appropriately localized, and that it does not affect receptor function. This characterization of transfected constructs will also aid in troubleshooting overexpression concerns.
Protocol
All protocols described below are in accordance with the IACUC and IRB institutional review boards of the University of Pittsburgh School of Medicine.
1. Preparation of Hippocampal Neuronal Cultures in Tissue Culture Hood
Note: Use sterile technique and reagents throughout Protocol 1.
- Prepare poly-D-lysine (0.1 mg/ml in H2O) coated glass coverslips as a substrate for the neuronal culture.
- Place 4-5 round glass coverslips inside each 3.5 cm tissue culture dish.
- Spot 70 μl poly-D-lysine onto each 12 mm coverslip. Note: for live imaging, a glass bottomed 3.5-cm tissue culture dish can be used (spot 200 μl poly-D-lysine onto embedded 14 mm glass coverslip).
- Leave the prepared dishes in the tissue culture hood O/N. To minimize poly-D-lysine evaporation and keep surfaces sterile in the tissue culture hood, close down the window sash and turn off the blower O/N. Note: UV lights are not used during the O/N incubation.
- The next morning, wash the dishes 3x with 2 ml of H2O.
- After removing the last H2O wash, add 2 ml of media to each 3.5 cm dish and leave dishes in incubator until ready to plate the neurons in step 1.4.
Hippocampal neurons are prepared from embryonic day 18-19 (E18-19) rats (modified from Goslin22).
Transfect freshly dissociated neurons on the day of culturing with 1-4 μg of maxiprepped construct DNA. Note: typically 3 μg of DNA is transfected into 1-2 million neurons, with a viability of 50% and a transfection efficiency of 60% (e.g. starting with 2 million neurons: ((2 x 10⁶ neurons x 0.5)0.6) provides approx. 1 million neurons; 600,000 of which are transfected1. Different amounts of construct DNA can be transfected when troubleshooting potential issues of over-expression, followed by appropriate characterization of construct localization and function.
Plate the transfected neurons on the poly-D-lysine coated coverslips at a final density of approximately 200,000 neurons per 3.5 cm dish. Note: for a glass bottomed dish, plate 40,000-50,000 neurons on the 14 mm glass area.
Replace the media 4-24 hr after preparation of neuronal cultures, then allow neurons to develop in the incubator until 14-17 days in vitro (DIV) or desired stage.
2. Endocytosis Assay
CAUTION: Note on α-bungarotoxin and tubocurarine waste and handling:
Handling of all peptide neurotoxins is recommended within the guidelines of Biosafety Level-2 (BL-2) research protocols. All proper personal protective gear must be worn. Lyophilized toxin powders should be reconstituted according to manufacturer's instructions. Toxin waste should be disposed of in compliance with the governing institution's Environmental Health and Safety guidelines.
To remove potential peptide aggregates that may have formed during storage, α-bungarotoxin aliquots should be centrifuged briefly before use, and the supernatant should be used for the experiment.
α-bungarotoxin (Bgt) stocks are resuspended to a concentration of 1 mg/ml in sterile H2O and stored in 10 μl aliquots at -20 °C. Fluorescently coupled Bgt stocks are used at 3 μg/ml. Tubocurarine is used at a final concentration of 150 μM.
Set bench top heater block to 16 °C in cold room with thin aluminum or stainless steel plate on top. Alternatively, if available, a bench top cooling/heating device can be used for each step requiring 16 °C.
Cool extracellular Hepes-buffered saline (HBS containing in mM: 135 NaCl, 4.7 KCl, 10 HEPES, 11 glucose, 1.2 MgCl2, and 2.5 CaCl2, pH 7.4) to 16 °C in a water bath.
Transfer neuron dishes to aluminum plate at 16 °C and cool for 5 min.
Remove media (keep conditioned media and reserve in incubator for step 2.8, endocytosis assay time points) and replace with 1 ml of 16 °C HBS + tubocurarine (150 μM) for 2 min.
Remove HBS + tubocurarine to labeled waste container and replace with 1 ml of 16 °C HBS + tubocurarine (150 μM) + α-bungarotoxin Alexa 594 [3 μg/ml], incubating at 16 °C for 15 min.
Remove HBS + tubocurarine + α-bungarotoxin Alexa 594 to labeled waste container and wash dishes 3x with 2 ml of 16 °C HBS (the washes can be collected via aspiration in a vacuum flask containing 50 ml of 50 % bleach).
For live imaging time series experiments following receptor endocytosis using a glass bottomed 3.5 cm culture dish, perform steps 2.1-2.6, then transfer dish to heated stage (peltier device) on microscope, and begin imaging with a confocal or TIRF microscope setup.
Transfer T = 0 time point coverslips into a dish of RT 4% paraformaldehyde /4% sucrose for 20 min, continuing with other coverslips to step 2.9.
For other time points, replace HBS with conditioned equilibrated 37 °C media (reserved in step 2.4) and return to incubator for endocytosis at 37 °C. Note: suggested additional time points of T = 15, 30, and 60.
At time points needed, take dishes from incubator, wash quickly twice with 2 ml of RT DPBS (DPBS no calcium, magnesium) then fix in 4% paraformaldehyde/4% sucrose for 20 min.
After 20 min fixation, remove 4% paraformaldehyde /4% sucrose to waste container and wash dishes twice with 2 ml RT DPBS.
Incubate coverslips at RT for 10 min in immunofluorescence block solution (block solution = 5% horse serum, 0.5% BSA in DPBS) containing 0.2% Triton X-100 to permeabilize the neurons and enable anti-GFP immunostaining of intracellular receptor pool and/or labeling of other proteins of interest.
Remove block + 0.2% Triton X-100 and incubate coverslips in immunofluorescence block solution without Triton X-100 for 20-30 min.
Perform primary antibody incubations of coverslips in block for several hours at RT or O/N at 4 °C. Note: incubation of coverslips with primaries at 4 °C O/N routinely produces improved immunofluorescence results.
Wash coverslips 3x with DPBS (5 min for each wash step).
Incubate coverslips with secondary antibodies in block solution for 1 hr at RT.
Wash coverslips 3x with DPBS (5 min for each wash step).
Mount coverslips, handling each coverslip individually: remove excess liquid from back of coverslip with lab tissue, then invert coverslip onto 4 μl of mounting medium on a glass slide.
Allow slides to dry at RT covered for 30 min then store at 4 °C until ready to perform microscopy.
- Image acquisition and analysis of experiment with confocal microscopy (blind to experimental condition). 60X oil NA 1.49 immersion objective with the following lasers: Argon gas 488 nm, 561 diode, 640 diode.
- Using the same image acquisition settings, acquire single Z section images with the neuronal cell body and several dendritic processes in focus.
- Quantify α-bungarotoxin Alexa fluorescence signal and GFP immunostaining along 20 μm of 3-4 proximal dendrites per neuron, using the same threshold for analysis of all endocytosis data.
- Analyze data from 10-12 neurons for each time point, repeating the experiment with several independent neuronal cultures.
Representative Results
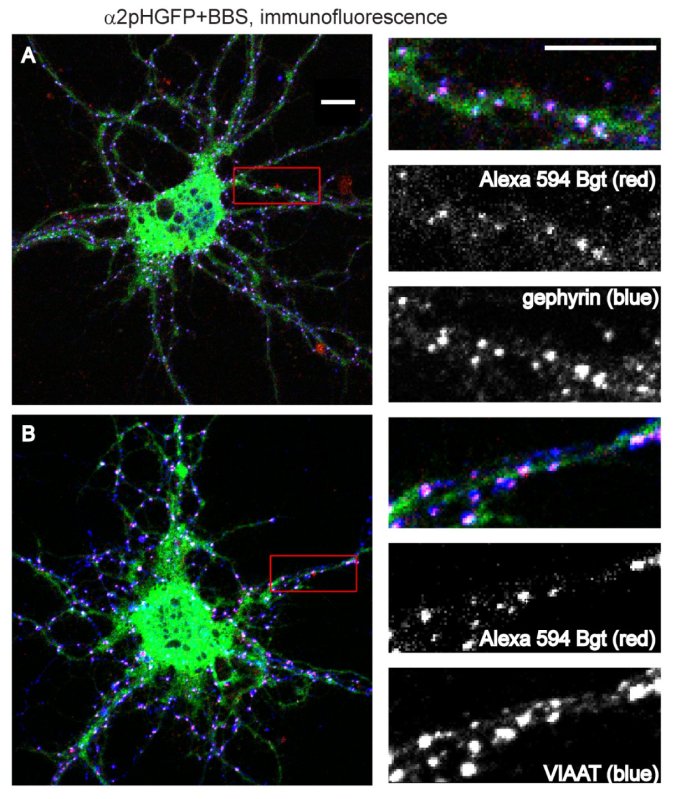
Characterization of a BBS tagged construct includes important controls such as determining if the expressed protein assembles properly (particularly with receptors composed of multiple subunits), traffics to the cell surface and localizes appropriately. Inhibitory synapses are composed of GABA A receptor surface clusters that colocalize with the inhibitory scaffold protein gephyrin and are apposed to presynaptic inhibitory terminals, identified by the vesicular inhibitory amino acid transporter that loads GABA and glycine into synaptic vesicles (VIAAT/VGAT). Shown in Figure 2 are α2pHGFP+BBS expressing neurons with surface GABAAR labeled with Bgt, followed by immunostaining for total receptor population with anti-GFP antibody and either the postsynaptic inhibitory scaffold protein gephyrin (Figure 2A) or VIAAT (Figure 2B).
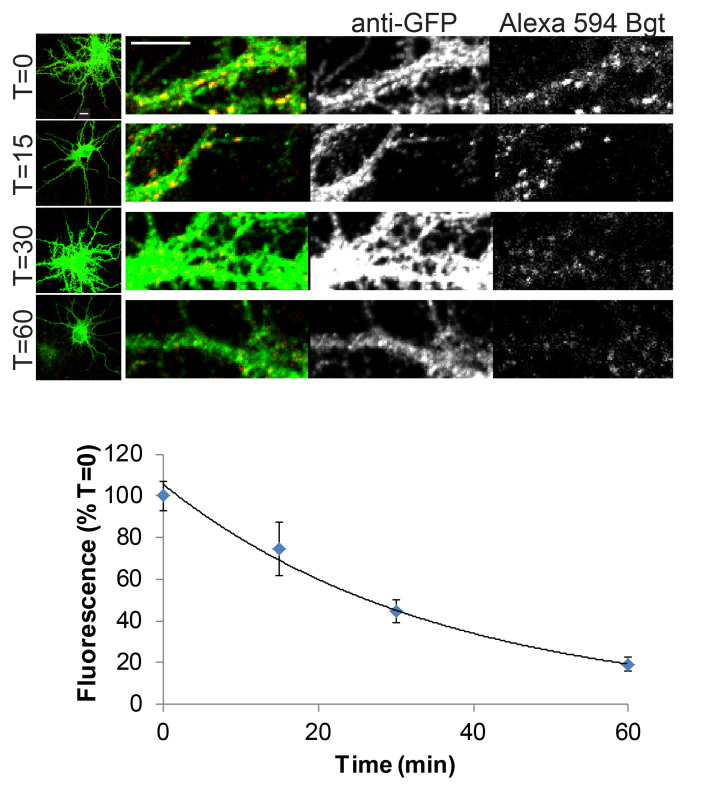
Figure 3 shows the endocytosis of α2 containing GABAAR in hippocampal neurons at 15 DIV. Bgt fluorescence measurements of individual dendritic processes as shown in the panels (Figure 3A) are normalized to the level of construct expression via the GFP antibody staining. Final comparison of time points is made by normalization to the T=0 measurement, as shown in Figure 3B. Quantification of internalization of receptors over a 60 min period (Figure 3B) from fluorescence signal changes over time (Mean ± SEM: T0 = 100 ± 7.2, T15 = 74.7 ± 12.9, T30 = 44.7 ± 5.6, and T60 = 19.1 ± 3.4 min) was best described by a single exponential (at 37 ºC: t1/2 = 26 ± 4.8 min).
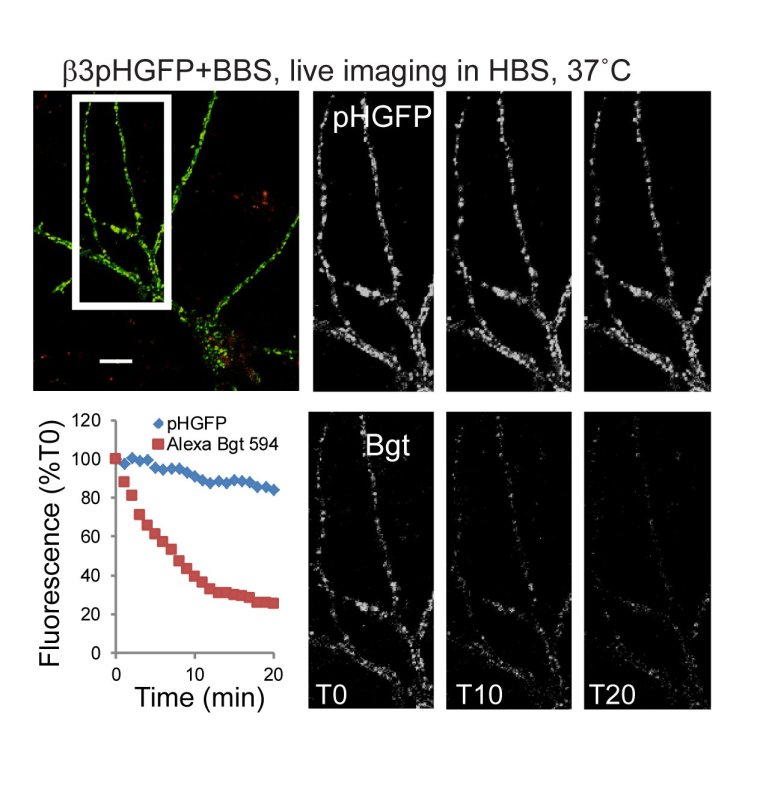
An alternative approach, shown in Figure 4, is to follow receptor endocytosis in a single neuron by live imaging time-lapse confocal microscopy. The punctate and overlapping fluorescence of surface pHGFP tagged GABAAR and Bgt labeled receptors is visible at the start of the experiment (T0). Over the time course, Bgt labeled GABA AR signal decreases, as receptors endocytose, while the pHGFP signal remains high due to new receptor insertion. The minimal decrease in phGFP signal is due to cell surface receptor distribution changes and photobleaching.
 Figure 1. Diagram of a BBS and pHGFP tagged GABAAR subunit and the endocytosis assay. Endocytosis is measured by first applying a fluorescently labeled bungarotoxin to neurons or cells, followed by a brief wash to remove unbound toxin, then fluorescence loss is monitored as receptors are internalized.
 Figure 2. Confocal imaging of BBS and pHGFP tagged GABAAR showing appropriate localization with inhibitory synapse components. Surface GABAAR in α2pHGFP+BBS expressing neurons were labeled with α-bungarotoxin Alexa 594 (red), followed by immunostaining, enlargements of dendrites are shown to the right of each neuron. Merged panel (α-bungarotoxin Alexa 594 in red, GFP in green, gephyrin or VIAAT in blue). Surface Bgt labeled GABAAR show colocalization with A) the postsynaptic inhibitory scaffold protein gephyrin and B) apposition to the presynaptic marker VIAAT. (Scale bars, 10 μm.)
 Figure 3. Confocal imaging of GABAAR endocytosis in 15 DIV hippocampal neurons. A) Surface GABAAR in α2pHGFP+BBS neurons were live-labeled with α-bungarotoxin Alexa 594 (red), and then unbound α-bungarotoxin Alexa 594 was removed by washing, followed by incubation at 37 °C. At T = 0, 15, 30, and 60 min, samples were removed and fixed. Total receptor number was assayed by permeabilization and staining with anti-GFP antibody (green). Panels are enlargements of dendrites (Scale bars, 10 μm). B) Graph represents the surface GABAAR α-bungarotoxin Alexa 594 fluorescence loss over time with endocytosis (normalized to T = 0) (10-12 neurons per time point, 4 processes analyzed per neuron; error bars represent MEAN ± SEM).
 Figure 4. Live confocal imaging of GABAAR endocytosis in 15 DIV hippocampal neurons. A) B3pHGFP+BBS containing surface GABAAR in neurons were live-labeled with α-bungarotoxin Alexa 594 (red), followed by brief removal of unbound α-bungarotoxin Alexa 594 by washing. Neurons were imaged by confocal microscopy at 37 °C in HBS for 20 min at a 1 min interval (Scale bars, 10 μm). Bgt Labeled GABAARs were localized to the cell surface at T0, as seen by colocalization with the pHGFP signal at T0. Over the time course, Bgt labeled GABA AR signal decreases, as receptors endocytose, new pHGFP expressing receptors are continually being inserted, so the pHGFP signal remains nearly constant.
Discussion
The BBS based fixed and live techniques described here can be used to track receptor or other plasma membrane protein trafficking in cell lines, neurons, and other primary cells. This method has been successfully used to study membrane insertion and removal of ligand-gated ion channels and GPCR and assess changes in trafficking due to the presence of receptor agonists and modulators. Key aspects include appropriate localization of the tag to an extracellular location and performing controls to ensure that addition of the BBS (as standard for other reporters, such as GFP) is functionally silent. For use in cells that express nicotinic acetylcholine (nAChR) receptors, the nAChR antagonist tubocurarine must be used throughout the protocol as indicated. In the case where the additional GFP tag is not used, total BBS tagged protein level can be determined via staining with an additional α-bungarotoxin coupled to another fluorophore after fixation and permeabilization. Choice of time points for measuring endocytosis rates of the receptor/protein of interest requires assessing the current knowledge of trafficking for the receptor/protein, combined with initial use of more time points. This technique also can be readily employed with conventional immunostaining. We also describe an alternative approach for tracking receptor endocytosis via live confocal imaging experiments. Equipment availability, time requirements for live experiments, and other experimental constraints will guide choice of method, both being viable and published techniques. Future applications of BBS techniques include live or fixed imaging combined with endosomal and lysosomal markers to follow receptor fate, i.e. targeting to recycling endosomes and redelivery to the plasma membrane or degradation via lysosomes.
Disclosures
The authors have nothing to disclose.
Acknowledgments
Support was provided by startup-funds from the Pharmacology and Chemical Biology Department at the University of Pittsburgh School of Medicine. Acknowledgement of Jacob lab members who contributed to the video submission: Nicholas Graff.
References
- Jacob TC, et al. Gephyrin regulates the cell surface dynamics of synaptic GABAA receptors. J. Neurosci. 2005;25:10469–10478. doi: 10.1523/JNEUROSCI.2267-05.2005. [DOI] [PMC free article] [PubMed] [Google Scholar]
- Bogdanov Y, et al. Synaptic GABAA receptors are directly recruited from their extrasynaptic counterparts. EMBO J. 2006;25:4381–4389. doi: 10.1038/sj.emboj.7601309. [DOI] [PMC free article] [PubMed] [Google Scholar]
- Thomas P, Mortensen M, Hosie AM, Smart TG. Dynamic mobility of functional GABA(A) receptors at inhibitory synapses. Nat. Neurosci. 2005;8:889–897. doi: 10.1038/nn1483. [DOI] [PubMed] [Google Scholar]
- Wilkins ME, Li X, Smart TG. Tracking Cell Surface GABAB Receptors Using an α-Bungarotoxin Tag. J. Biol. Chem. 2008;283:34745–34752. doi: 10.1074/jbc.M803197200. [DOI] [PMC free article] [PubMed] [Google Scholar]
- Saliba RS, Pangalos M, Moss SJ. The ubiquitin-like protein Plic-1 enhances the membrane insertion of GABAA receptors by increasing their stability within the endoplasmic reticulum. J. Biol. Chem. 2008;283:18538–18544. doi: 10.1074/jbc.M802077200. [DOI] [PMC free article] [PubMed] [Google Scholar]
- Bannai H, et al. Activity-Dependent Tuning of Inhibitory Neurotransmission Based on GABAAR Diffusion Dynamics. Neuron. 2009;62:670–682. doi: 10.1016/j.neuron.2009.04.023. [DOI] [PubMed] [Google Scholar]
- Muir J, et al. NMDA receptors regulate GABAA receptor lateral mobility and clustering at inhibitory synapses through serine 327 on the gamma2 subunit. Proc. Natl. Acad. Sci. U.S.A. 2010;107:16679–16684. doi: 10.1073/pnas.1000589107. [DOI] [PMC free article] [PubMed] [Google Scholar]
- Katchalski-Katzir E, et al. Design and synthesis of peptides that bind alpha-bungarotoxin with high affinity and mimic the three-dimensional structure of the binding-site of acetylcholine receptor. Biophys. Chem. 2003;100:293–305. doi: 10.1016/s0301-4622(02)00287-9. [DOI] [PubMed] [Google Scholar]
- Scherf T, et al. A beta -hairpin structure in a 13-mer peptide that binds alpha -bungarotoxin with high affinity and neutralizes its toxicity. Proc. Natl. Acad. Sci. U.S.A. 2001;98:6629–6634. doi: 10.1073/pnas.111164298. [DOI] [PMC free article] [PubMed] [Google Scholar]
- Wilkins ME, Li X, Smart TG. Tracking cell surface GABAB receptors using an alpha-bungarotoxin tag. J. Biol. Chem. 2008;283:34745–34752. doi: 10.1074/jbc.M803197200. [DOI] [PMC free article] [PubMed] [Google Scholar]
- Miesenbock G, De Angelis DA, Rothman JE. Visualizing secretion and synaptic transmission with pH-sensitive green fluorescent proteins. Nature. 1998;394:192–195. doi: 10.1038/28190. [DOI] [PubMed] [Google Scholar]
- Jacob TC, et al. Benzodiazepine treatment induces subtype-specific changes in GABAA receptor trafficking and decreases synaptic inhibition. Proc. Natl. Acad. Sci. U.S.A. 2012;109:18595–18600. doi: 10.1073/pnas.1204994109. [DOI] [PMC free article] [PubMed] [Google Scholar]
- Anderson MJ, Cohen MW. Fluorescent staining of acetylcholine receptors in vertebrate skeletal muscle. J. Physiol. 1974;237:385–400. doi: 10.1113/jphysiol.1974.sp010487. [DOI] [PMC free article] [PubMed] [Google Scholar]
- Axelrod D. Crosslinkage and visualization of acetylcholine receptors on myotubes with biotinylated alpha-bungarotoxin and fluorescent avidin. Proc. Natl. Acad. Sci. U.S.A. 1980;77:4823–4827. doi: 10.1073/pnas.77.8.4823. [DOI] [PMC free article] [PubMed] [Google Scholar]
- Axelrod D, et al. Lateral motion of fluorescently labeled acetylcholine receptors in membranes of developing muscle fibers. Proc. Natl. Acad. Sci. U.S.A. 1976;73:4594–4598. doi: 10.1073/pnas.73.12.4594. [DOI] [PMC free article] [PubMed] [Google Scholar]
- Sekine-Aizawa Y, Huganir RL. Imaging of receptor trafficking by using alpha-bungarotoxin-binding-site-tagged receptors. Proc. Natl. Acad. Sci. U.S.A. 2004;101:17114–17119. doi: 10.1073/pnas.0407563101. [DOI] [PMC free article] [PubMed] [Google Scholar]
- Jacob TC, et al. GABAA receptor membrane trafficking regulates spine maturity. Proc. Natl. Acad. Sci. U.S.A. 2009;106:12500–12505. doi: 10.1073/pnas.0903943106. [DOI] [PMC free article] [PubMed] [Google Scholar]
- Hannan S, et al. GABAB receptor internalisation is regulated by the R2 subunit. J. Biol. Chem. 2011. [DOI] [PMC free article] [PubMed]
- Saliba RS, Kretschmannova K, Moss SJ. Activity-dependent phosphorylation of GABAA receptors regulates receptor insertion and tonic current. EMBO. 2012;31:2937–2951. doi: 10.1038/emboj.2012.109. [DOI] [PMC free article] [PubMed] [Google Scholar]
- Beqollari D, Betzenhauser MJ, Kammermeier PJ. Altered G-Protein Coupling in an mGluR6 Point Mutant Associated with Congenital Stationary Night Blindness. Mol. Pharmacol. 2009;76:992–997. doi: 10.1124/mol.109.058628. [DOI] [PubMed] [Google Scholar]
- Terunuma M, et al. Prolonged activation of NMDA receptors promotes dephosphorylation and alters postendocytic sorting of GABAB receptors. Proc. Natl. Acad. Sci. U.S.A. 2010;107:13918–13923. doi: 10.1073/pnas.1000853107. [DOI] [PMC free article] [PubMed] [Google Scholar]
- Goslin KGB. 2nd ed. MIT Press; 1998. Culturing Nerve Cells. [Google Scholar]


