Abstract
Purpose
To investigate the feasibility of real-time 3D magnetic resonance imaging (MRI) with simultaneous recording of physiological signals for identifying sites of airway obstruction during natural sleep in pediatric patients with sleep-disordered breathing.
Methods
Experiments were performed using a three-dimensional Fourier transformation (3DFT) gradient echo sequence with prospective undersampling based on golden-angle radial spokes, and L1-norm regularized iterative self-consistent parallel imaging (L1-SPIRiT) reconstruction. This technique was demonstrated in three healthy adult volunteers and five pediatric patients with sleep-disordered breathing. External airway occlusion was used to induce partial collapse of the upper airway on inspiration and test the effectiveness of the proposed imaging method. Apneic events were identified using information available from synchronized recording of mask pressure and respiratory effort.
Results
Acceptable image quality was obtained in seven of eight subjects. Temporary airway collapse induced via inspiratory loading was successfully imaged in all three volunteers, with average airway volume reductions of 63.3%, 52.5%, and 33.7%. Central apneic events and associated airway narrowing/closure were identified in two pediatric patients. During central apneic events, airway obstruction was observed in the retropalatal region in one pediatric patient.
Conclusion
Real-time 3D MRI of the pharyngeal airway with synchronized recording of physiological signals is feasible and may provide valuable information about the sites and nature of airway narrowing/collapse during natural sleep.
Keywords: MRI, upper airway, airway obstruction, sleep apnea, parallel imaging, constrained reconstruction
Obstructive sleep apnea (OSA) is the most common type of sleep apnea and is characterized by repetitive episodes of airflow cessation during sleep as a result of the collapse of the pharyngeal airway (1). The prevalence of OSA syndrome has been estimated at 2% of the general population of children (2), 13–66% of obese children (3), and 4–9% of adults (2). Airway collapse during sleep is caused by a combination of anatomical and functional factors. Anatomical factors include inherently narrow upper airway resulting from 1) enlarged adenoids or tonsils, 2) a large soft palate, and 3) a large tongue. Functional factors include decrease in the activation of pharyngeal dilator muscles with sleep onset. Obesity contributes to a narrow airway and airway collapsibility (4), and the prevalence of obesity is on the rise. Despite breathing efforts, airway obstruction results in no gas exchange leading to oxygen desaturation and frequent arousals during sleep.
Pathologic central sleep apnea (CSA) is relatively rare when compared with OSA and is characterized by absent respiratory effort as well as airflow cessation during sleep, accompanied by arousal and/or hypoxemia. Airway narrowing and/or closure occur during CSA (5). CSAs have been reported in obese children and adolescents with sleep-disordered breathing (3). Complex sleep apnea is a combination of OSA and CSA, and patients with complex sleep apnea exhibit CSAs even during a continuous positive airway pressure treatment of airway obstruction (6).
Knowledge of obstruction sites with an imaging tool has been of great interest to researchers because direct inspection of the airway may facilitate treatment planning and may have the potential to improve treatment outcome (7–9). Imaging techniques including endoscopy, fluoroscopy, computed tomography, and magnetic resonance imaging (MRI) have been applied to subjects with OSA, and each approach has its own unique limitations (10).
MRI is noninvasive, involves no ionizing radiation, and has provided valuable insights into understanding upper airway anatomy and function in patients with OSA syndrome. In prior studies, static 3D MRI revealed narrowed airway volume in patients with OSA when compared with age-matched controls without OSA (11). Respiratory-gated dynamic 2D (12) and 3D (13,14) MRI have been proposed to measure the changes in the upper airway caliber in relation to the respiratory cycle during tidal breathing and compare them between subjects with and without OSA syndrome. Real-time MRI (i.e., MRI using an acquisition time per frame that is short relative to the dynamic process of interest) has been used to demonstrate airway collapse in OSA patients during sleep with (15,16) and without sedation (17–19), but has been limited to a 2D slice of axial or mid-sagittal orientation. Recently, Shin et al. (18,19) demonstrated visualization of airway collapse in adult patients with OSA using real-time interactive multislice MRI, in which slice prescriptions were made in axial, mid-sagittal, and coronal slices.
The most common approach is 2D mid-sagittal MRI, which provides only partial coverage of a narrowed upper airway and is very sensitive to imperfect localization and to patient head motion. Similarly, 2D axial MRI can reveal temporal changes in airway cross-sectional area, but it is easy to miss the actual site of collapse. Real-time 3D MRI would be desirable, because it provides complete coverage of the airway and does not require prior knowledge of the location of collapse. In this work, we propose a real-time 3D MRI acquisition using a novel temporal view order and a reconstruction technique that provides high spatial and temporal resolution with the combined use of parallel imaging and constrained reconstruction. We demonstrate its effectiveness in visualizing marked reduction of the pharyngeal airway during inspiratory loading in volunteers and identifying locations of airway narrowing and/or collapse in pediatric subjects with sleep-disordered breathing during natural sleep.
METHODS
Experimental Setup
Experiments were performed on a 3.0 Tesla scanner (Signa Excite HDxt, GE Healthcare, Waukesha, WI) with gradients capable of 40 mT/m amplitude and 150 T/m/s slew rate. A body coil was used for radiofrequency (RF) transmission and a six-channel carotid receiver coil (see Fig. 1b) was used for signal reception.
FIG. 1.
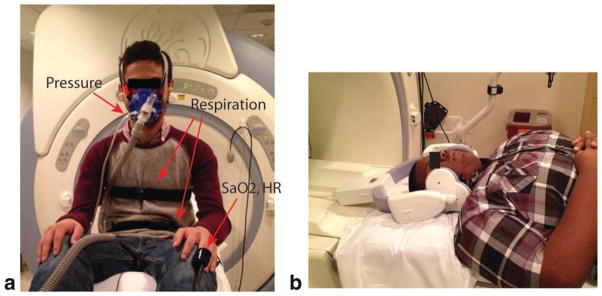
Experimental setup for the proposed sleep MRI. a: Placement of the devices on a subject. The tube-mask setup necessary for the airway occlusion test is shown. Pressure from the mask port is transmitted via the thin transparent tube to a metallic pressure transducer which is approximately 8 m away from the scanner. Respiratory belts are placed around the subject’s chest and abdomen. Oxygen saturation and heart rate are monitored using the MR compatible optical finger plethysmograph. b: The six-channel carotid coil on a pediatric subject. In our experiments, the left and right side of the coil are each wrapped with a pillowcase to avoid a contact between the coil and subject’s face.
Several physiological signals were monitored and recorded during the MRI scan, as shown in Figure 1a. An optical fingertip plethysmograph (Biopac Inc., Goleta, CA) was used to measure heart rate and oxygen saturation. A respiratory transducer (Biopac Inc., Goleta, CA) and the scanner’s built-in respiratory bellows (GE Healthcare, Waukesha, WI) were used to measure respiratory effort. A facial mask (Hans Rudolph Inc., Kansas City, MO) was used for measurement of airway pressure and for airway occlusion test. The airway pressure from the mask port was transmitted to a Validyne pressure transducer (Validyne Engineering Inc., Northridge, CA) and converted to voltage. Pressure calibration was performed to convert voltage back to pressure. The tube-mask setup (see Fig. 1a) was used for airway occlusion test. The scan operator was able to initiate an airway occlusion from the MRI console room, by pressing a button that initiated inflation of the balloon leading to blocking of the air passage. This airway occlusion setup was based on a prior work by Colrain et al. (20). Occlusions of this type can lead to substantial narrowing of the upper airway during inspiration (21).
Imaging Methods
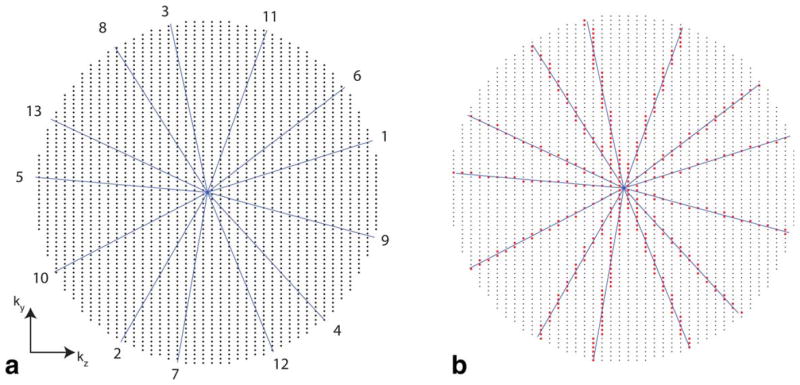
Real-time 3D acquisition was based on the use of a 3DFT gradient echo sequence, with a 6 cm excitation slab thickness, flip angle of 5°, and matrix size of 100 × 80 × 40. The ky and kz phase encodes were along anterior–posterior (A–P) and right–left (R–L) directions, respectively. The imaging pulse sequence was continuous with short (2 min) and long (14–18 min) scan durations. Imaging parameters for the short scan were as follows: field of view (FOV) = 16.0 × 12.8 × 6.4 cm3, spatial resolution = 1.6 × 1.6 × 1.6 mm3, pulse repetition time (TR) = 3.88 ms, and echo time (TE) = 1.74 ms. Imaging parameters for the long scan were as follows: FOV = 20.0 × 16.0 × 8.0 cm3 (or 18.0 × 14.4 × 7.2 cm3), spatial resolution = 2.0 × 2.0 × 2.0 mm3 (or 1.8 × 1.8 × 1.8 mm3), TR = 6.02 ms, and TE = 1.72 ms. TR was lengthened for the long scan because we empirically determined that scanning with the 6.02 ms TR produced perceptually lower acoustic noise than that with the shorter TR and thus subjects would be more likely to fall asleep. We adopted a golden-angle radial spokes view ordering (22) in (ky, kz) space similar to the work by Doneva et al. (23). In our case, as sample spacing along ky was twice as dense as that along kz, more samples along a radial spoke oriented toward the ky axis were acquired than along a radial spoke oriented toward the kz axis (see Fig. 2b).
FIG. 2.
Cartesian golden-angle sampling scheme used in this work. a: Sampling grid with a circular footprint and temporal ordering of radial half spokes. Only 13 spokes are shown for illustration. The number at the end of each spoke represents a temporal order. Each radial spoke is incremented by the golden angle (≈360°/1.618). Note that the spatial resolution in ky is the same as that in kz, but the FOV in ky is twice as large as the FOV in kz. b: Samples (red dots) chosen along the spokes. Each sample along a given radial spoke was mapped onto its nearest neighboring location in the Cartesian (ky, kz) grid. [Color figure can be viewed in the online issue, which is available at wileyonlinelibrary.com.]
Image reconstruction was based on SPIRiT (24) and was performed using MATLAB (The Mathworks, South Natick, MA). We retrospectively chose temporal resolutions of 388 ms for the short scan and 602 ms for the long scan. Both the temporal resolutions were determined by binning raw data from 100 consecutive TR periods into every frame. Real-time movies of 3D airway dynamics were generated using an L1-SPIRiT reconstruction algorithm proposed by Lebel et al. (25). Figure 3 shows the schematic of our reconstruction method. L1-norm regularization (26) promoted wavelet and finite difference sparsity along all spatial and temporal dimensions. Regularization parameters were chosen empirically and kept constant for all datasets. We considered 30 consecutive frames for 4D L1-SPIRiT (see Fig. 3) and continued to reconstruct the next 30 frames, and so on. This blockwise approach was taken in order to reduce memory requirements. Image reconstruction was performed on a workstation of which specs were 2.93 GHz/12-core CPU (Intel Xeon X5670, cache size = 12288 KB) and 48 GB RAM. The L1-SPIRiT image reconstruction took approximately 19 s/frame when the iteration number was 40.
FIG. 3.
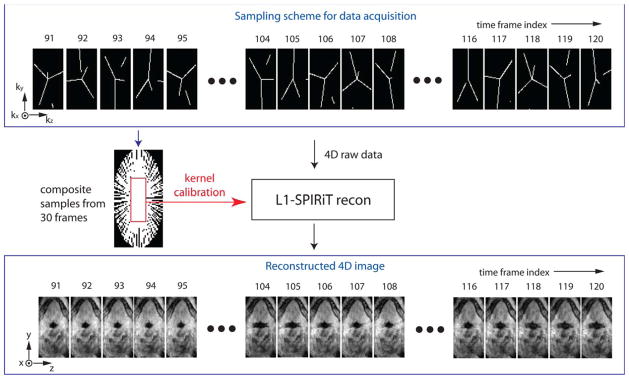
A schematic of the proposed data sampling and image reconstruction. Golden-angle radial spokes sampling in (ky, kz) space is shown in the top block. In the sampling, each frame has 100 (ky,kz) samples along 3, 4, or 5 radial spokes, and each frame shows discontinuity in some spokes which is connected when considering samples from previous or next frames. The composite samples contain fully sampled low-resolution data that are used for the kernel calibration in L1-SPIRiT. L1-SPIRiT reconstruction results in time-resolved 3D volume of the pharyngeal airway as indicated in the bottom block. [Color figure can be viewed in the online issue, which is available at wileyonlinelibrary.com.]
Mask pressure, heart rate, oxygen saturation, respiratory effort from the respiratory transducer, and MRI RF unblank signals were all monitored and recorded with a sample rate of 25 ms on a WinDAQ software (DATAQ Instruments Inc., Akron, OH). Displacement of the abdomen from the respiratory bellows was monitored in the MRI console, and the signal was recorded only in the presence of MRI scanning and with a sample rate of 25 ms. The synchronization of MRI video and relevant physiological signals was made based on the onset of the RF unblank signal, which is available from the WinDAQ software.
Measurement of Airway Volume Dynamics
From reconstructed 4D dataset, we performed image segmentation and obtained a time series of pharyngeal airway volume. The airway coverage we chose for airway segmentation was from the level of the hard palate to the level of the epiglottis. The segmentation algorithm was a modified version of region growing, which is based on seeded region growing (27) and is available from http://www.mathworks.com. In our implementation, the segmentation was performed slice-by-slice in a semiautomatic manner. In a given axial slice, seed points were manually selected in the airway region of interest (ROI) from an initial image frame, and the same seed points were used in the next image frames. If the intensity on any seed point was greater than a certain threshold, the seed point was identified as the soft tissue and was not included in the region growing process. Volumetric segmentation results were obtained after stacking the segmented axial slices. Airway volume measurement at each time frame was performed by the multiplication of the number of segmented voxels by voxel volume (e.g., 1.6 × 1.6 × 1.6 mm3 for the short scan).
Normal Volunteers
Three adult volunteers (3M, 25–35 years old) participated in the study. They reported that they had no sleep disorders and no excessive daytime sleepiness. Informed consent was obtained according to the University of Southern California (USC) Institutional Review Board. All subjects were informed of the airway occlusion task prior to the study.
Pediatric Patients
We recruited adolescents with a history of snoring during nocturnal sleep. More specifically, patient selection was based on the presence of obesity (BMI percentile > 90% for age and gender) with an age range from 13 to 17 years. The presence of sleep-disordered breathing was documented by overnight polysomnography performed at the Children’s Hospital Los Angeles (CHLA). Subjects were excluded if they had metallic dental bracing or any ferromagnetic materials that would hamper the image quality. Informed consent from the parents and assent from the subject were obtained according to the CHLA and USC Institutional Review Boards. Five pediatric patients (2M/3F, 13–15 years old) participated in the study and were informed of the airway occlusion task prior to the study.
MRI experiments on the pediatric patients were performed during the nighttime between 9 pm and 1 am. Sleep and wakefulness were determined based on the heart rate, mask pressure, oxygen saturation, and respiratory signals by our experienced pediatric pulmonologists. A central apneic event was defined to be the absence of abdominal motion as well as zero mask pressure recording, both lasting longer than the duration of two baseline breaths, whereas an obstructive apneic event would be characterized by a zero mask pressure recording lasting longer than the duration of two breaths with continued respiratory effort reflected in the abdominal motion sensor.
RESULTS
The proposed imaging method provided good image quality with sharp depiction of air-tissue boundaries in the entire pharyngeal airway with sub-second temporal resolution (i.e., 2.6 fps for the short scan and 1.7 fps for the long scan) in seven of the eight subjects. Data from volunteer 2 revealed periodic motion of the soft palate depending on the respiratory cycle during mouth breathing. Data from patient 1 showed central sleep apneic events and airway obstruction at the retropalatal region. Data from patient 3 revealed airway obstructions in the retropalatal and hypopharyngeal regions after a sigh breath. Data from patient 5 revealed airway narrowing during central sleep apneic events with periodic breathing. Patient 2 signaled during the MRI that the procedure was not tolerable due to the loud acoustic noise, and the testing was immediately terminated. Data from patient 2 revealed severe motion artifact and was excluded from subsequent analysis.
Temporal Signal Variation
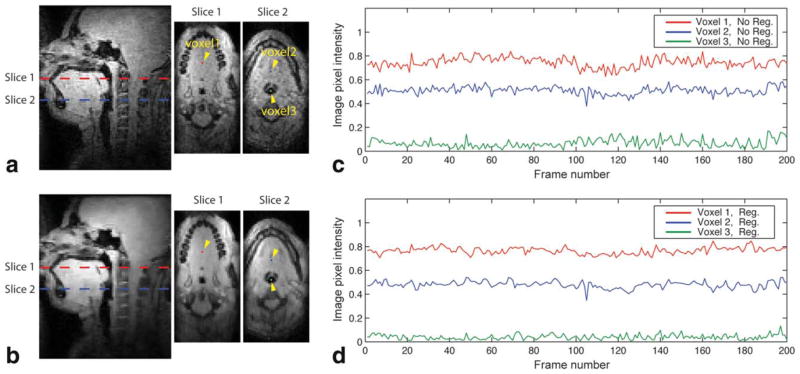
Figure 4 shows an assessment of temporal variation in signal intensity and demonstrates the effect of the L1-norm regularization on temporal signal change in the air and soft tissue. A pediatric subject performed tidal breathing with minimal motion for the frames of interest in Figure 4c,d. These frames were chosen to exclude tissue motion as a primary contributing factor to temporal signal variation. It is noted that the mid-sagittal and two axial images obtained with the L1-norm regularized image reconstruction (see Fig. 4b) reveal more spatially smooth image intensity in the soft tissue than those without regularization (see Fig. 4a), and they preserve the depiction of high-contrast features such as air–tissue boundaries. In comparing temporal signal changes between no regularization (see Fig. 4c) and regularization (see Fig. 4d), signal fluctuation is observed in both cases and the degree of fluctuation is reduced in the case of regularization for all three voxels of interest. The mean and standard deviation of the soft-tissue (voxel 1) signal time series at the retropalatal slice (slice 1 in Fig. 4) was 0.744 ± 0.042 for the no regularization case and 0.766 ± 0.028 for the regularization case. The mean and standard deviation of the soft-tissue (voxel 2) signal time series at the retroglossal slice (slice 2 in Fig. 4) was 0.510 ± 0.033 for the no regularization case and 0.480 ± 0.029 for the regularization case. The mean and standard deviation of the air (voxel 3) signal time series was 0.067 ± 0.035 for the no regularization case and 0.040 ± 0.021 for the regularization case.
FIG. 4.
The effect of regularization on temporal signal variation. In image frames of interest, a pediatric subject (patient 4) performed tidal breathing with minimal motion. a,b: Mid-sagittal and two axial images are shown. a: No regularization (i.e., parallel imaging only). b: Regularization with wavelets and finite difference sparsity in spatial and temporal dimensions (i.e., parallel imaging and constrained reconstruction). Note that the images in (b) reveal more spatially smooth image intensity in the soft tissue than those in (a), while preserving air–tissue boundaries. Three voxels were chosen in the retropalatal (slice 1) and retroglossal (slice 2) slices, and are indicated by the dots and yellow arrowheads. c,d: Comparison of temporal signal changes in the chosen voxels (c) without regularization and (d) with regularization. Note that signal fluctuations are observed in both cases, and the degree of fluctuation is reduced in the case of regularization (compare (c) and (d)).
Volunteer Study
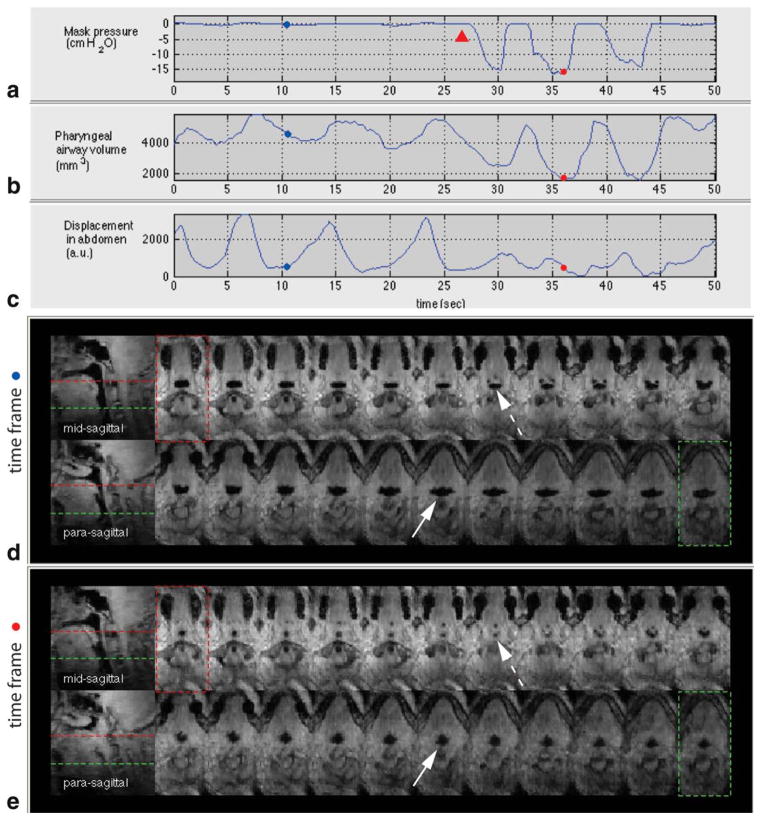
Pharyngeal airway narrowing during inspiratory loading was visualized in all three normal volunteers. Airway volume estimates corresponding to the plateaus of the airway volume time series were averaged to obtain the average airway volume on expiration (VE). Airway volume estimates corresponding to the nadirs were averaged to obtain the average airway volume on inspiratory load (VIL). Average airway volume reduction was computed to be (VE − VIL)/VE × 100, and resulted in 63.3% (volunteer 1), 52.5% (volunteer 2), and 33.7% (volunteer 3).
Figure 5 shows results from volunteer 1 who showed the most marked reduction of the pharyngeal airway during inspiratory loading among the three volunteers. The mask pressure recording in Figure 5a reveals that the onset of inspiratory loading resulting from an external airway occlusion is approximately 27 s. Figure 5b shows a plot of pharyngeal airway volume with respect to time, in which the airway volume reduction is significant during inspiratory load. The plot of displacement in the abdomen in Figure 5c indicates that tidal breathing is disrupted around the onset of inspiratory loading. Figure 5d,e shows 2 sagittal and 22 contiguous axial views of the airway at two individual time frames. Figure 5d shows a patent airway in the expiratory phase in the absence of airway occlusion. Figure 5e shows a narrowed airway in the inspiratory phase in the presence of airway occlusion. The cross-sectional areas of the airway vary more significantly during inspiratory loading than during tidal breathing (see the Supporting Information movie 1). The most narrowed airway site is observed in the retro-palatal region (see the dashed arrow in Fig. 5e).
FIG. 5.
Physiological signals and pharyngeal airway dynamics in an airway occlusion test on a healthy volunteer (volunteer 1). a: Mask pressure recording, b: pharyngeal airway volume measurement, and c: respiratory effort in the abdomen. Note the correlation between the mask pressure drop during inspiratory load and pharyngeal airway volume reduction. Representative axial and sagittal slices at (d) time frame (indicated by blue dots in (a–c)) corresponding to an expiratory phase without inspiratory load and (e) time frame (indicated by red dots in (a–c)) corresponding to an inspiratory phase during an external airway occlusion (onset of the occlusion indicated by red arrowhead in (a)). Note the markedly narrowed cross-sectional airway at the retropalatal slice as indicated by the dashed arrow in (e). The airway is more compliant laterally than along the anterior–posterior during inspiratory load (compare the solid arrows in (d) and (e)). See also the Supporting Information movie 1. [Color figure can be viewed in the online issue, which is available at wileyonlinelibrary.com.]
Patient Study
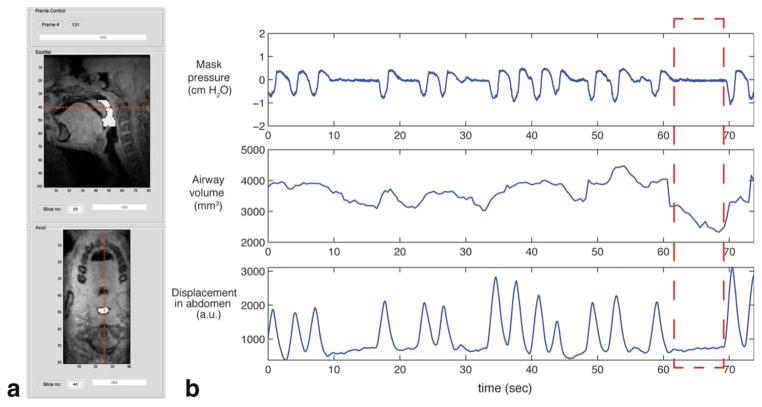
Figure 6 shows a time series of pharyngeal airway volume, which is synchronous with the mask pressure and respiratory signal recordings in patient 5 with sleep-disordered breathing (15-year-old male, BMI = 32). Figure 6a shows a segmented airway region (indicated by white color) in mid-sagittal and retropalatal axial images at a certain time frame. The red dashed lines in each image indicate relative slice location with respect to each other. Figure 6b indicates that there are two central apneic events in which one occurs from 10 to 17 s and the other occurs from 62 to 69 s. The most narrowed pharyngeal airway occurs near the end of the central apneic event (i.e., 68 s), and the airway volume is estimated to be 2324 mm3, 44% lower than the peak volume 4475 mm3.
FIG. 6.
Pharyngeal airway reduction during central apneic events in a pediatric patient (patient 5). a: A segmented pharyngeal airway ROI (i.e., white color overlaid onto the images) is shown in midsagittal slice and retropalatal axial slice at a certain time frame from a custom image inspection graphical user interface. b: A plot of pharyngeal airway volume (middle) is shown along with measured mask pressure (top) and abdominal respiratory effort (bottom). A significant drop in pharyngeal airway volume is seen during central apneic event (see the red dashed box). See also the Supporting Information movie 2. [Color figure can be viewed in the online issue, which is available at wileyonlinelibrary.com.]
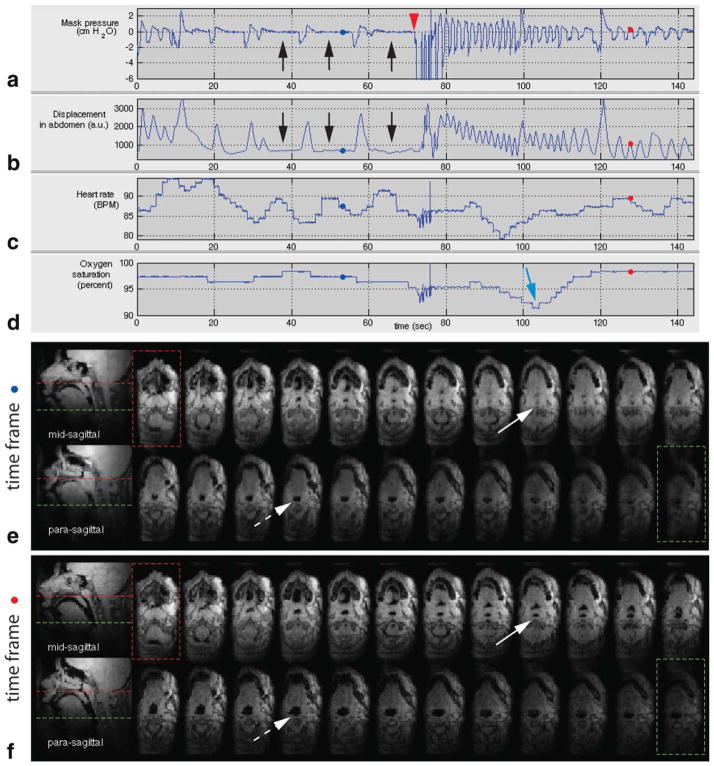
Figure 7 shows results from the long-duration scan of patient 1 with sleep-disordered breathing (14-year-old female, BMI = 45). The first 140 s of the scan is shown in Figure 7. Figure 7a,b shows central apneic events as evidenced by zero mask pressure and no change in the displacement of the abdomen (see black arrows). Note that heart rate is periodic during the apneic events from 30 to 70 s (see Fig. 7c). At approximately 70 s, the experimenter performed airway occlusion and there was the large negative pressure recording on inspiration (see Fig. 7a). This inspiratory load led to the subject’s tidal breathing as evidenced by the periodic nature of the mask pressure recording and respiratory effort (see Fig. 7a,b, the pressure and respiratory effort plots in 80 to 140 s). The oxygen saturation nadir following the airway occlusion, as indicated by the blue arrow in Figure 7d, shows a 7–8% drop.
FIG. 7.
Physiological signals and pharyngeal airway dynamics on a pediatric patient (patient 1) with sleep-disordered breathing. a: Mask pressure recording, b: respiratory effort in the abdomen, c: heart rate, and d: oxygen saturation signals. Central apneic events are indicated by the black arrows in (a) and (b), followed by an external airway occlusion (indicated by the red arrow head) lasting approximately 6 s. Oxygen desaturation is indicated by the blue arrow in (d). Representative axial and sagittal slices at (e) time frame (indicated by blue dots in (a–d)) corresponding to central sleep apnea event and (f) time frame (indicated by red dots in (a–d)) corresponding to normal breathing. Note the airway obstruction at the retropalatal region as indicated by the solid arrow in (e). During central apnea, a significant narrowing in the airway is observed in the retroglossal slice (compare the dashed arrows in (e) and (f)). See also the Supporting Information movie 3. [Color figure can be viewed in the online issue, which is available at wileyonlinelibrary.com.]
Figure 7e,f shows 2 sagittal slices and 24 contiguous axial views of the pharyngeal airway at two individual time frames. Figure 7e contains an airway obstruction during central apneic event. Figure 7f contains a patent airway during normal breathing. Airway collapse site is observed in the retropalatal region as indicated by the solid arrow in Figure 7e (compare it with the solid arrow in Fig. 7f in which the airway is patent in the same slice location). Note that the airway is patent at the level of retroglossal slice (see the dashed arrow in Fig. 7e) and the cross-sectional area is smaller during central apneic event than during normal breathing (compare the dashed arrows in Fig. 7e,f).
DISCUSSION
To our knowledge, we have produced the first dynamic 3D visualization of upper airway obstruction during natural sleep from real-time MRI data without respiratory gating. This occurred during central apneic events in a pediatric patient. The proposed method demonstrates a way to identify airway obstruction sites by the use of a real-time 3D MRI acquisition and simultaneously acquired physiological signals. We utilized devices from third-party vendors for the airway occlusion and physiological signal recording. The MRI RF unblank signal, which was recorded synchronously with physiological signals on the same software, facilitated their synchronization with the MRI image frames.
In this work, the pulse sequence involved the use of maximum gradient amplitude and slew rate for all gradient pulses. While most new high-performance scanners can operate continuously at a high duty cycle, the majority of existing scanners can experience gradient amplifier overheating when using long and continuous scanning approaches. In addition, the scans were loud, which negatively affects patient comfort. For the long-duration continuous scan in this study, we increased TR to mitigate acoustic noise as well as gradient heating. The choice of TR for the long scan was empirical, and the side effect was lowered temporal resolution. Real-time acquisition for sleep MRI study may be improved with the development of a systematic way to design pulse sequence based on the constraints of the limits of sound pressure level and gradient heating.
Although obstructive sleep apnea is the most common type of sleep apnea, we have not yet observed any obstructive apneic events from the pediatric patients in our MRI experiments. This may be due to the fact that the subjects had light sleep in MRI environment or the continuous MRI scan time of 18 min was not sufficiently long. MRI studies with larger number of OSA patients and longer MRI scan per patient would be necessary to observe obstructive events in pediatric patients. Given that we have observed only cases of central apneic events in our patient cohort, we would like to emphasize that CSAs have been reported in 17% of obese children (3), suggesting a high prevalence of CSAs in obese children. In case that the patient had high apnea-hypopnea index from our overnight polysomnography study, we attempted rescanning until we detected respiratory events. Repeated on/off of the scanning may contribute to patients’ discomfort. For future work, we plan to increase the scan time while managing the gradient amplifier heating issue.
The image quality from the pediatric patients was in general poorer than the image quality from the volunteers in this study, particularly in the hypopharyngeal region. Although signal-to-noise ratio (SNR) measurement is not rigorously defined for images obtained from regularized reconstruction, we performed an SNR comparison between the patients and normal volunteers. The SNR in the hypopharyngeal region was calculated by taking the ratio of mean signal intensity of an inferior portion of the tongue to the standard deviation of airway ROI in the mid-sagittal slice of a steady-state and motion-free image frame obtained from the short-scan protocol. The SNR had a range from 7.1 to 21.1 in the pediatric patients, compared with a range from 10.4 to 43.4 in the normal adult volunteers. The lower SNR in the inferior region of the pediatric airway may be attributed to the shorter neck length and the larger neck fat thickness, due to obesity. In the pediatric subjects, it was difficult to place the six-channel carotid coil close to the pharyngeal airway.
The 4D L1-SPIRiT reconstruction performs kernel calibration using fully sampled low-resolution data available from adjacent temporal frames (e.g., 30 frames in our case). When there is a rapid motion such as swallowing and jaw movement within the temporal frames, resulting reconstruction can suffer from image artifacts due to motion. Other adjacent frames within the reconstruction window, which are not supposed to undergo severe motion, can also suffer from artifacts due to motion. Adaptive selection of temporal window, based on the knowledge of temporal interval corresponding to motion, has the potential to improve overall image quality, and its implementation remains as future work.
As in Figure 4, a large degree of temporal variation in signal intensity is noted from image frames reconstructed without regularization. Thermal noise contributes to the temporal signal fluctuation. Another potential source of temporal variation would be residual aliasing, which is expected to vary in time given that the undersampling pattern of the 3DFT golden-angle sampling varies at every frame (see Fig. 3). The regularization related to temporal sparsity enabled mitigation of the degree of temporal signal variation. The regularization of the spatial domain tended to smooth out either noise or low-contrast features and to preserve high-contrast features such as air–tissue boundaries. The regularization in both spatial and temporal sparsity was effective in improving the performance of the region growing segmentation of the pharyngeal airway.
The proposed acquisition scheme adopts a golden-angle radial spokes view order and therefore is well suited to efficient data binning when considering respiratory gated cine imaging during tidal breathing, which Arens et al. and Wagshul et al. have demonstrated in their work (13,14). High temporal resolution respiratory-gated cine data would potentially provide useful information about change of the pharyngeal airway volume depending on respiratory phase in pediatric patients with sleep-disordered breathing.
The current acquisition setup does not allow for objective assessment of sleep state. Polysomnography methods employ electroencephalogram (EEG) recordings for sleep state assessment. We have found it difficult to use EEG during sleep MRI, with subjects citing discomfort and difficulty falling asleep inside the MRI scanner with EEG electrodes on the scalp. It may be worthwhile to investigate an alternative such as sleep staging with electroocular recording in which signals are from the electrodes attached to the forehead only (28).
In this work, MRI data were acquired in real time, but visualization of the pharyngeal airway dynamics was demonstrated after an off-line image reconstruction. Opportunities for future work include accelerating the reconstruction (e.g., via parallelization (29)) and investigating the feasibility of real-time interactive 3D imaging.
CONCLUSIONS
A novel real-time 3D MRI method is proposed that is capable of identifying sites of upper airway collapse during sleep. The key features of the method are (1) high spatio-temporal resolution using a 3DFT golden-angle radial spokes view order and L1-SPIRiT reconstruction, (2) continuous MR scanning that is compatible with natural sleep, and (3) synchronized recording of physiological signals that are used to identify apneas and related events. Initial results indicate that the method can identify airway collapse sites in 3D during natural sleep in patients with CSA. We speculate that this technique could have the potential to inform therapeutic choices for sleep-disordered breathing, such as positive airway pressure devices or surgery.
Supplementary Material
Acknowledgments
The authors thank Ximing Wang for his help with data collection, Leonardo Nava, Aaron Bernardo, and Winston Tran for their help with the occlusion devices, and Drs. Roberta Kato and Shirleen Loloyan for their help with patient recruitment, consent, and image interpretation.
Grant sponsor: National Institutes of Health; Grant number: R01-HL105210
Footnotes
A preliminary version of this manuscript was presented at ISMRM 2012, Abstract #4233.
Additional Supporting Information may be found in the online version of this article.
References
- 1.Malhotra A, White DP. Obstructive sleep apnea. Lancet. 2002;360:237–245. doi: 10.1016/S0140-6736(02)09464-3. [DOI] [PubMed] [Google Scholar]
- 2.Arens R, Marcus CL. Pathophysiology of upper airway obstruction: a developmental perspective. Sleep. 2004;27:997–1019. doi: 10.1093/sleep/27.5.997. [DOI] [PubMed] [Google Scholar]
- 3.Verhulst SL, Schrauwen N, Haentjens D, Suys B, Rooman RP, Van Gaal L, De Backer WA, Desager KN. Sleep-disordered breathing in overweight and obese children and adolescents: prevalence, characteristics and the role of fat distribution. Arch Dis Childhood. 2007;92:205–208. doi: 10.1136/adc.2006.101089. [DOI] [PMC free article] [PubMed] [Google Scholar]
- 4.Schwartz AR, Patil SP, Laffan AM, Polotsky V, Schneider H, Smith PL. Obesity and obstructive sleep apnea pathogenic mechanisms and therapeutic approaches. Proc Am Thorac Soc. 2008;5:185–192. doi: 10.1513/pats.200708-137MG. [DOI] [PMC free article] [PubMed] [Google Scholar]
- 5.Badr MS, Toiber F, Skatrud JB, Dempsey J. Pharyngeal narrowing/occlusion during central sleep apnea. J Appl Physiol. 1995;78:1806–1815. doi: 10.1152/jappl.1995.78.5.1806. [DOI] [PubMed] [Google Scholar]
- 6.Kuzniar TJ, Morgenthaler TI. Treatment of complex sleep apnea syndrome. Chest. 2012;142:1049–1057. doi: 10.1378/chest.11-3223. [DOI] [PubMed] [Google Scholar]
- 7.Rama AN, Tekwani SH, Kushida CA. Sites of obstruction in obstructive sleep apnea. Chest. 2002;122:1139–1147. doi: 10.1378/chest.122.4.1139. [DOI] [PubMed] [Google Scholar]
- 8.Isono S, Shimada A, Tanaka A, Tagaito Y, Utsugi M, Konno A, Nishino T. Efficacy of endoscopic static pressure/area assessment of the passive pharynx in predicting uvulopalatopharyngoplasty outcomes. Laryngoscope. 1999;109:769–774. doi: 10.1097/00005537-199905000-00016. [DOI] [PubMed] [Google Scholar]
- 9.Ng AT, Qian J, Cistulli PA. Oropharyngeal collapse predicts treatment response with oral appliance therapy in obstructive sleep apnea. Sleep. 2006;29:666–671. [PubMed] [Google Scholar]
- 10.Faber CE, Grymer L. Available techniques for objective assessment of upper airway narrowing in snoring and sleep apnea. Sleep Breath. 2003;7:77–86. doi: 10.1007/s11325-003-0077-9. [DOI] [PubMed] [Google Scholar]
- 11.Schwab RJ, Pasirstein M, Pierson R, Mackley A, Hachadoorian R, Arens R, Maislin G, Pack AI. Identification of upper airway anatomic risk factors for obstructive sleep apnea with volumetric magnetic resonance imaging. Am J Respir Crit Care Med. 2003;168:522–530. doi: 10.1164/rccm.200208-866OC. [DOI] [PubMed] [Google Scholar]
- 12.Arens R, Sin S, McDonough JM, Palmer JM, Dominguez T, Meyer H, Wootton DM, Pack AI. Changes in upper airway size during tidal breathing in children with obstructive sleep apnea syndrome. Am J Respir Crit Care Med. 2005;171:1298–1304. doi: 10.1164/rccm.200411-1597OC. [DOI] [PMC free article] [PubMed] [Google Scholar]
- 13.Arens R, Lipton ML, Sin S, Wagshul ME. Dynamics of the upper airway and application to sleep apnea. Proceedings of the 19th Annual Meeting of ISMRM; Montreal, Canada. 2011; p. Abstract 2502. [Google Scholar]
- 14.Wagshul ME, Sin S, Lipton ML, Shifteh K, Arens R. Novel retrospective, respiratory-gating method enables 3D, high resolution, dynamic imaging of the upper airway during tidal breathing. Magn Reson Med. 2013;70:1580–1590. doi: 10.1002/mrm.24608. [DOI] [PMC free article] [PubMed] [Google Scholar]
- 15.Donnelly LF. Obstructive sleep apnea in pediatric patients: evaluation with cine MR sleep studies. Radiology. 2005;236:768–778. doi: 10.1148/radiol.2363040306. [DOI] [PubMed] [Google Scholar]
- 16.Moon IJ, Han DH, Kim JW, Rhee CS, Sung MW, Park JW, Kim DS, Lee CH. Sleep magnetic resonance imaging as a new diagnostic method in obstructive sleep apnea syndrome. Laryngoscope. 2010;120:2546–2554. doi: 10.1002/lary.21112. [DOI] [PubMed] [Google Scholar]
- 17.Barrera JE. Sleep magnetic resonance imaging: Dynamic characteristics of the airway during sleep in obstructive sleep apnea syndrome. Laryngoscope. 2011;121:1327–1335. doi: 10.1002/lary.21810. [DOI] [PubMed] [Google Scholar]
- 18.Shin LK, Holbrook AB, Chang CE, Santos JM, Fischbein NJ, Capasso R, Kushida CA. Real-time MRI with synchronous polysomnography of the upper airway in patients with obstructive sleep apnea. Proceedings of the 19th Annual Meeting of ISMRM; Montreal, Canada. 2011; p. Abstract 4634. [Google Scholar]
- 19.Shin LK, Holbrook AB, Capasso R, Kushida CA, Powell NB, Fischbein NJ, Pauly KB. Improved sleep MRI at 3 tesla in patients with obstructive sleep apnea. J Magn Reson Imag. 2013;38:1261–1266. doi: 10.1002/jmri.24029. [DOI] [PubMed] [Google Scholar]
- 20.Colrain I, Nayak KS, Nielsen JF. Real-time MRI of upper airway collapse during inspiratory loading. Proceedings of the 14th Annual Meeting of ISMRM; Seattle, Washington, USA. 2006; p. Abstract 2417. [Google Scholar]
- 21.Kim Y-C, Wang X, Tran W, Khoo MCK, Nayak KS. Measurement of upper airway compliance using dynamic MRI. Proceedings of the 20th Annual Meeting of ISMRM; Melbourne, Australia. 2012; p. Abstract 3688. [Google Scholar]
- 22.Winkelmann S, Schaeffter T, Koehler T, Eggers H, Doessel O. An optimal radial profile order based on the golden ratio for time-resolved MRI. IEEE Trans Med Imag. 2007;26:68–76. doi: 10.1109/TMI.2006.885337. [DOI] [PubMed] [Google Scholar]
- 23.Doneva M, Stehning C, Nehrke K, Bornert P. Improving scan efficiency of respiratory gated imaging using compressed sensing with 3D Cartesian golden angle sampling. Proceedings of the 19th Annual Meeting of ISMRM; Montreal, Canada. 2011; p. Abstract 641. [Google Scholar]
- 24.Lustig M, Pauly JM. SPIRiT: Iterative self-consistent parallel imaging reconstruction from arbitrary k-space. Magn Reson Med. 2010;64:457–471. doi: 10.1002/mrm.22428. [DOI] [PMC free article] [PubMed] [Google Scholar]
- 25.Lebel RM, Jones J, Ferre J-C, Valencerina S, Nayak KS, Law M. Highly accelerated dynamic contrast enhanced imaging with prospective undersampling. Proceedings of the 20th Annual Meeting of ISMRM; Melbourne, Australia. 2012; p. Abstract 10. [Google Scholar]
- 26.Lustig M, Donoho D, Pauly JM. Sparse MRI: The application of compressed sensing for rapid MR imaging. Magn Reson Med. 2007;58:1182–1195. doi: 10.1002/mrm.21391. [DOI] [PubMed] [Google Scholar]
- 27.Adams R, Bischof L. Seeded region growing. Pattern Analysis and Machine Intelligence IEEE Trans. 1994;16:641–647. [Google Scholar]
- 28.Levendowski DJ, Popovic D, Berka C, Westbrook PR. Retrospective cross-validation of automated sleep staging using electroocular recording in patients with and without sleep disordered breathing. Intnl Archiv Med. 2012;5:21. doi: 10.1186/1755-7682-5-21. [DOI] [PMC free article] [PubMed] [Google Scholar]
- 29.Murphy M, Alley M, Demmel J, Keutzer K, Vasanawala S, Lustig M. Fast l1-SPIRiT compressed sensing parallel imaging MRI: scalable parallel implementation and clinically feasible runtime. IEEE Trans Med Imag. 2012;31:1250–1262. doi: 10.1109/TMI.2012.2188039. [DOI] [PMC free article] [PubMed] [Google Scholar]
Associated Data
This section collects any data citations, data availability statements, or supplementary materials included in this article.


