

Abstract
The accumulation of serpin oligomers and polymers within the endoplasmic reticulum (ER) causes cellular injury in patients with the classical form α1-antitrypsin deficiency (ATD). To better understand the cellular and molecular genetic aspects of this disorder, we generated transgenic C. elegans strains expressing either the wild-type (ATM) or Z mutant form (ATZ) of the human serpin fused to GFP. Animals secreted ATM, but retained polymerized ATZ within dilated ER cisternae. These latter animals also showed slow growth, smaller brood sizes and decreased longevity; phenotypes observed in ATD patients or transgenic mouse lines expressing ATZ. Similar to mammalian models, ATZ was disposed of by autophagy and ER-associated degradation pathways. Mutant strains defective in insulin signaling (daf-2) also showed a marked decrease in ATZ accumulation. Enhanced ATZ turnover was associated with the activity of two proteins central to systemic/exogenous (exo)-RNAi pathway: the dsRNA importer, SID-1 and the argonaute, RDE-1. Animals with enhanced exo-RNAi activity (rrf-3 mutant) phenocopied the insulin signaling mutants and also showed increased ATZ turnover. Taken together, these studies allude to the existence of a novel proteostasis pathway that mechanistically links misfolded protein turnover to components of the systemic RNAi machinery.
INTRODUCTION
The classical form of α1-antitrypsin deficiency (ATD) causes lung and liver disease and is representative of an expanding group of conformational diseases—the pathological deposition of aggregated proteins in their non-native conformations (1). Although ATD has been associated with over 90 different mutations, the Z allele is the most common pathological variant (2). The poorly secreted mutant protein in ATZ homozygotes (PiZZ patients) results in lung and liver disease by distinct loss-of- and gain-of-function mechanisms, respectively (3). Loss of the major circulating protease inhibitor in the blood predisposes the lung to emphysema, whereas the intracellular accumulation and aggregation of ATZ within the endoplasmic reticulum (ER) lumen causes hepatic fibrosis, cirrhosis and/or hepatocellular carcinoma (4). ATD is one of the most common genetic causes of liver disease and the leading genetic diagnosis for children undergoing pediatric liver transplantation (4,5).
Although the primary genetic defect underlying ATD is well defined, PiZZ patients show a wide variation in disease phenotype, with 10–15% developing significant liver disease over the first 20 years of life (6,7). We hypothesized that a subgroup of PiZZ children are ‘susceptible’ to liver injury by genetic modifiers or environmental factors, which produce subtle defects in the proteostasis network (8). For example, these modifiers could alter the interaction of ATZ with ER molecular chaperones or degradation pathways thereby leading to further accumulation in the ER with greater potential for liver injury. These modifiers could also involve alterations in the protective cellular response pathways activated by ATZ accumulation (reviewed in 9).
Although genetic variants within the ER quality control apparatus may serve as disease modifiers, there are relatively limited data validating their effects on the hepatic phenotype in ATD. Moreover, the systematic identification and validation of hepatic disease modifiers are confounded by the lack of robust experimental systems facilitating their interrogation in vivo. Thus, we sought to determine whether a more tractable genetic organism, such as C. elegans, could be used to model the cellular pathology of ATD, and thereby provide a platform for the systematic genome-wide evaluation of modifier genes affecting the clearance of ATZ. Animals expressing wild-type AT (ATM) secrete the protein and show no ill effects, whereas those animals expressing ATZ developed intracellular inclusions and showed slow growth and decreased longevity. Moreover, these animals disposed of ATZ using proteostasis pathways remarkably similar to those used by vertebrate models of ATZ accumulation. Finally, using this model, we determined that reduced insulin/insulin-like growth factor signaling (IIS) was a modifier of ATZ accumulation. Surprisingly, however, deceased IIS was associated with increased ATZ turnover that was linked to components of the RNAi pathway. Taken together, these data validated the use of C. elegans to model the cellular dysfunction associated with ATZ aggregation and to identify novel disease-modifying proteostasis pathways.
RESULTS
AT expression in C. elegans
We used a transgenic approach to determine whether C. elegans strains expressing the misfolded human protein, ATZ, could model aspects of hepatocellular injury observed in ATD patients. We constructed a series of quadripartite transgenes containing: (i) the nhx-2 promoter (Pnhx-2), (ii) an N-terminal signal peptide linked to GFP (sGFP), (iii) the ATM or ATZ cDNA containing four synthetic introns, and (iv) the 3′ UTR and polyadenylation signal from unc-54 (Supplementary Material, Fig. S1). Since intestinal cells assume many of the biosynthetic and detoxification functions of hepatocytes, of which the latter are lacking in C. elegans (10), we used the Pnhx-2 element to drive intestinal cell-specific transgene expression (11). sGFP fused to the N-termini of serpins permitted tracking of the human serpins in real-time, while not interfering with their proper folding or inhibitory function (12,13). The main AT-expressing transgenic strains were generated by microinjecting either the Pnhx-2sGFP::ATM or Pnhx-2sGFP::ATZ plasmid along with the pharyngeal co-expression marker, Pmyo-2mRFP (14), and selecting for fluorescent red heads and green bodies, respectively. Several of the transgene arrays were integrated by gamma-irradiation, with different insertion sites verified by single nucleotide polymorphism mapping (15) (Supplementary Material, Table S1). Semi-quantitative immunoblotting, quantitative fluorescence ArrayScan VTI imaging and quantitative real-time PCR (qRT-PCR) were used to assess relative ATM/Z expression levels, and to select representative strains for more detailed analysis (Supplementary Material, Fig. S1).
Initially, we examined adult animals to determine whether the transgene expression patterns were anatomically correct based on the nhx-2 promoter (Fig. 1). Animals with the Pnhx-2GFP transgene showed a diffuse fluorescence pattern within intestinal cell cytoplasm (Fig. 1A and B, white arrowheads point to intestinal cell plasma membrane in all panels). The Pnhx-2sGFP or Pnhx-2sGFP::ATM transgenic animals secreted the protein into the pseudo-coelomic space (Fig. 1C–F; respectively, asterisk). In contrast, no fusion protein was detected in the pseudo-coelomic space of Pnhx-2sGFP::ATZ transgenic animals (Fig. 1G and H). Rather, the fusion protein appeared as intracellular inclusions (Fig. 1G and H, red arrowheads). DIC imaging of the Pnhx-2sGFP::ATZ, when compared with the sGFP::ATM expressing animals, showed circumscribed oval areas of cytoplasmic clearing amidst the dense population of gut granules (Fig. 1G, red arrowheads). These areas corresponded to the accumulations of GFP fluorescing material. Since free sGFP was never detected on immunoblots, we concluded that these inclusions contained sGFP::ATZ. This phenotype was specific for ATZ and was not attributable to either the sGFP motif or intestinal cell expression per se. Animals expressing sATZ (but not sATM) without GFP (Pnhx-2sATZ/M; Supplementary Material, Fig. S1) in intestinal cells (Fig. 1I and J, respectively) or sGFP::ATZ (but not sGFP::ATM) (Psrp-2sGFP::ATZ/M; Supplementary Material, Fig. S1) in hypodermal seam cells (Fig. 1K and L, respectively) showed similar cytoplasmic inclusions as visualized by DIC and fluorescence microscopy (red arrowheads; note inset in Fig. 1K), respectively. Interestingly, Psrp-2sGFP::ATM animals secreted the fusion protein, which appeared within the cuticular annuli (Fig. 1L, white arrows) (16). High-resolution, whole-animal confocal images are available in Supplementary Material, Fig. S2.
Figure 1.

Imaging of transgenic animals expressing (s)GFP::AT transgenes. Widefield DIC and fluorescence images of animals expressing GFP (A and B), sGFP (C and D), sGFP::ATM (E and F) or sGFP::ATZ (G and H) under the control of the intestine-specific nhx-2 promoter. White arrowheads and asterisks highlight intestinal cell plasma membrane and pseudo-coelomic space, respectively. Red arrows show intracellular, sGFP::ATZ-positive inclusions. DIC images of sATZ (I) or sATM (J) in the intestine. Intracellular inclusions containing ATZ are highlighted with a red arrowhead (I). Confocal images of hypodermal seam cells of animals expressing sGFP::ATZ (K) or sGFP::ATM (L) under the control of the srp-2 promoter. Images are maximum intensity projections of all the z-stacks. Blue dashed lines delineate worm cuticle (K), which was not visible at this exposure. Note the presence of a large intracellular inclusion in the seam cell of an animal expressing sGFP::ATZ (K, inset, red arrowhead) and secreted protein in the cuticular annuli of an animal expressing sGFP::ATM (L, white arrows). Scale bar, 20 µm.
sGFP::ATZ accumulation induced abnormal phenotypes
To determine whether expression of sGFP::ATM or sGFP::ATZ affected the overall health and well-being of the animals, we assessed growth, brood size and longevity (Fig. 2). In comparison with wild-type (N2) animals, sGFP::ATM expressing animals showed a mild slow growth phenotype (Gro) 48 h after hatching (Fig. 2A). In contrast, sGFP::ATZ expressing animals showed a marked decrease in growth in comparison with both strains (Fig. 2A and B). Due to Gro, the time required for over 90% of the Pnhx-2sGFP::ATZ animals to reach the young-adult (egg laying) stage increased from ∼48 (N2) to ∼72–96 h. Similarly, Pnhx-2sGFP::ATZ animals showed ∼39% decrease in brood size (Fig. 2C) and ∼40% decrease in lifespan (Fig. 2D) when compared with N2 and sGFP::ATM expressing animals. Of note, all three of these abnormal phenotypes were temperature-dependent within the tested range of 16–27°C, with the greatest penetrance observed at higher temperatures.
Figure 2.

Phenotypes associated with animals expressing sGFP::ATZ. Animals expressing sGFP::ATZ displayed developmental abnormalities as assessed by slow growth (Gro) throughout larval development (A). Animals were classified as slow growing if they had not reached the L4 stage by 48 h. DIC images of N2 (B, i) and sGFP::ATZ (B, ii) animals 48 h post egg lay. Black arrows point to slow growing sGFP::ATZ animals (B, ii). Brood size of N2, sGFP::ATM and sGFP::ATZ animals (C). Significance determined using an unpaired, two-tailed, Student's t-test, *P < 0.05, ***P < 0.001. Kaplan–Meier survival curves of N2 (black), sGFP::ATM (dark gray) and sGFP::ATZ (light gray) animals (D). Survival of sGFP::ATZ animals was significantly shorter than that of N2 animals (Mantel–Cox log-rank test, P < 0.001).
sGFP::ATZ accumulated within the ER
To determine the subcellular localization of the ATZ-containing inclusions, we examined young adult animals by transmission electron microscopy. The intestinal cells of sGFP::ATM-expressing animals appeared normal (Fig. 3A). In contrast, those expressing sGFP::ATZ showed large homogenous tubulo-vesicular inclusions studded with ribosomes (Fig. 3B–D, black arrowheads). These images suggested that sGFP::ATZ was accumulating within the ER, and they were indistinguishable from those observed in hepatocytes from ATD patients (17). To confirm that sGFP::ATZ was retained within the ER, we generated a transgenic line also expressing DsRed fused to an ER-retention signal, KDEL (Pnhx-2DsRed::KDEL) (Fig. 3E, Supplementary Material, Fig. S1 and Table S1). sGFP::ATZ and DsRed::KDEL co-localized to the inclusions (Fig. 3F–H, white arrowheads), confirming that, like ATD patients with liver disease and the PiZ mouse, the mutant serpin was accumulating within dilated ER cisternae (17,18).
Figure 3.
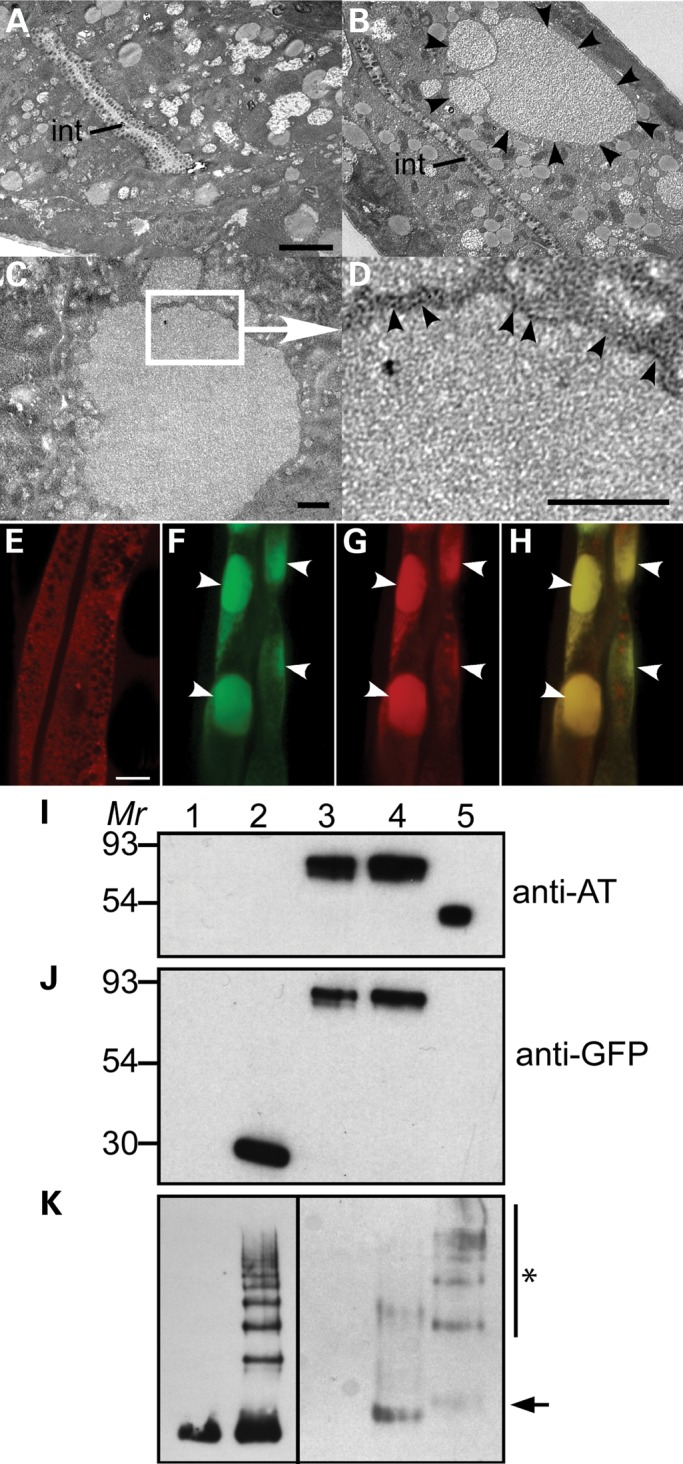
sGFP::ATZ is retained in the ER. Transmission electron micrographs showing a transverse section of the intestine of animals expressing sGFP::ATM (A) and sGFP::ATZ (B–D). Large protein dense inclusions (black arrowheads) were present in animals expressing sGFP::ATZ (B). int, intestinal lumen. Scale bar, 2 µm. Higher magnification images (C and D) indicate that the inclusions were surrounded with ribosome-rich membranes indicative of the ER (black arrowheads). Scale bars, 0.5 µm. Widefield fluorescence image of a transgenic animals expressing DsRED-KDEL (E). A diffuse reticular expression pattern is consistent with ER localization. Images of a transgenic animal co-expressing DsRED-KDEL and sGFP::ATZ in the green channel (F), red channel (G) and merge (H), respectively, showed co-localization of intracellular inclusions (white arrowheads). Immunoblots of lysates from transgenic animals (I–K). Lysates of N2 (lane 1) and transgenic animals expressing sGFP (lane 2), sGFP::ATM (lane 3) and sGFP::ATZ (lane 4) were separated by SDS–PAGE under denaturing conditions (I and J). AT purified from plasma was included in lane 5 as a positive control. AT and GFP protein bands were detected by probing with anti-AT (I) and anti-GFP (J) antibodies, respectively. Native PAGE analysis of animal lysates (K). Monomeric (lane 1) and polymeric (lane 2) AT were included as controls. Lysates of N2 (lane 3) and transgenic animals expressing sGFP::ATM (lane 4) and sGFP::ATZ (lane 5) were separated under non-denaturing conditions. Arrow indicates monomeric sGFP::AT and asterisk AT-polymers.
In ATD patients and the PiZ mouse, ATZ is retained in the ER as soluble monomers, oligomers and polymers as well as insoluble higher order polymers and aggregates (17,19,20). To determine the nature of the retained sGFP::ATZ in C. elegans, we first analyzed soluble whole protein lysates prepared from young adult animals by PAGE under denaturing and native conditions (Fig. 3I–K). A reducing gel immunoblot showed that the fusion proteins from Pnhx-2sGFP::ATM and Pnhx-2sGFP::ATZ animals were intact and the correct molecular mass (Fig. 3I and J). Under native conditions, sGFP::ATM was mostly monomeric and dimeric (Fig. 3K, arrow). In contrast, most of the sGFP::ATZ was in the form of soluble dimers and higher order polymers (Fig. 3K, asterisk).
Next, we assessed sGFP::ATZ diffusibility in vivo by performing fluorescence recovery after photobleaching (FRAP). The time required to recover the fluorescence signal within a defined photobleached area by diffusion is an inverse function of fluorescent protein solubility (21). The nearly instantaneous recovery of the fluorescence signal after photobleaching a portion of a ATZ globule showed that sGFP::ATZ was highly diffusible within the dilated ER cisternae of larval and young (day 1) adult animals (Fig. 4A and C). As the animals aged, however, recovery was markedly delayed, suggesting that sGFP::ATZ became non-diffusible or immobile, especially in the >7-day-old adult animals (Fig. 4B and C). Taken together, the data suggested that sGFP::ATZ partially redistributed from the diffusible to a non-diffusible fraction as the animals senesced.
Figure 4.

ATZ FRAP analysis. The immobile fraction of sGFP::ATZ expressing day 7 adults was significantly greater than that of the day 1 animals (two-tailed, non-parametric Mann–Whitney test, ***P < 0.001). Representative FRAP time course images of day 1 (A) and day 7 (B) adults expressing either GFP (upper panels) or sGFP::ATZ (lower panels). Pre-bleach images were taken prior to photobleaching in the region of interest (ROI) (white circles). Fluorescence recovery was monitored for the times shown. Note the lack of fluorescence recovery in day 7 sGFP::ATZ animals (white arrowheads). Scale bar, 5 µm. The non-diffusible/immobile fraction of ATZ protein following FRAP analysis (C).
Proteostasis pathways involved in the elimination of sGFP::ATZ
ER-associated degradation (ERAD) and autophagy are two major pathways that dispose of aggregated/misfolded proteins. Therefore, we assessed directly the relative contributions of these pathways in eliminating sGFP::ATZ by using a combination of RNAi and genetic crosses. Animals were exposed to ERAD(RNAi) specific for the membrane complex responsible for the identification and retro-translocation of misfolded ER proteins to the cytosol for degradation by the ubiquitin-proteasomal system (UPS) (Fig. 5A). Knock-down of components of the ERAD HRD-1 E3 ligase complex resulted in an ∼1.7-fold increase in accumulation of sGFP::ATZ (Fig. 5A). Surprisingly, combined knock-down of CDC-48.1 and 48.2 (P97-like AAA ATPase) had little effect on sGFP::ATZ accumulation (vide infra), although this RNAi resulted in a marked increase in the soluble luminal ERAD substrate, CPL-1W32A;Y35A::YFP (22), and activation of hsp-4 driven expression of GFP (Supplementary Material, Fig. S3). These studies suggested that inhibition of ERAD increased accumulation of sGFP::ATZ, and that this pathway was responsible, in part, for the disposal of sGFP::ATZ.
Figure 5.

Role of ERAD and autophagy in sGFP::ATZ clearance. Effect of ERAD RNAi's on sGFP::ATZ accumulation in sGFP::ATZ expressing animals (A). LGG-1 positive puncta were increased in animals expressing sGFP::ATZ (B). Confocal z-series of the posterior intestinal region of transgenic animals expressing lgg-1::mCherry alone (i and iv) and with sGFP::ATM (ii and v) or sGFP::ATZ (iii and vi). Images were maximum intensity projections of all the z-stacks with the scale bar representing 20 µm. Note the marked increase in number of mCherry::LGG-1 puncta in animals expressing sGFP::ATZ (iii, arrowheads and C). Quantification of the number of LGG-1 puncta in the different transgenic lines (C). The statistical significance of data in A, C and E was determined using an unpaired, two-tailed, Student's t-test, *P < 0.05, **P < 0.01 and ***P < 0.001. Autophagasomes co-localized with sGFP::ATZ inclusions (D). Representative single plane confocal images of a single intestinal cell of a transgenic animal expressing sGFP::ATZ and LGG-1::mCherry. The scale bar represents 10 µm. Arrowheads point to two puncta that were examined for co-localization of sGFP::ATZ and LGG-1::mCherry (D, i–iii). Higher magnification images of the two puncta in the X-Y (iv, v and vi) and X-Z (vii, viii and ix) planes. Note co-localization of red and green signals to the two puncta (yellow in merge). The scale bar represents 1 µm. Effect of autophagy RNAi on sGFP::ATZ accumulation (E). sGFP::ATZ accumulation was also increased in autophagy-deficient animals (F). GFP fluorescence images of Pnhx2sGFP::ATZ (i) and unc-51(e369);Pnhx2sGFP::ATZ (ii) animals.
To determine whether autophagy was also involved in the disposal of sGFP::ATZ, we injected transgenic animals with the Pnhx-2mCherry::lgg-1 construct (14) and quantitatively assessed autophagosome formation. In contrast to the Pnhx-2sGFP::ATM animals, which did not show any increase in autophagy, the Pnhx-2sGFP::ATZ animals showed a marked increase in the number of mCherry::LGG-1 puncta (Fig. 5B and C). High-resolution confocal microscopy also showed co-localization of sGFP::ATZ within mCherry::LGG-1 positive structures (Fig. 5D, arrowheads) and the increased numbers of mCherry::LGG-1 puncta were not due to a sGFP::ATZ-induced impairment of autophagic flux, we knocked-down several genes involved in the induction and propagation of the pathway and measured fusion protein accumulation using the ArrayScan VTI (23). RNAi knock-down of autophagy-specific genes resulted in a significant accumulation of sGFP::ATZ (Fig. 5E), but not the soluble luminal ERAD substrate, CPL-1W32A;Y35A::YFP (22). To confirm the RNAi results, we crossed the Pnhx-2sGFP::ATZ animals with an autophagy-deficient strain, unc-51(e369). These animals also showed a marked increase in sGFP::ATZ accumulation (Fig. 5F). These studies indicated that ERAD and autophagy were critical components of the proteostasis machinery in the C. elegans model.
The insulin/insulin growth factor (IGF)-1-like signaling (IIS) pathway modulates ATZ accumulation and proteotoxicity
In several experimental systems, reduced IIS protects against the toxic effects of endogenous or transgene-derived aggregation-prone proteins (24). Most of the transgenic proteins were targeted to the cytoplasm or the extracellular space and included β-amyloid1-42, TDP-43 or polyglutamine repeats (e.g. huntingtin, ataxin-3) (25–29). Thus, ATZ is unique among these aggregation-prone proteins in that it accumulates mostly in the ER. To determine whether the IIS pathway affects aggregated proteins within the ER, we crossed Pnhx-2sGFP::ATZ animals with IIS pathway deficient mutant, daf-2(e1370). DAF-2 is the sole insulin/IGF receptor tyrosine kinase in C. elegans. Reduction in DAF-2 activity leads to dis-inhibition of DAF-16, increased lifespan and enhanced proteostasis (25). Pnhx-2sGFP::ATZ; daf-2(e1370) animals showed a significant decrease in sGFP::ATZ accumulation when compared with the Pnhx-2sGFP::ATZ controls (Fig. 6A). As expected, the daf-16(m26) mutation suppressed the effect of daf-2(e1370) on sGFP::ATZ accumulation and in itself increased sGFP::ATZ accumulation when compared with the N2 background (Fig. 6A).
Figure 6.

Role of insulin/insulin growth factor (IGF)-1-like signaling (IIS) pathway on ATZ accumulation. Relative expression of sGFP::ATZ in various genetic backgrounds measured using the ArrayScanVTI (A). Effect of vec and GFP RNAis on PED (B) and longevity (C). The statistical significance of data in (A) and (B) was determined using an unpaired, two-tailed, Student's t-test, *P < 0.05 and ***P < 0.001. Longevity of sGFP::ATZ animals crossed with various IIS mutants (D).
In several disorders of protein aggregation, proteotoxicity does not correlate with the degree of insoluble protein aggregates per se, but rather the presence of sub-microscopic soluble monomers and oligomers (30). To determine whether there was an association between the large soluble sGFP::ATZ aggregates and proteotoxicity, we first exposed larval animals to GFP(RNAi) by feeding and then assessed two measures of ATZ proteotoxicity, post-embryonic development (PED) and longevity. Compared with vector(RNAi), GFP(RNAi) was associated with elimination of the large inclusions visible under the stereomicroscope and partially suppressed both the defects in PED and the reduced longevity observed in sGFP::ATZ expressing animals (Fig. 6B and C). This effect could not be attributed to complete elimination of sGFP::ATZ protein expression, as we consistently detected small amounts of sGFP::ATZ by fluorescence microscopy after GFP(RNAi) (Supplementary Material, Fig. S4A). Consistent with the GFP(RNAi) data, the decreased sGFP::ATZ accumulation in Pnhx-2sGFP::ATZ;daf-2(e1370) animals was also associated with increased lifespan compared with N2 or sGFP::ATZ expressing animals (Fig. 6D). Moreover, this enhanced lifespan was also DAF-16 dependent (Fig. 6D). These findings showed a clear association between the loss of soluble sGFP::ATZ inclusions and decreased proteotoxicity.
Decreased IIS leads to increased ATZ turnover
To gain insight into the mechanism of reduction of sGFP::ATZ accumulation and proteotoxicity, we treated Pnhx-2sGFP::ATZ; daf-2(e1370) animals with ERAD and autophagy RNAis as described in Figure 5. As expected, treatment with these RNAis partially increased sGFP::ATZ accumulation, but none strikingly reversed the protective effects of decreased IIS (Fig. 7A). Crossing the unc-51(e369) or glo-1(zu437) alleles into the Pnhx-2sGFP::ATZ; daf-2(e1370) animals also showed that animals defective in autophagy or the biogenesis of lysosome-related organelles (LRO), respectively, were unable to suppress the reduced IIS phenotype (Supplementary Material, Fig. S4B–G), although these mutations exacerbated the sGFP::ATZ phenotype in the absence of daf-2(e1370). Since ERAD, autophagy or LRO activity did not appear to account for the reduction in sGFP::ATZ levels in animals with reduced IIS, we assessed animals for increased sGFP::ATZ secretion, decreased transcription or accelerated protein turnover (degradation). High-resolution confocal microscopy failed to detect any sGFP::ATZ within the pseudo-coelomic space (sGFP::ATM was secreted into this space, Supplementary Material, Fig. S2F). qRT-PCR showed that sGFP::ATZ mRNA, and to a lesser extent sGFP mRNA levels were reduced in daf-2(e1370) animals when compared with those with an N2 background (Supplementary Material, Fig. S5A). This decrease suggested that the sGFP::ATZ expression in animals with reduced IIS was due, in part, to down-regulation of the nhx-2 promoter. Although mRNA levels were reduced, sGFP::ATZ protein was still detectable by immunoblotting (Fig. 7B). To determine whether protein half-life (t1/2) had been altered in vivo, we followed the fate of sGFP::ATZ after inhibiting protein synthesis with cycloheximide. sGFP::ATZ-expressing animals in the N2 background showed a protein t1/2 of >20 h (limit of detection due to compound toxicity), whereas that in daf-2(e1370) animals was decreased to ∼8 h (Fig. 7B and C). This decreased protein t1/2 in daf-2(e1370) animals was dependent on DAF-16 (Supplementary Material, Fig. S5B), and specific for sGFP::ATZ as the elimination of ER retained sGFP-KDEL control was not accelerated (Fig. 7D). To ensure that this decreased t1/2 was not due to the smaller amount of sGFP::ATZ present in the daf-2(e1370) animals, we also measured the protein t1/2 of sGFP::ATZ in N2 animals treated with GFP(RNAi). This RNAi treatment reduced the steady-state levels of sGFP::ATZ mRNA and protein to that of the sGFP::ATZ; daf-2(e1370) animals (Supplementary Material, Fig. S5C). However, the sGFP::ATZ protein t1/2 was comparable to that of the N2 animals (Fig. 7E). We concluded that reduced IIS in C. elegans decreased the accumulation of sGFP::ATZ by both decreasing mRNA levels and by enhancing degradation.
Figure 7.

Suppression of ATZ clearance by the RNAi pathway. Effect of ERAD and autophagy RNAis on ATZ accumulation in N2 (white) and daf-2 mutant (black) background (A). sGFP::ATZ half-life in N2 (upper panels) and daf-2 mutant (lower panels) background (B). Graph showing remaining ATZ following CHX inhibition (C). sGFP-KDEL half-life in N2 (upper panels) and daf-2 mutant (lower panels) background (D). Note, unlike sGFP::ATZ, the half-life of sGFP-KDEL is not accelerated in daf-2 mutants. Effect of reduced steady-state expression on sGFP::ATZ half-life (E). Note, ATZ half-life is not dependent on steady-state expression levels. Effect of SID-1 and RDE-1 on ATZ half-life (F). Note, the accelerated clearance of ATZ in the daf-2 background is suppressed by sid-1(pk3321) and rde-1(ne219) mutations. *Note: steady-state ATZ levels in daf-2 mutants and GFP(RNAi)-treated animals were considerably lower, as such more total lysates were loaded for these samples to ensure comparable ATZ levels at t = 0. This is reflected in the higher levels of tubulin in the above-mentioned samples.
Suppression of the IIS phenotype
The mechanism of enhanced elimination in the sGFP::ATZ; daf-2(e1370) animals was potentially novel as it did not appear to involve the ERAD or autophagy pathways responsible for sGFP::ATZ degradation in N2 animals. To obtain further insight into this process, we conducted an EMS mutagenesis screen using the sGFP::ATZ; daf-2(e1370) animals and selected for the reappearance of sGFP::ATZ inclusions in the F2 generation. Twenty-six suppressor mutations were identified, several were mapped and one (sup1-1) was analyzed by whole genome DNA sequencing. This analysis revealed a nonsense mutation (Q154X) in exon 3 of sid-1 (sid-1(vk832)). SID-1 is a polytopic transmembrane protein that is critical for the induction of systemic RNAi by importing dsRNA silencing signals (31). Indeed, the sup1-1 strain [VK832 (Pnhx-2sGFP::ATZ; daf-2(e1370);sid-1(vk832))] was resistant to systemic RNAi by feeding (e.g. no twitching after unc-22(RNAi)). However, when we examined sGFP::ATZ turnover, the t1/2 reverted back to that observed in the N2 animals (Fig. 7F, upper panels). Similar effects on sGFP::ATZ t1/2 were observed when a different sid-1 loss-of-function missense (D130N) mutation [sid-1(pk3321)] (32) was crossed into sGFP::ATZ; daf-2(e1370) animals (Fig. 7F, middle panels). These findings suggested that the systemic RNAi pathway is linked to misfolded protein elimination and this effect appears to be enhanced by decreased IIS. To confirm that the exo-RNAi machinery was associated with protein turnover, we performed two crosses. First, we crossed Pnhx-2sGFP::ATZ; daf-2(e1370) animals with a RNAi defective strain carrying a loss-of-function allele for the crucial argonaute protein, RDE-1 (33). The effects of the rde-1 and sid-1 mutations on protein t1/2 in animals with reduced IIS were indistinguishable, as Pnhx-2sGFP::ATZ; daf-2(e1370);rde-1(ne219) animals showed an sGFP::ATZ t1/2 comparable with that observed in the animals with an N2 background (Fig. 7F, lower panels). Second, we crossed a mutant allele for the RNA-directed RNA polymerase, rrf-3 (ok629), into Pnhx-2sGFP::ATZ animals. This rrf-3 mutation is known to enhance systemic RNAi (34) and in the absence of any exogenous source of dsRNA, decreased the sGFP::ATZ t1/2 in Pnhx-2sGFP::ATZ animals (Supplementary Material, Fig. S6). These studies suggest that the turnover of sGFP::ATZ protein was increased and decreased, respectively, by mutations that augment (e.g. daf-2, rrf-3) or impair (sid-1, rde-1) the systemic/exo-RNAi machinery.
Effect of mammalian SIDT2 on ATZ accumulation
To determine whether SID-1 effect was conserved in mammalian cells, we knocked-down SIDT2, the mammalian ortholog of SID-1 in HeLa (HTO/Z) cells (35) using siRNA and measured steady-state ATZ levels. Consistent with our findings in C. elegans, the knock-down of SIDT2 (Fig. 8A, upper panel and 8B, black bars) led to a concomitant increase in ATZ accumulation (Fig. 8A, lower panel, and 8B, white bars). Corroborating this data, we found that overexpression of SIDT1 and/or SIDT2 resulted in decreased accumulation of ATZ (Fig. 8C). This effect appeared to be specific for ATZ as the accumulation of another AT variant, AT-Saar, was not affected (Supplementary Material, Fig. S7).
Figure 8.

Role of mammalian SIDT1/2 on ATZ clearance. Effect of SIDT2 knock-down in HeLa cells expressing ATZ (A and B). HTO/Z cells were transiently transfected with scramble (neg) or SIDT2 siRNA and SIDT2 and ATZ protein levels were assessed via western blot analysis. Following siRNA treatment, SIDT2 was significantly down-regulated in transfected cells (A, upper panel and B, black bars). Silencing of SIDT2 also resulted in approximately 2-fold increases in the total ATZ level (A, lower panel and B, white bars). To further test the effect of SIDT1/2 on ATZ accumulation, HTO/Z cells were transfected with constructs expressing SIDT1 and/or SIDT2. Cells expressing SIDT1 or SIDT2 showed ∼20% decrease in ATZ accumulation (C). Cells expressing both SIDT1 and SIDT2 showed ∼30–35% decrease in ATZ accumulation.
DISCUSSION
The preclinical models of rare human disease, such as ATD, are invaluable in defining disease mechanisms inferred from small patient populations with variable penetrance and expressivity (6,7). Since C. elegans has been used to model several aggregation-prone human disorders and is one of the preeminent systems for genetic analysis, transgenic animals expressing ATZ should offer an advantage to existing experimental paradigms provided they phenocopy the cellular pathobiology of the liver disease associated with human ATD (4). Although C. elegans does not contain hepatocytes, this organism's intestinal epithelium performs many of the biosynthetic and detoxification functions associated with human liver (10). For this reason, we generated transgenic animals with ATZ expression directed to this tissue. Similar to hepatocytes, C. elegans cells readily secreted the wild-type protein, ATM, but retained the mutant form, ATZ, within dilated ER cisternae and were remarkably similar to the periodic acid-Schiff positive, diastase resistant globules present in histological specimens prepared from the livers of ATD patients (36). Biochemically, ATZ was retained as polymers and higher order aggregates, as has been observed in mammalian model systems (37) and patients with ATD (17).
Caenorhabditis elegans utilized both the ERAD-UPS and autophagy pathways to eliminate at least a portion of their ATZ burden. These findings were consistent with those observed in mammalian and yeast systems, suggesting that soluble forms of misfolded ATZ are eliminated by ERAD-UPS (38,39), whereas higher order polymers and aggregated forms of ATZ as well as some of the soluble forms of ATZ are eliminated by autophagy (38,40,41). Since the knock-down or loss of genes involved at different steps along the autophagy pathway led to a further increase in the number and size of intracellular ATZ-containing inclusions, we concluded that autophagy played a significant role in the disposal of ATZ in C. elegans, as it does in mammalian cell lines, transgenic mouse models and liver samples from ATD patients.
Although the nature of proteostasis mechanism is unclear, loss-of-function mutations or RNAi treatments that reduce IIS protect against the toxic effects of misfolded cytosolic human proteins in C. elegans (24,27,29,42), and in Aβ-expressing mice (26,43). Decreased IIS via mutations in daf-2 (insulin-like receptor) or age-1 (PI3 kinase) also markedly decreased the accumulation of sGFP::ATZ. These findings demonstrated that the protective effects of reduced IIS now extend to the handling of misfolded proteins accumulating within the ER lumen, as well as those targeted to the cytosol. Surprisingly, however, the reduction of sGFP::ATZ, which correlated with improved survival, was not completely dependent on autophagy or ERAD. Thus, we also examined the animals for enhanced sGFP::ATZ secretion or degradation. No secretion could be detected, but the protein t1/2 in the IIS defective animals was decreased markedly from >20 to ∼8 h. To gain insight into this mechanism, we performed a suppressor screen and selected for the re-appearance of sGFP::ATZ aggregates in IIS defective animals. Characterization of one of the suppressors revealed a null mutation in sid-1, a polytopic transmembrane protein required for systemic RNAi by serving as the import channel for dsRNA silencing signals (31). Since daf-2 mutants are hypersensitive to RNAi (44), and the loss of SID-1 activity resulted in the re-accumulation of sGFP::ATZ, one might conclude that exo-RNAi-induced transcriptional or post-transcriptional transgene silencing was responsible for the decreased mRNA levels (45). However, this notion is not easily reconciled with the data, as there was no exogenous source of dsRNA. If the silencing signal was derived from an internal source, the integrated transgene array was the most likely candidate. However, since the transgenic array was most active in intestinal cells, RNAi should have been cell autonomous and not required the importing function of SID-1. Moreover, even if SID-1 was required to import dsRNA from a non-intestinal cell source somewhere else in the soma (e.g. due to a leaky nhx-2 promoter or an promoter near the integration site), the transitive (amplification) nature of RNAi within the target cells should have been well established in young adult daf-2 mutants and not suppressible by the application of sid-1(RNAi) in young adults (Supplementary Material, Fig. S5D). The ability of sid-1(RNAi) to enhance sGFP::ATZ accumulation when applied to young adult daf-2 mutants also eliminates a role for a germline-like mediated transgene silencing (46). While we cannot preclude a role for enhanced systemic exo-RNAi in decreasing sGFP::ATZ in daf-2 mutants, we suggest that RNAi may not play a major role in these IIS mutants. Rather, we suggest that reduced IIS enhances RNAi and that the induction of RNAi machinery is linked mechanistically to increased protein turnover for aggregation-prone proteins such as sGFP::ATZ. This linkage is supported by sGFP::ATZ protein t1/2 that was correlated inversely with mutations that increased (daf-2, rrf-3) or decreased (sid-1, rde-1) the activity of the systemic/exo-RNAi machinery. Furthermore, knock-down and overexpression of SIDT2, the mammalian ortholog of C. elegans sid-1, resulted in an increase and decrease in ATZ expression, respectively, in HeLa cells expressing ATZ. While this reduction in protein t1/2 did not appear to require macroautophagy or the ERAD-UPS system, we could not exclude direct lysosomal involvement, other forms of autophagy or cytoplasmic proteinases in this RNA-linked process. We do find it interesting that recent studies show that that proper functioning and regulation of the cytoplasmic RNAi machinery (e.g. P- or GW-bodies) is intimately involved in the endolysosomal compartments also associated with protein trafficking and turnover (47,48), and that the human orthologue of sid-1, SIDT2, is detected in lysosomal membranes (49). In addition, sid-1 is a member of the CREST superfamily. CREST proteins possess at least seven transmembrane domains and three motifs that are likely to form a hydrolase active site capable of cleaving amide bonds (50). Mutations of these sites should determine whether SID-1 functions as a peptidase under conditions of reduced IIS and possibly plays a direct role in misfolded protein degradation.
From these studies, we concluded that C. elegans modeled the basic mammalian cellular response to the aggregation-prone luminal ER protein, ATZ. Moreover, these data supported the use of this economical invertebrate model for genetic screens to better understand proteostasis pathways involved in the elimination of misfolded proteins. As these pathways are identified, this model should also serve as a preclinical platform for high-content drug (14) and genetic screening for new therapeutic targets for patients with ATD and other aggregation-prone disorders (see accompanying paper).
MATERIALS AND METHODS
Caenorhabditis elegans strains and culture conditions
Animals were routinely cultured at 22°C on nematode growth medium (NGM) plates seeded with E. coli strain, OP50, unless otherwise specified in the text. Caenorhabditis elegans strains, N2, CB1370 [daf-2(e1370)], DR26 [daf-16(m26)], DR1309 [daf-2(e1370);daf-16(m26)], TJ1052 [age-1(hx546)] and CB369 [unc-51(e369)] were obtained from the Caenorhabditis Genetics Center (CGC), http://www.cbs.umn.edu/CGC/. Transgenic strains were generated by injecting the respective plasmids into the gonad of young adult N2 hermaphrodites at a final concentration 80 ng/µl. VK694, VK695 and VK1093 were generated as described (14). VK1338 and VK1340 were generated by co-injecting the plasmid, Pnhx-2sGFP::ATM or Pnhx-2sGFP::ATZ, with Pnhx-2mCherry::lgg-1 at a final concentration of 60 and 20 ng/µl, respectively. VK487 was generated by co-injecting the plasmid, Pnhx-2sGFP::ATZ with Pnhx-2DsRed-KDEL at a final concentration of 60 and 20 ng/µl, respectively. VK763 and VK805 were generated by crossing VK694 with CB369 and CB1370, respectively. VK735, VK757, VK755 and VK2026 were generated by crossing VK695 with CB1370, DR26, DR1309 and TJ1052, respectively. A complete list of worm strains and their genotypes are shown in Supplementary Material, Table S1.
Construction of promoter–transgene fusions
We constructed a transcriptional Pnhx-2sGFP fusion construct by cloning a 4 kb nhx-2 promoter fragment into the HindIII/XbaI sites of the promoter-less expression vector containing the GFP with an N-terminal signal peptide (sGFP), pPD95.85 (a kind gift from Dr Andrew Fire, Stanford University School of Medicine). Construction of Pnhx-2sGFP::ATM, Pnhx-2sGFP::ATZ, Pnhx-2mCherry::lgg-1, Pnhx-2mCherry and Pnhx-2DsRed-KDEL has been previously described (14,22). GFP-less, Pnhx-2sATM and Pnhx-2sATZ, constructs were generated by replacing the GFP stop codon with a KpnI restriction site. A second KpnI site just 5′ of GFP start codon was utilized to remove the GFP coding region. The GFP-less vector fragment was then re-ligated to generate Pnhx-2sATM and Pnhx-2sATZ constructs. The Psrp-2sGFP::ATM and Psrp-2sGFP::ATZ were generated by replacing the nhx-2 promoter with the srp-2 promoter. A complete list of constructs used in this study are shown in Supplementary Material, Figure S1. Plasmids have been deposited into the Addgene repository (Cambridge, MA, USA).
Quantitative RT-PCR
For qRT-PCR analysis, three tubes of ∼1000 worms were collected for each line to be tested. For RNA extraction, only RNAse-free solutions and plasticware were used, and each centrifugation step was done at 12 000g and 4°C. Worms were pelleted before being resuspended in 1 ml of Trizol reagent (Invitrogen) and frozen at −80°C to aid worm lysis. Upon thawing, 200 µl of chloroform was added and vortexed vigorously for 30 s. Following 6 min of centrifugation, the aqueous phase was carefully transferred to a new 1.5 ml microfuge tube. An equal volume of isopropanol was added and the sample was centrifuged for 12 min. The pellet was then washed with 700 µl of 80% ethanol, and centrifuged for 10 min. The ethanol was removed from the pellet and the pellet was allowed to dry until translucent to remove any remaining ethanol. The RNA pellet was then resuspended in 35 µl of H2O and the concentration of total RNA was determined by spectrophotometric analysis. Using 800 ng of total RNA, cDNA was synthesized using the SuperScript® III first strand synthesis kit (Invitrogen) according to the manufacturer's instructions. Using the cDNA as template, qRT-PCR analysis was performed by using a 7300 Real-Time PCR System (Applied Biosystems). For quantification of AT-specific cDNA, a unique PCR primer set and a FAM-labeled Taq-Man probe were purchased from IDT® Integrated DNA Technologies website. As an internal control, we used the previously described housekeeping gene, Y45F10D.4 (51). The size of each amplicon was kept in the 100–200 bp range to ensure similar efficiency of amplification.
Immunoblotting
For denaturing conditions, a well-fed population of worms from a 100 mm NGM plate was washed off using 1.5 ml of PBS and pelleted by centrifugation on a bench top microcentrifuge for 15 s. The pellet was then suspended in 3 volumes of 2× SDS loading buffer, sonicated for 30 s and boiled for 5 min. Samples were then clarified by centrifugation 12 000g for 2 min. Ten µl of lysate was loaded onto a Criterion TGX precast gel (Bio-Rad, Hercules, CA, USA) and resolved under denaturing and reducing conditions. Protein bands were then transferred to a polyvinylidene difluoride membrane using the Criterion western blotting system. The membranes were blocked with 5% BSA in Tris-buffered saline/0.1% Triton X-100 and then incubated with primary antibodies. AT protein bands were detected by incubating with a goat anti-AT polyclonal antibody (DiaSorin) followed by a donkey anti-goat IgG-HRP conjugated antibody (Santa Cruz Biotechnology, Santa Cruz, CA, USA). GFP protein bands were detected using a rabbit anti-GFP polyclonal followed by a goat anti-rabbit-HRP conjugated antibody (Santa Cruz Biotechnology). α-Tubulin bands were detected using a mouse anti-α-tubulin monoclonal antibody (Sigma-Aldrich) followed by bovine anti-mouse-HRP conjugated antibody (Santa Cruz Biotechnology). HRP-reactive bands were visualized using Luminata™ Classico Western HRP substrate (Millipore).
For detection of AT polymers under non-denaturing conditions, worm pellets were resuspended in equal volume of PBS containing a Complete™ protease inhibitor cocktail (Roche, Indianapolis, IN, USA). Pellets were then disrupted by intermittent sonication on ice for a total of 15 s or until complete lysis was observed. Samples were then centrifuged at 12 000g for 2 min and supernatant was transferred to a new tube. For electrophoresis, 12 µl of sample was mixed with 3 µl of 5× native gel loading buffer (5 ml glycerol, 2.3 ml Tris pH 6.8, 2.7 ml H2O, 0.01% bromophenol blue) and loaded onto a 7.5% native gel. Protein bands were separated under non-denaturing and non-reducing conditions using a Tris-glycine running buffer (25 mm Tris, 192 mm Glycine, pH 8.3). Western blotting was carried out as described above.
Microscopic imaging
For microscopic image acquisition, ∼12 worms were transferred to a 35 mm MatTek glass bottom culture dish (MatTek, Ashland, MA, USA) containing 6 µl of 50 mm sodium azide. Confocal images were collected using a Leica TCS SP8 microscope. GFP fluorescence was illuminated using a 488 nm argon laser line and red fluorophors with a 561 nm solid state laser with either a 20× 0.6NA Apochromat air objective or a 40× 1.3NA oil Apochromat CS2 objective. Fluorescence images were captured using a spectral HyD detector over ∼100 Z-planes. DIC images were collected using a transmitted light detector and the 488 nm Argon laser line. Confocal images were acquired using LAS AF software (Leica Microsystems) and visualized, rendered and analyzed using Volocity Software (v6.11, Perkin Elmer).
Phenotypic analysis
Developmental abnormalities were assessed by measuring the time taken for embryos to reach adulthood. Synchronous embryos from wild-type N2, Pnhx-2sGFP::ATM and Pnhx-2sGFP::ATZ lines were obtained by allowing ∼25 adults hermaphrodites to lay eggs for 2 h at 25°C. Following the removal of adults, progeny were allowed to develop for 48 h at 25°C. The number of animals that had reached the adult stage was recorded. Animals that were still in the first, second, third and fourth larval stages monitored for a further 2 days to determine whether they were larval arrested (Lva) or slow growing (Gro). At 25°C, wild-type N2 embryos take ∼48–52 h (post egg lay) to develop into young adults and the first, second, third and fourth larval stages last for ∼11.5, 7, 7.5 and 9.5 h, respectively (52). Animals were classified as slow growing (Gro) if they had failed to reach the L4 stage by 48 h. Developmental studies were calculated from three separate trials and statistical significance was determined using a Student's t-test.
Brood size was ascertained by measuring the total number of eggs laid by an individual adult. Ten animals in the fourth larval stage were placed onto individual NGM plates and incubated at room temperature. The adult worm was carefully transferred to a new plate daily for 5 days or until it had stopped laying eggs. The number of progeny on each plate was recorded and totaled. The mean brood size and standard deviation of a particular strain was calculated and significance was determined using a Student's t-test.
Lifespan analyses were performed at 20 or 25°C by monitoring the survival of wild-type N2 and AT-expressing transgenic lines cultured on NGM plates seeded with OP50. Typically, 25 L4 stage animals were transferred to a 60 mm NGM plate. Each plate was scored once a day for live and dead worms. An animal was considered dead if there was no response upon gentle prodding with a platinum wire. During the reproductive period (first 5 days), worms were transferred to a new plate every 24–48 h to avoid confusion with progeny. Dead worms were removed from the plate and discarded after scoring. Animals that crawled off the plate were censored from analysis. Each lifespan assay was repeated at least three times. Data were plotted as Kaplan–Meier survival curves and statistical significance was determined using the log-rank (Mantel–Cox) test (53).
Transmission electron microscopy
Young adult stage worms were fixed in 2.5% EM grade glutaraldehyde in HEPES buffer (0.2 m HEPES pH 7.5) for 1 h at room temperature. Fixed samples were washed in HEPES buffer three times before staining with 1% OsO4, 0.5% KFe(CN)6 in 0.1 m HEPES buffer for 90 min on ice. Samples were again washed in HEPES buffer three times before embedding in 3% sea plaque agarose. Samples were dehydrated through a series of ethanol washes as follows: 5 min each in 30, 50, 75 and 95% ethanol followed by 3× 10 min in 100% ethanol and 3× 10 min in propylene oxide. Samples were sectioned in Spurs resin and visualized by transmission electron microscope, JEOL 1011CX.
Fluorescence recovery after photobleaching (FRAP)
FRAP experiments were performed using the Leica SP8 confocal described above and the FRAP wizard in the LAS AF acquisition software (Leica Microsystems). Briefly, the area of GFP fluorescence to be subjected to FRAP was measured. As ATZ globules were of varying sizes, a region of interest (ROI) of ∼10% of the total GFP fluorescence area was selected to avoid photobleaching the entire globule. The GFP fluorescence was then imaged prior to a pulse of 100% 488 nm wavelength laser within the ROI for 5–10 iterations until the ROI was bleached entirely. The entire field of view was then imaged as fast as possible for 20 iterations, then every 1 s for a total of 30 s and then every 2 s for a total of 1 min. FRAP data were acquired and analyzed in accordance with protocols described by Miura (http://cmci.embl.de/documents/frapmanu). Volocity Quantification software (v6.11, PerkinElmer) was used to determine intensity measurements of the following ROI's: ‘FRAP ROI’ [Ifrap(t)], a ‘base ROI’ [Ibase(t)] of the same area outside the GFP fluorescence (background) and the ‘reference ROI’ [Iref(t)] of the entire GFP region prior to bleaching. FRAP curve analysis was determined using the freeware FRAPanalyser software [v1.05, University of Luxembourg (http://actinsim.uni.lu/eng/Downloads)]. Data were double normalized to correct for background fluorescence and acquisition bleaching (54). The recovery curves were then fitted to the Soumpasis diffusion model for a circular spot to determine the diffusion coefficient, mobile and immobile fraction (55,56).
Quantification of LGG-1 puncta
Images were first acquired with a Leica SP8 tandem laser scanning confocal microscope with HyD detectors in counting mode. Images were scanned in lamda to determine if the correct emission wavelengths for separation of the GFP and mCherry spectra. 40–65 Z plane images were collected per animal at a constant 0.6 µm Z-step size at 1024 × 512 resolution using a 40× PlanApo 1.3 NA CS2 oil objective with a pinhole size of 0.75 AU. Images were visualized and rendered using Volocity Visualisation software (Perkin Elmer, v5.4).
Quantification of ATZ globules using ArrayScan VTI
For quantitative analysis of animals expressing fluorescent transgenes, we used the ArrayScan VTI HCS Reader (Cellomics, ThermoFisher, Pittsburgh, PA, USA) fitted with a 2.5× objective and a 0.63× coupler (14). Thirty N2 or transgenic young adult stage worms were transferred to 384-well plates containing 40 µl of PBS and anesthetized with 40 µl of 0.05 m NaN3 prior to image capture. Images were captured and analyzed using a 2-channel (GFP and TRITC) assay. SpotDetector BioApplication was optimized to identify transgene expression as spots. Parameters were optimized such that spots of varying shape, size and intensity could be identified. In this study, spot total intensity per animal was used to compare transgene expression in different animals.
RNAi analysis
RNAi experiments were performed using the bacteria feeding method described by Kamath and Ahringer (57). One ml of an overnight culture of bacteria carrying the RNAi plasmid was used to inoculate a flask containing 50 ml LB with 100 µg/ml ampicillin. The bacteria were cultured at 37°C to an OD600 = 0.5 and induced by addition of IPTG to a final concentration of 1 mm. Following a 3 h incubation, the bacteria were pelleted and resuspended in 3 ml of fresh LB containing 100 µg/ml ampicillin and 1 mm IPTG. Twenty-five microliters of induced culture was used to seed a 60 mm plate containing NGM supplemented with 100 µg/ml ampicillin and 1 mm IPTG and allowed to incubate on the bench overnight. RNAi experiments were initiated by placing 25–50 L4 stage animals on to the plates. Typically, animals were incubated on RNAi plates for 48 h prior to analysis. For all experiments, vector and GFP RNAi's were used as negative and positive controls, respectively.
Cycloheximide chase experiments
Prior to the experiment, 100 mm petri dishes containing 20 ml of NGM agar were overlaid with 200 µl of cycloheximide (50 mg/ml ethanol) and allowed to try for 20–30 min. The plates were then seeded with OP50 and allowed to incubate overnight at 37°C. Next morning, ∼500 synchronized young adult worms were transferred to the cycloheximide plates and allowed to incubate for 0, 3, 6 and 9 h. Worms were harvested at the indicated times and stored at −80°C. Worm lysates were prepared by sonication. Protein bands were separated by SDS–PAGE and visualized by western blotting as outlined above.
Expression of human SIDT1/2
The human epidermal HeLa cell line with doxycycline-regulated expression of ATZ (HTO/Z) has been described previously (35). Cells were cultured in the absence of doxycycline for at least 4 weeks for maximal expression of AT. Small interfering RNAs (siRNAs) against SIDT1 and 2 as well as SIDT1/2 expression vectors were transfected with Lipofectamine 2000 (Invitrogen, Carlsbad, CA, USA) following the manufacturer's instructions. SIDT siRNAs were purchased from QIAGEN. SIDT1/2 vectors were purchased from Origene. Antibodies to SIDT2 were purchased from Abcam.
Statistical evaluation
Statistical evaluation of data was performed using Prism® (Graphpad Software). The statistical significance of data in Figures 2, 5, 6, and 7 was determined using an unpaired, two-tailed, Student's t-test. Statistical significance of lifespan data (Figs 2D, 6C and D) was determined using a Mantel–Cox log-rank test. Statistical significance between immobile fractions by FRAP analysis (Fig. 4C) was determined using a two-tailed, non-parametric Mann–Whitney test using Prism® (GraphPad Software). P-value summary: *P < 0.05, **P < 0.01 and ***P < 0.001.
SUPPLEMENTARY MATERIAL
Supplementary Material is available at HMG online.
Conflict of Interest statement. None declared.
FUNDING
This work was supported by grants from The Hartwell Foundation (G.A.S.), and the National Institutes of Health (DK079806 and DK081422 to G.A.S., DK084512 and DK096990 to D.H.P. and DK086112 to M.T.M.). Some nematode strains used in this work were provided by the Caenorhabditis Genetics Center (CGC), which is funded by NIH Office of Research Infrastructure Programs (P40 OD010440).
Supplementary Material
REFERENCES
- 1.Carrell R.W., Lomas D.A. Conformational disease. Lancet. 1997;350:134–138. doi: 10.1016/S0140-6736(97)02073-4. [DOI] [PubMed] [Google Scholar]
- 2.Luisetti M., Seersholm N. Alpha1-antitrypsin deficiency. 1: epidemiology of alpha1-antitrypsin deficiency. Thorax. 2004;59:164–169. doi: 10.1136/thorax.2003.006494. [DOI] [PMC free article] [PubMed] [Google Scholar]
- 3.Perlmutter D.H., Silverman G.A. Hepatic fibrosis and carcinogenesis in alpha1-antitrypsin deficiency: a prototype for chronic tissue damage in gain-of-function disorders. Cold Spring Harb. Perspect. Biol. 2011;3:181–194. doi: 10.1101/cshperspect.a005801. [DOI] [PMC free article] [PubMed] [Google Scholar]
- 4.Rudnick D.A., Perlmutter D.H. Alpha-1-antitrypsin deficiency: a new paradigm for hepatocellular carcinoma in genetic liver disease. Hepatology. 2005;42:514–521. doi: 10.1002/hep.20815. [DOI] [PubMed] [Google Scholar]
- 5.Perlmutter D.H. Liver injury in alpha1-antitrypsin deficiency: an aggregated protein induces mitochondrial injury. J. Clin. Invest. 2002;110:1579–1583. doi: 10.1172/JCI16787. [DOI] [PMC free article] [PubMed] [Google Scholar]
- 6.Sveger T. Liver disease in alpha1-antitrypsin deficiency detected by screening of 200,000 infants. N. Engl. J. Med. 1976;294:1316–1321. doi: 10.1056/NEJM197606102942404. [DOI] [PubMed] [Google Scholar]
- 7.Sveger T. The natural history of liver disease in alpha 1-antitrypsin deficiency children. Acta Paediatr. Scand. 1988;77:847–851. doi: 10.1111/j.1651-2227.1988.tb10767.x. [DOI] [PubMed] [Google Scholar]
- 8.Wu Y., Whitman I., Molmenti E., Moore K., Hippenmeyer P., Perlmutter D.H. A lag in intracellular degradation of mutant alpha 1-antitrypsin correlates with the liver disease phenotype in homozygous PiZZ alpha 1-antitrypsin deficiency. Proc. Natl Acad. Sci. USA. 1994;91:9014–9018. doi: 10.1073/pnas.91.19.9014. [DOI] [PMC free article] [PubMed] [Google Scholar]
- 9.Perlmutter D.H. Alpha-1-antitrypsin deficiency: importance of proteasomal and autophagic degradative pathways in disposal of liver disease-associated protein aggregates. Annu. Rev. Med. 2011;62:333–345. doi: 10.1146/annurev-med-042409-151920. [DOI] [PubMed] [Google Scholar]
- 10.McGhee J.D. WormBook. 2007. The C. elegans intestine; pp. 1–36. doi:10.1895/wormbook.1.133.1. [DOI] [PMC free article] [PubMed] [Google Scholar]
- 11.Nehrke K., Melvin J.E. The NHX family of Na+-H+ exchangers in Caenorhabditis elegans. J. Biol. Chem. 2002;277:29036–29044. doi: 10.1074/jbc.M203200200. [DOI] [PubMed] [Google Scholar]
- 12.Chuang T.L., Schleef R.R. Identification of a nuclear targeting domain in the insertion between helices C and D in protease inhibitor-10. J. Biol. Chem. 1999;274:11194–11198. doi: 10.1074/jbc.274.16.11194. [DOI] [PubMed] [Google Scholar]
- 13.Luke C.J., Pak S.C., Askew Y.S., Naviglia T.L., Askew D.J., Nobar S.M., Vetica A.C., Long O.S., Watkins S.C., Stolz D.B., et al. An intracellular serpin regulates necrosis by inhibiting the induction and sequelae of lysosomal injury. Cell. 2007;130:1108–1119. doi: 10.1016/j.cell.2007.07.013. [DOI] [PMC free article] [PubMed] [Google Scholar]
- 14.Gosai S.J., Kwak J.H., Luke C.J., Long O.S., King D.E., Kovatch K.J., Johnston P.A., Shun T.Y., Lazo J.S., Perlmutter D.H., et al. Automated high-content live animal drug screening using C. elegans expressing the aggregation prone serpin α1-antitrypsin Z. PLoS ONE. 2010;5:e15460. doi: 10.1371/journal.pone.0015460. [DOI] [PMC free article] [PubMed] [Google Scholar]
- 15.Davis M.W., Hammarlund M., Harrach T., Hullett P., Olsen S., Jorgensen E.M. Rapid single nucleotide polymorphism mapping in C. elegans. BMC Genomics. 2005;6:118–128. doi: 10.1186/1471-2164-6-118. [DOI] [PMC free article] [PubMed] [Google Scholar]
- 16.Page A.P., Johnstone I.L. WormBook. 2007. The cuticle; pp. 1–15. doi:10.1895/wormbook.1.138.1. [DOI] [PMC free article] [PubMed] [Google Scholar]
- 17.Lomas D.A., Evans D.L., Finch J.T., Carrell R.W. The mechanism of Z alpha 1-antitrypsin accumulation in the liver. Nature. 1992;357:605–607. doi: 10.1038/357605a0. [DOI] [PubMed] [Google Scholar]
- 18.Carlson J.A., Rogers B.B., Sifers R.N., Finegold M.J., Clift S.M., DeMayo F.J., Bullock D.W., Woo S.L. Accumulation of PiZ alpha 1-antitrypsin causes liver damage in transgenic mice. J. Clin. Invest. 1989;83:1183–1190. doi: 10.1172/JCI113999. [DOI] [PMC free article] [PubMed] [Google Scholar]
- 19.Jeppsson J.O., Larsson C., Eriksson S. Characterization of alpha1-antitrypsin in the inclusion bodies from the liver in alpha 1-antitrypsin deficiency. N. Engl. J. Med. 1975;293:576–579. doi: 10.1056/NEJM197509182931203. [DOI] [PubMed] [Google Scholar]
- 20.Yamasaki M., Sendall T.J., Pearce M.C., Whisstock J.C., Huntington J.A. Molecular basis of alpha1-antitrypsin deficiency revealed by the structure of a domain-swapped trimer. EMBO Rep. 2011;12:1011–1017. doi: 10.1038/embor.2011.171. [DOI] [PMC free article] [PubMed] [Google Scholar]
- 21.Sprague B.L., McNally J.G. FRAP analysis of binding: proper and fitting. Trends Cell Biol. 2005;15:84–91. doi: 10.1016/j.tcb.2004.12.001. [DOI] [PubMed] [Google Scholar]
- 22.Miedel M.T., Graf N.J., Stephen K.E., Long O.S., Pak S.C., Perlmutter D.H., Silverman G.A., Luke C.J. A Pro-cathepsin L mutant is a luminal substrate for endoplasmic-reticulum-associated degradation in C. elegans. PLoS ONE. 2012;7:e40145. doi: 10.1371/journal.pone.0040145. [DOI] [PMC free article] [PubMed] [Google Scholar]
- 23.Melendez A., Talloczy Z., Seaman M., Eskelinen E.L., Hall D.H., Levine B. Autophagy genes are essential for dauer development and life-span extension in C. elegans. Science. 2003;301:1387–1391. doi: 10.1126/science.1087782. [DOI] [PubMed] [Google Scholar]
- 24.Cohen E., Dillin A. The insulin paradox: aging, proteotoxicity and neurodegeneration. Nat. Rev. Neurosci. 2008;9:759–767. doi: 10.1038/nrn2474. [DOI] [PMC free article] [PubMed] [Google Scholar]
- 25.Cohen E., Bieschke J., Perciavalle R.M., Kelly J.W., Dillin A. Opposing activities protect against age-onset proteotoxicity. Science. 2006;313:1604–1610. doi: 10.1126/science.1124646. [DOI] [PubMed] [Google Scholar]
- 26.Cohen E., Paulsson J.F., Blinder P., Burstyn-Cohen T., Du D., Estepa G., Adame A., Pham H.M., Holzenberger M., Kelly J.W., et al. Reduced IGF-1 signaling delays age-associated proteotoxicity in mice. Cell. 2009;139:1157–1169. doi: 10.1016/j.cell.2009.11.014. [DOI] [PMC free article] [PubMed] [Google Scholar]
- 27.Morley J.F., Brignull H.R., Weyers J.J., Morimoto R.I. The threshold for polyglutamine-expansion protein aggregation and cellular toxicity is dynamic and influenced by aging in Caenorhabditis elegans. Proc. Natl Acad. Sci. USA. 2002;99:10417–10422. doi: 10.1073/pnas.152161099. [DOI] [PMC free article] [PubMed] [Google Scholar]
- 28.Florez-McClure M.L., Hohsfield L.A., Fonte G., Bealor M.T., Link C.D. Decreased insulin-receptor signaling promotes the autophagic degradation of beta-amyloid peptide in C. elegans. Autophagy. 2007;3:569–580. doi: 10.4161/auto.4776. [DOI] [PubMed] [Google Scholar]
- 29.Zhang T., Mullane P.C., Periz G., Wang J. TDP-43 neurotoxicity and protein aggregation modulated by heat shock factor and insulin/IGF-1 signaling. Hum. Mol. Genet. 2011;20:1952–1965. doi: 10.1093/hmg/ddr076. [DOI] [PMC free article] [PubMed] [Google Scholar]
- 30.Hardy J., Selkoe D.J. The amyloid hypothesis of Alzheimer's disease: progress and problems on the road to therapeutics. Science. 2002;297:353–356. doi: 10.1126/science.1072994. [DOI] [PubMed] [Google Scholar]
- 31.Winston W.M., Molodowitch C., Hunter C.P. Systemic RNAi in C. elegans requires the putative transmembrane protein SID-1. Science. 2002;295:2456–2459. doi: 10.1126/science.1068836. [DOI] [PubMed] [Google Scholar]
- 32.Tijsterman M., May R.C., Simmer F., Okihara K.L., Plasterk R.H. Genes required for systemic RNA interference in Caenorhabditis elegans. Curr. Biol. 2004;14:111–116. doi: 10.1016/j.cub.2003.12.029. [DOI] [PubMed] [Google Scholar]
- 33.Tabara H., Sarkissian M., Kelly W.G., Fleenor J., Grishok A., Timmons L., Fire A., Mello C.C. The rde-1 gene, RNA interference, and transposon silencing in C. elegans. Cell. 1999;99:123–132. doi: 10.1016/s0092-8674(00)81644-x. [DOI] [PubMed] [Google Scholar]
- 34.Simmer F., Tijsterman M., Parrish S., Koushika S.P., Nonet M.L., Fire A., Ahringer J., Plasterk R.H. Loss of the putative RNA-directed RNA polymerase RRF-3 makes C. elegans hypersensitive to RNAi. Curr. Biol. 2002;12:1317–1319. doi: 10.1016/s0960-9822(02)01041-2. [DOI] [PubMed] [Google Scholar]
- 35.Hidvegi T., Schmidt B.Z., Hale P., Perlmutter D.H. Accumulation of mutant alpha1-antitrypsin Z in the endoplasmic reticulum activates caspases-4 and -12, NFkappaB, and BAP31 but not the unfolded protein response. J. Biol. Chem. 2005;280:39002–39015. doi: 10.1074/jbc.M508652200. [DOI] [PubMed] [Google Scholar]
- 36.Perlmutter D.H. In: Molecular Pathology of Liver Diseases. Monga S.P.S., editor. New York: Springer; 2011. pp. 683–700. ISBN: 10.1007/978-1-4419-7107-4. [Google Scholar]
- 37.Schmidt B.Z., Perlmutter D.H. Grp78, Grp94, and Grp170 interact with alpha1-antitrypsin mutants that are retained in the endoplasmic reticulum. Am. J. Physiol. Gastrointest. Liver Physiol. 2005;289:G444–G455. doi: 10.1152/ajpgi.00237.2004. [DOI] [PubMed] [Google Scholar]
- 38.Kruse K.B., Brodsky J.L., McCracken A.A. Characterization of an ERAD gene as VPS30/ATG6 reveals two alternative and functionally distinct protein quality control pathways: one for soluble Z variant of human alpha-1 proteinase inhibitor (A1PiZ) and another for aggregates of A1PiZ. Mol. Biol. Cell. 2006;17:203–312. doi: 10.1091/mbc.E04-09-0779. [DOI] [PMC free article] [PubMed] [Google Scholar]
- 39.Qu D., Teckman J.H., Omura S., Perlmutter D.H. Degradation of a mutant secretory protein, alpha1-antitrypsin Z, in the endoplasmic reticulum requires proteasome activity. J. Biol. Chem. 1996;271:22791–22795. doi: 10.1074/jbc.271.37.22791. [DOI] [PubMed] [Google Scholar]
- 40.Kamimoto T., Shoji S., Hidvegi T., Mizushima N., Umebayashi K., Perlmutter D.H., Yoshimori T. Intracellular inclusions containing mutant alpha1-antitrypsin Z are propagated in the absence of autophagic activity. J. Biol. Chem. 2006;281:4467–4476. doi: 10.1074/jbc.M509409200. [DOI] [PubMed] [Google Scholar]
- 41.Teckman J.H., Perlmutter D.H. Retention of mutant alpha(1)-antitrypsin Z in endoplasmic reticulum is associated with an autophagic response. Am. J. Physiol. Gastrointest. Liver Physiol. 2000;279:G961–G974. doi: 10.1152/ajpgi.2000.279.5.G961. [DOI] [PubMed] [Google Scholar]
- 42.Boccitto M., Lamitina T., Kalb R.G. Daf-2 signaling modifies mutant SOD1 toxicity in C. elegans. PLoS ONE. 2012;7:e33494. doi: 10.1371/journal.pone.0033494. [DOI] [PMC free article] [PubMed] [Google Scholar]
- 43.Killick R., Scales G., Leroy K., Causevic M., Hooper C., Irvine E.E., Choudhury A.I., Drinkwater L., Kerr F., Al-Qassab H., et al. Deletion of Irs2 reduces amyloid deposition and rescues behavioural deficits in APP transgenic mice. Biochem. Biophys. Res. Commun. 2009;386:257–262. doi: 10.1016/j.bbrc.2009.06.032. [DOI] [PMC free article] [PubMed] [Google Scholar]
- 44.Wang D., Ruvkun G. Regulation of Caenorhabditis elegans RNA interference by the daf-2 insulin stress and longevity signaling pathway. Cold Spring Harb. Symp. Quant. Biol. 2004;69:429–431. doi: 10.1101/sqb.2004.69.429. [DOI] [PubMed] [Google Scholar]
- 45.Grishok A., Sinskey J.L., Sharp P.A. Transcriptional silencing of a transgene by RNAi in the soma of C. elegans. Genes Dev. 2005;19:683–696. doi: 10.1101/gad.1247705. [DOI] [PMC free article] [PubMed] [Google Scholar]
- 46.Shirayama M., Seth M., Lee H.C., Gu W., Ishidate T., Conte D., Jr, Mello C.C. piRNAs initiate an epigenetic memory of nonself RNA in the C. elegans germline. Cell. 2012;150:65–77. doi: 10.1016/j.cell.2012.06.015. [DOI] [PMC free article] [PubMed] [Google Scholar]
- 47.Gibbings D.J., Ciaudo C., Erhardt M., Voinnet O. Multivesicular bodies associate with components of miRNA effector complexes and modulate miRNA activity. Nat. Cell. Biol. 2009;11:1143–1149. doi: 10.1038/ncb1929. [DOI] [PubMed] [Google Scholar]
- 48.Lee Y.S., Pressman S., Andress A.P., Kim K., White J.L., Cassidy J.J., Li X., Lubell K., Lim do H., Cho I.S., et al. Silencing by small RNAs is linked to endosomal trafficking. Nat. Cell Biol. 2009;11:1150–1156. doi: 10.1038/ncb1930. [DOI] [PMC free article] [PubMed] [Google Scholar]
- 49.Jialin G., Xuefan G., Huiwen Z. SID1 transmembrane family, member 2 (Sidt2): a novel lysosomal membrane protein. Biochem. Biophys. Res. Commun. 2010;402:588–594. doi: 10.1016/j.bbrc.2010.09.133. [DOI] [PubMed] [Google Scholar]
- 50.Pei J., Millay D.P., Olson E.N., Grishin N.V. CREST—a large and diverse superfamily of putative transmembrane hydrolases. Biol. Direct. 2011;6:37. doi: 10.1186/1745-6150-6-37. [DOI] [PMC free article] [PubMed] [Google Scholar]
- 51.Hoogewijs D., Houthoofd K., Matthijssens F., Vandesompele J., Vanfleteren J.R. Selection and validation of a set of reliable reference genes for quantitative sod gene expression analysis in C. elegans. BMC Mol. Biol. 2008;9:9. doi: 10.1186/1471-2199-9-9. [DOI] [PMC free article] [PubMed] [Google Scholar]
- 52.Wood W.B., Hecht R., Carr S., Vanderslice R., Wolf N., Hirsh D. Parental effects and phenotypic characterization of mutations that affect early development in Caenorhabditis elegans. Dev. Biol. 1980;74:446–469. doi: 10.1016/0012-1606(80)90445-5. [DOI] [PubMed] [Google Scholar]
- 53.Kaplan E.L., Meier P. Nonparametric-estimation from incomplete observations. J. Am. Stat. Assoc. 1958;53:457–481. [Google Scholar]
- 54.Phair R.D., Gorski S.A., Misteli T. Measurement of dynamic protein binding to chromatin in vivo, using photobleaching microscopy. Methods Enzymol. 2004;375:393–414. doi: 10.1016/s0076-6879(03)75025-3. [DOI] [PubMed] [Google Scholar]
- 55.Soumpasis D.M. Theoretical analysis of fluorescence photobleaching recovery experiments. Biophys. J. 1983;41:95–97. doi: 10.1016/S0006-3495(83)84410-5. [DOI] [PMC free article] [PubMed] [Google Scholar]
- 56.Sprague B.L., Pego R.L., Stavreva D.A., McNally J.G. Analysis of binding reactions by fluorescence recovery after photobleaching. Biophys. J. 2004;86:3473–3495. doi: 10.1529/biophysj.103.026765. [DOI] [PMC free article] [PubMed] [Google Scholar]
- 57.Kamath R.S., Ahringer J. Genome-wide RNAi screening in Caenorhabditis elegans. Methods. 2003;30:313–321. doi: 10.1016/s1046-2023(03)00050-1. [DOI] [PubMed] [Google Scholar]
Associated Data
This section collects any data citations, data availability statements, or supplementary materials included in this article.