

Abstract
To gain insights into the structural requirements for dopamine D2 and D3 agonists in the treatment of Parkinson’s disease (PD) and to elucidate the basis of selectivity for D3 over D2 (D2/D3), 3D quantitative structure-activity relationship (3D QSAR) investigations using CoMFA (comparative molecular field analysis) and CoMSIA (comparative molecular similarity indices analysis) methods were performed on a series of 45 structurally related D2 and D3 dopaminergic ligands. Two alignment methods (atom-based and flexible) and two charge calculation methods (Gasteiger-Hückel and AM1) were used in the present study. Overall, D2 affinity and selectivity (D2/D3) models performed better with r2cv values of 0.71 and 0.63 for CoMFA and 0.71 and 0.79 for CoMSIA, respectively. The corresponding predictive r2 values for the CoMFA and CoMSIA models were 0.92 and 0.86 and 0.91 and 0.78, respectively. The CoMFA models generated using flexible alignment outperformed the models with the atom-based alignment in terms of relevant statistics and interpretability of the generated contour maps while CoMSIA models obtained using atom-based alignment showed superiority in terms of internal and external predictive abilities. The presence of carbonyl group (C=O) attached to the piperazine ring and the hydrophobic biphenyl ring were found to be the most important features responsible for the D3 selectivity over D2. This study can be further utilized to design and develop selective and potent dopamine agonists to treat PD.
Keywords: CoMFA, CoMSIA, D2 affinity, D3 affinity, D3 selectivity
1. Introduction
Drug development using dopamine (DA) receptors (D1-like and D2-like) as targets for the treatment of psychiatric illnesses, drug abuse, neurodegenerative disorders such as Parkinson’s disease (PD), is a well-known and an established research area.1–2 The dopamine receptors belong to Type A G protein-coupled receptor (GPCR) family and are found in the central nervous system (CNS) (controlling neuronal signaling thereby modulating many important behaviors) and in the periphery (affecting cardiovascular and renal functions).3 The D1-like receptors (D1 and D5 subtypes) and the D2-like receptors (D2, D3 and D4 subtypes) transduce signals via adenylate cyclase, an effector molecule. Upon receptor activation, D1-like receptors activate adenylate cyclase whereas D2-like receptors inhibit it.4,5
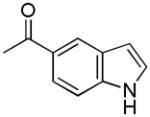
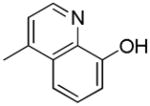
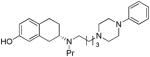
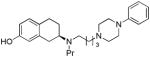
Due to predominant limbic location of D3 receptor in the CNS, selective D3-specific ligands are expected to have therapeutic applications in the treatment of psychiatric disorders and neurodegenerative diseases with much less undesirable side effects.1,2 In an attempt to develop dopamine D3-prefering agonists useful for the treatment of PD, our initial investigations were focused on ‘agonist-antagonist’ hybrid approach. Extensive structure-activity relationship (SAR) studies around previously identified lead molecules resulted in the development of potent and selective D3-prefering agonists/partial agonists.6 Table 1 shows the chemical structures of few lead compounds along with their binding affinity and selectivity data for the D2/D3 receptors. Using these compounds, a 3-point pharmacophore hypothesis incorporating the directional features for the H-bond donor/acceptor functionalities was proposed.7 The pharmacophore hypothesis depicted the common structural requirements for the D2/D3 receptor binding but failed to address the selectivity for D3 over D2 receptors. This could be due to several reasons including, but not limited to, a) higher level of structural similarity in the D2 and D3 receptors, mainly in the ligand-binding pocket, which make ligand-receptor interactions highly similar, and b) the complex nature of the D2/D3 receptor activation mechanisms. Despite plethora of information available on the dopamine receptor ligands (developed using analog-based molecular design or ‘indirect’ design approaches)8–17 as well as the 3D structural information (crystal structure of D3 receptor13a and homology models of D2 and D3 receptors – ‘direct’ design approaches), factors governing the selectivity for one receptor over the other are poorly understood. In continuation with our previous efforts to explore D3-selectivity modulating factors7, it was interesting to investigate this further with the help of well-known 3D quantitative structure-activity relationship (QSAR) methods, comparative molecular field analysis (CoMFA) and comparative molecular similarity indices analysis (CoMSIA). The range of affinity and selectivity data generated in-house for the dopamine D2/D3 receptor ligands presented a good starting point. A minor modification in one substructure led to significant alterations in the affinity and selectivity for D2 versus D3 receptors. Further bioisosteric replacements resulted in several interesting combinations of substructures (Table 1). The experimental testing of ‘design hypotheses’ only made us more curious. The present study is an attempt to shed light on the structural requirements of D2 and D3 receptor ligands for binding affinity and selectivity for D3 receptors using CoMFA and CoMSIA analyses. The outcome of these investigations may lead to improved designing of potent and selective ligands for one dopamine receptor subtype over the other (D2 over D3 or otherwise).
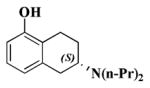
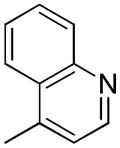
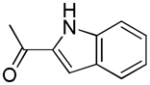
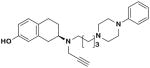
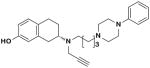
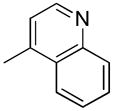
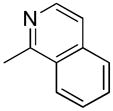
Table 1.
Molecular structures, binding potencies (D2 and D3) and the selectivity (D2/D3) of the ligands used in 3D QSAR studies
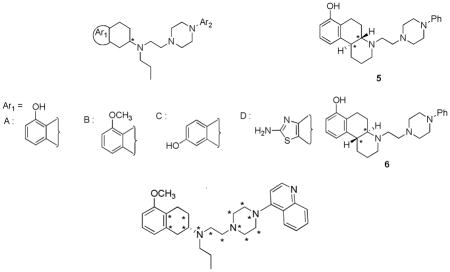 The points indicated by asterisk (*) were used for atom based alignment. | ||||||
|---|---|---|---|---|---|---|
| Compound No. | Ar1 | Ar2 | Stereochemistry | Ki (nM) | D2L/D3 | |
| D2L [3H]spiperone | D3 [3H]spiperone | |||||
| 1a |
|
220 ± 37.7 | 4.73 ± 0.64 | 46.5 | ||
| 2e | A | Ph | R | 238± 14 | 18.4±1.0 | 12.9 |
| 3e | A | Ph | S | 26.0 ± 7.5 | 0.82 ± 0.13 | 31.5 |
| 4c | B |
|
S | 3.74 ± 0.70 | 0.19 ± 0.03 | 19.7 |
| 5a | 23.6 ± 1.1 | 4.95 ± 1.1 | 4.8 | |||
| 6a | 835 ± 182 | 89.3 ± 19.4 | 9.4 | |||
| 7d | A |
|
S | 53.6 ± 12.3 | 2.36 ± 0.87 | 22.7 |
| 8e | A | 2′-OMePh | R | 88.7 ± 3.1 | 18.8 ± 4.2 | 4.7 |
| 9e | A | 2′-OMePh | S | 9.56 ± 2.29 | 0.46 ± 0.12 | 20.9 |
| 10d | A | 1′-(4′-(4″-pyridyl)phenyl | S | 13.2 ± 1.3 | 1.53 ± 0.18 | 8.6 |
| 11d | C | 1′-(4′-(4″-pyridyl)phenyl | S | 399 ± 16 | 16.2 ± 1.8 | 24.6 |
| 12b | A |
|
R | 113 ± 21 | 3.73 ± 0.56 | 30.2 |
| 13b | A |

|
S | 47.5 ± 6.2 | 0.57 ± 0.094 | 83 |
| 14b | A |
|
S | 157 ± 35 | 2.27 ± 0.52 | 69.2 |
| 15f | A |

|
S | 3.75± 0.63 | 1.28 ± 0.08 | 2.9 |
| 16f | A |
|
R | 20.7 ± 1.5 | 7.73 ± 0.64 | 2.7 |
| 17a | C | Ph | S | 809 ± 65 | 38.6 ± 0.7 | 20.9 |
| 18b | C | Ph | R | 40.6 ± 3.6 | 1.77 ± 0.42 | 22.9 |
| 19f | C |

|
R | 4.55± 0.59 | 1.27 ± 0.15 | 3.6 |
| 20e |
|
S | 19.4 ±1.3 | 1.22 ± 0.37 | 15.9 | |
| 21e |
|
R | 19.3 ± 1.5 | 0.74 ± 0.069 | 25.8 | |
| 22e |
|
R | 32.9 ± 8.6 | 0.76 ± 0.079 | 43.2 | |
| 23e |
|
S | 25.2 ± 7.3 | 0.35 ± 0.03 | 71.0 | |
| 24d | C |
|
R | 58.0 ± 14.7 | 2.79 ± 0.73 | 20.8 |
| 25d | C | 1′-(4′-(4″-pyridyl)phenyl | R | 24.7 ± 5.8 | 0.78 ± 0.22 | 32.0 |
| 26g |
|
6740 ± 510 | 11.7 ± 2.5 | 576.1 | ||
| 27g | D | Ph | S | 243 ± 65 | 4.15 ± 0.76 | 58.6 |
| 28g | D | Ph | R | 1979± 567 | 44.0 ± 10.6 | 45.0 |
| 29g | D | 2′-OMePh | S | 288 ± 86 | 7.01 ± 1.16 | 41.1 |
| 30g | D | 2′-OMePh | R | 243 ± 47 | 101± 41 | 2.4 |
| 31g | D | 2′,3′-Cl2Ph | S | 56.8 ± 15.4 | 1.80± 0.32 | 31.6 |
| 32g | D | 2′,3′-Cl2Ph | R | 44.2 ± 6.9 | 12± 2.9 | 3.7 |
| 33g | D |
|
S | 264 ± 40 | 0.92± 0.23 | 253 |
| 34c | D |
|
S | 109 ± 14 | 2.61± 0.18 | 41.8 |
| 35c | D |
|
S | 269 ± 16 | 2.23± 0.60 | 121 |
| 36c | D |
|
S | 57.7 ± 3.3 | 1.21± 0.16 | 47.7 |
| 37c | D |
|
S | 270 ± 28 | 4.78 ± 0.89 | 56.5 |
| 38h | D |
|
S | 27.1 ± 5.0 | 4.98 ± 0.78 | 5.4 |
| 39h | D |

|
R | 190 ± 29 | 13.2 ± 2.3 | 14.5 |
| 40i | D |
|
R | 2558 ± 112 | 54.1 ± 4.2 | 47.3 |
| 41i | D |

|
S | 1073 ± 92 | 1.84 ± 0.51 | 583 |
| 42i | D |
|
S | 902 ± 130 | 1.09 ± 0.14 | 828 |
| 43i | D |
|
R | 1316 ± 244 | 48.2 ± 8.6 | 27.3 |
| 44i | D |
|
R | 2626 ± 229 | 52.8 ± 8.3 | 49.7 |
| 45i | D |

|
S | 1031 ± 182 | 1.40 ± 0.29 | 736 |
Please see Ref. 7 (Brown, et al. 2008);
Please see Ref. 26 (Brown, et al. 2009);
Please see Ref. 29 (Ghosh, et al. 2010);
Please see Ref. 27 (Ghosh, et al. 2010);
Please see Ref. 25 (Biswas, et al. 2008));
Please see Ref. 28 (Ghosh, et al. 2010));
Please see Ref. 24 (Biswas, et al. 2008);
Please see Ref. 30 (Gogoi, et al. 2011);
Please see Ref. 31 (Johnson, et al. 2012)
2. Results and Discussion
The design and development of the dopamine D2/D3 agonists using the hybrid approach involved combination of an agonist moiety (e. g., aminothiazole, aminotetraline or bioisosteric equivalent) with (un)substituted arylpiperazine substructure via a suitable linker. Initial SAR studies around the early lead structures focused mainly on the optimization of the linker length and the arylpiperazine moiety. Several conformationally flexible and rigid molecules were synthesized and tested. Once the linker length and possible arylpiperazine moieties were identified, the agonist part of the molecule was varied. These extensive efforts led to structurally diverse, novel molecules. In the present study, a data set of 45 structurally diverse molecules (Table 1) was used to derive the 3D QSAR models. The position of the –OH group on the aminotetraline head group, presence of –C=O group and the absolute configuration (R or S) of these molecules posed obvious problems for the alignment. Two different alignment methods, atom-based and flexible were tried. Thus, D2 and D3 affinity models were built using both alignments rules and compound 4, the most active analog for both the D2 and D3 receptors, as a template for alignmnet. Similarly, D2/D3 selectivity models were constructed using the two alignment types but with compound 42, the most selective analog, as the template. As expected, the flexible alignment provided better superimposition of the data set onto the templates. The representative alignments obtained from the atom-based and flexible modes are shown in Figure 1.
Figure 1.

a) Flexible and b) atom-based alignments of the dataset molecules onto compound 4 (template)
2.1 CoMFA analyses: D2 and D3 receptor binding affinity
With the help of carefully selected training sets of 37 molecules comprising of enatiomers, statistically significant CoMFA models were obtained. The results of CoMFA analyses are summarized in Table 2. Since the experimental activity varied significantly for D2, D3 and selectivity (D2/D3), different training and test set were used for all three cases. The resulting models showed poor internal predictive ability (r2cv < 0.3) (data not shown). Examination of the residuals from the non-cross-validated PLS analysis of the models using all compounds as training set led to identification of the compounds 6, 11 and 17 as common outliers for both D2 and D3 models. Systematic removal of these outliers from the data set resulted in improved statistics (Table 2). The 3D QSAR model is considered statistically significant if r2cv is greater than 0.3, although a value greater than 0.4 is normally desirable.18 For dopamine D2 binding affinity, both alignments resulted in models comparable in terms of relevant statistical parameters.
Table 2.
Summary of 3D QSAR CoMFA results
| Atom-based alignment | Flexible alignment | |||||
|---|---|---|---|---|---|---|
|
| ||||||
| pKi D2a | pKi D3b | Selectivity (D2/D3)c | pKi D2d | pKi D3e | Selectivity (D2/D3)f | |
| Test set molecules | 8, 9, 13, 16, 19, 27, 40, 41 | 5, 8, 10, 23, 24, 32, 33, 40 | 6, 8, 13, 18, 22, 24, 31, 41 | 8, 9, 13, 16, 19, 27, 40, 41 | 5, 8, 10, 23, 24, 32, 33, 40 | 6, 8, 13, 18, 22, 24, 31, 41 |
| r2cv | 0.657 | 0.422 | 0.626 | 0.713 | 0.453 | 0.634 |
| r2conv | 0.903 | 0.964 | 0.976 | 0.920 | 0.941 | 0.958 |
| SEE | 0.258 | 0.143 | 0.111 | 0.234 | 0.169 | 0.145 |
| Components | 4 | 5 | 5 | 4 | 5 | 5 |
| F values | 67.507 | 145.94 | 208.99 | 83.140 | 89.538 | 118.68 |
| Pr2=0 | 0.00 | 0.00 | 0. 00 | 0.00 | 0. 00 | 0.00 |
| Fractions | ||||||
| Steric | 0.447 | 0.424 | 0.437 | 0.415 | 0.636 | 0.528 |
| Electrostatic | 0.553 | 0.576 | 0.563 | 0.585 | 0.364 | 0.472 |
| r2pred | 0.852 | 0.249 | 0.849 | 0.926 | 0.710 | 0.864 |
| σmin | 2.0 | 2.0 | 2.0 | 2.0 | 2.0 | 2.0 |
Model based on atom-based alignment and AM1 charges
Model based on atom-based alignment and AM1 charges
Model based on atom-based alignment and AM1 charges
Model based on flexible alignment and AM1 charges
Model based on flexible alignment and Gasteiger-Hückel charges
Model based on flexible alignment and AM1 charges
For D2, the best CoMFA model was based on flexible alignment with AM1 charges (Model d) with r2cv of 0.713 (4 components), conventional r2 of 0.920 and standard error of estimate (SEE) of 0.234. This model also showed excellent predictive capability with r2 pred of 0.926. Interestingly, for dopamine D3 receptor binding affinity, the best CoMFA model was based on flexible alignment with Gasteiger–Hückel charges (Model e) with the r2cv of 0.453 (5 components), r2conv of 0.941, SEE of 0.169 and r2 pred of 0.710. In comparison, the CoMFA models generated using the atom-based alignment exhibited poor external predictions (Model b, Table 2). The experimental and fitted/predicted pKi values for the training and test sets of the best D2 and D3 CoMFA models (Models d and e, respectively) are given in Table 3. The plots of fitted versus experimental activity values for the training set molecules and predicted versus experimental values for the test set molecules for the D2 CoMFA model d are shown in Figures 2a and 2c, respectively. The corresponding CoMFA predicted plots for D3 model e are shown in Figure 2b and 2d, respectively. The steric field describes 41.5% and 63.6% of variance for dopamine D2 and D3 binding affinities, respectively (refer Table 2, Model d and e), while the corresponding contributions from the electrostatic field were found to be 58.5% and 36.4%, respectively. The higher contribution of the electrostatic field may denote the importance of ‘solvation-desolvation’ processes crucial for the observed differences in binding affinities for the D2/D3 receptors.
Table 3.
Experimental and fitted/predicted activities of D2/D3 ligands used as the training and test sets for CoMFA and CoMSIA analyses
| Sr. No. | pKia | |||||||||
|---|---|---|---|---|---|---|---|---|---|---|
| Experimental | Fitted/Predicted | |||||||||
| CoMFA | CoMSIA | |||||||||
| D2L | D3 | D2L | Rsd1 | D3 | Rsd2 | D2L | Rsd3 | D3 | Rsd4 | |
| 1 | 6.657 | 8.325 | 6.687 | −0.037 | 8.261 | 0.064 | 6.470 | 0.180 | 8.49 | −0.165 |
| 2 | 6.623 | 7.735 | 7.157 | −0.534 | 7.987 | −0.251 | 7.243 | −0.625 | 7.742 | −0.006 |
| 3 | 7.585 | 9.086 | 7.413 | 0.172 | 8.834 | 0.252 | 7.463 | 0.122 | 8.659 | 0.426 |
| 4 | 8.427 | 9.721 | 8.371 | 0.058 | 9.607 | 0.113 | 8.208 | 0.218 | 9.953 | −0.231 |
| 5 | 7.627 | 8.305 | 7.492 | 0.134 | 8.205 | 0.100 | 7.705 | −0.077 | 7.987 | 0.318 |
| 6 | 6.078 | 7.049 | 7.423 | −1.344 | 9.167 | −2.118 | 7.724 | −1.645 | 9.430 | −2.380 |
| 7 | 7.270 | 8.627 | 7.447 | −0.176 | 8.809 | −0.181 | 7.361 | −0.090 | 8.703 | −0.075 |
| 8 | 7.052 | 7.725 | 7.363 | −0.311 | 8.093 | −0.368 | 7.198 | −0.145 | 8.113 | −0.387 |
| 9 | 8.019 | 9.337 | 7.796 | 0.214 | 8.911 | 0.425 | 7.594 | 0.416 | 8.822 | 0.514 |
| 10 | 7.879 | 8.815 | 7.998 | −0.119 | 8.935 | −0.119 | 7.851 | 0.028 | 8.770 | 0.044 |
| 11 | 6.399 | 7.790 | 9.942 | −3.542 | 9.134 | −1.343 | 7.675 | −1.276 | 9.494 | −1.704 |
| 12 | 6.946 | 8.428 | 7.054 | −0.108 | 8.304 | 0.124 | 6.923 | 0.022 | 8.361 | 0.066 |
| 13 | 7.323 | 9.244 | 7.109 | 0.214 | 9.174 | 0.069 | 7.089 | 0.233 | 9.194 | 0.050 |
| 14 | 6.804 | 8.643 | 6.936 | −0.131 | 8.648 | −0.005 | 6.685 | 0.118 | 8.769 | −0.125 |
| 15 | 8.425 | 8.892 | 8.562 | −0.136 | 9.07 | −0.178 | 8.212 | 0.212 | 9.063 | −0.170 |
| 16 | 7.684 | 8.111 | 8.204 | −0.520 | 8.189 | 0.077 | 8.241 | −0.558 | 8.092 | 0.091 |
| 17 | 6.092 | 7.413 | 7.432 | −1.339 | 9.134 | −1.721 | 7.679 | −1.586 | 9.553 | −2.139 |
| 18 | 7.391 | 8.752 | 7.188 | 0.202 | 8.504 | 0.248 | 7.391 | 0.000 | 8.73 | 0.022 |
| 19 | 8.341 | 8.896 | 8.061 | 0.280 | 8.899 | −0.003 | 8.313 | 0.027 | 9.008 | −0.112 |
| 20 | 7.712 | 8.913 | 7.834 | −0.121 | 9.114 | −0.183 | 7.593 | 0.119 | 9.146 | −0.215 |
| 21 | 7.714 | 9.130 | 7.546 | 0.168 | 9.345 | −0.215 | 7.576 | 0.138 | 8.968 | 0.162 |
| 22 | 7.482 | 9.119 | 7.302 | 0.180 | 9.152 | −0.032 | 7.483 | −0.001 | 9.044 | 0.075 |
| 23 | 7.598 | 9.455 | 7.698 | −0.099 | 9.061 | 0.393 | 7.730 | −0.132 | 9.529 | −0.074 |
| 24 | 7.236 | 8.554 | 7.198 | 0.038 | 8.700 | −0.146 | 7.417 | −0.180 | 8.770 | −0.216 |
| 25 | 7.607 | 9.107 | 7.429 | 0.177 | 9.019 | 0.087 | 7.565 | 0.042 | 9.152 | −0.044 |
| 26 | 5.171 | 7.931 | 5.125 | 0.045 | 7.814 | 0.116 | 4.967 | 0.204 | 8.036 | −0.104 |
| 27 | 6.614 | 8.381 | 6.533 | 0.081 | 8.274 | 0.106 | 6.779 | −0.165 | 8.05 | 0.331 |
| 28 | 5.703 | 7.356 | 6.113 | −0.410 | 7.418 | −0.061 | 6.326 | −0.622 | 7.705 | −0.349 |
| 29 | 6.540 | 8.154 | 6.465 | 0.074 | 8.328 | −0.174 | 6.697 | −0.157 | 8.121 | 0.032 |
| 30 | 6.614 | 6.995 | 6.367 | 0.247 | 7.059 | −0.063 | 6.563 | 0.050 | 7.312 | −0.317 |
| 31 | 7.245 | 8.744 | 7.045 | 0.200 | 8.795 | −0.050 | 7.039 | 0.206 | 8.439 | 0.305 |
| 32 | 7.354 | 7.920 | 6.805 | 0.548 | 7.897 | 0.022 | 6.841 | 0.513 | 7.385 | 0.535 |
| 33 | 6.630 | 9.033 | 6.480 | 0.150 | 8.308 | 0.725 | 6.415 | 0.215 | 8.096 | 0.936 |
| 34 | 6.962 | 8.583 | 7.108 | −0.146 | 8.815 | −0.232 | 7.251 | −0.288 | 8.699 | −0.116 |
| 35 | 6.570 | 8.651 | 6.910 | −0.340 | 8.725 | −0.074 | 6.548 | 0.022 | 8.778 | −0.126 |
| 36 | 7.238 | 8.917 | 7.118 | 0.120 | 8.802 | 0.114 | 7.028 | 0.209 | 8.947 | −0.029 |
| 37 | 6.568 | 8.320 | 6.651 | −0.082 | 8.437 | −0.116 | 6.841 | −0.273 | 8.267 | 0.053 |
| 38 | 7.567 | 8.302 | 7.226 | 0.340 | 8.195 | 0.107 | 7.619 | −0.052 | 8.248 | 0.054 |
| 39 | 6.721 | 7.879 | 7.020 | −0.298 | 7.661 | 0.218 | 6.880 | −0.158 | 7.786 | 0.093 |
| 40 | 5.592 | 7.266 | 5.815 | −0.223 | 7.872 | −0.606 | 5.681 | −0.088 | 8.069 | −0.802 |
| 41 | 5.969 | 8.735 | 6.061 | −0.091 | 8.794 | −0.059 | 5.870 | 0.099 | 8.856 | −0.120 |
| 42 | 6.044 | 8.962 | 5.911 | 0.133 | 9.047 | −0.084 | 5.955 | 0.089 | 8.811 | 0.150 |
| 43 | 5.880 | 7.316 | 5.972 | −0.092 | 7.361 | −0.044 | 5.792 | 0.088 | 7.679 | −0.363 |
| 44 | 5.580 | 7.277 | 5.682 | −0.101 | 7.333 | −0.055 | 5.786 | −0.205 | 7.035 | 0.242 |
| 45 | 5.986 | 8.853 | 6.040 | −0.054 | 8.755 | 0.098 | 5.926 | 0.059 | 8.778 | 0.075 |
pKi is the negative logarithm of equilibrium inhibition constant
ΔpKi = pKi D3 − pKi D2L
Rsd1: Residual between predicted and observed activity for D2 CoMFA model
Rsd2: Residual between predicted and observed activity for D3 CoMFA model
Rsd3: Residual between predicted and observed activity for D2 CoMSIA model
Rsd4: Residual between predicted and observed activity for D3 CoMSIA model
Figure 2.

Experimental versus fitted (training set) activity a) dopamine D2a and b) dopamine D3b from the CoMFA analyses of the training sets and experimental versus predicted (test set) activity c) dopamine D2a and d) dopamine D3b from the CoMFA analyses.
a The results are from flexible alignment and AM1 charges. b The results are from flexible alignment and Gasteiger-Hückel charges.
The LOO cross-validation method might lead to high r2cv values which do not necessarily reflect a general predictability of the models.19 Therefore, cross-validation using 10 groups was performed for 10 times. In this method, a model based on about 80% of the variable data predicts each target property. The mean r2cv values of 0.731 and 0.472 for D2 and D3 binding affinities, respectively, reveal that the models have good internal predictivity. To further assess the robustness of the model, boot-strapping analysis (10 groups) was performed and r2bs of 0.950 and 0.963 (SDbs= 0.016 and 0.014) was obtained for D2 and D3, respectively, which further establishes the robustness of the models.
2.2 CoMSIA analyses: D2 and D3 receptor binding affinity
A total of five fields, steric, electrostatics, hydrophobic, hydrogen bond donor (HDon) and acceptor (HAcc), as implemented in CoMSIA, were used for the generation of the 3D QSAR models. Initial analyses were performed using individual fields as well as various combinations of different fields. The models developed using all the fields gave statistically robust results. It emphasized the importance of hydrophobic, HDon, and HAcc fields in addition to steric and electrostatic fields for D2/D3 binding affinity of the ligands. The summary of the CoMSIA analyses is given in Table 4. For D2 binding affinity, CoMSIA model generated using atom-based alignment and AM1 charges performed better (Model a, Table 4) with r2cv of 0.719 (4 components), r2conv of 0.912, SEE of 0. 245 with r2pred of 0.911 than the corresponding model using flexible alignment and Gasteiger-Hückel charges (Model d, Table 4). Similarly, for D3 binding affinity, the best model generated using flexible alignment and Gasteiger-Hückel charges (Model e, Table 4) gave r2cv of 0.493 (6 components), r2conv of 0.898, SEE of 0. 227 with r2pred of 0.465. Removal of compound 33 (outlier as seen from high residual) improved the value of r2pred from 0.465 to 0.640. The experimental and fitted/predicted pKi values for the training and test sets are given in Table 3. The plots of fitted versus experimental activity values for the training set molecules and predicted versus experimental values for the test set molecules for the D2 CoMSIA model a are shown in Figures 3a and 3c, respectively. The corresponding CoMSIA predicted plots for D3 model e are shown in Figures 3b and 3d, respectively.
Table 4.
Summary of 3D QSAR CoMSIA results
| Atom-based alignment | Flexible alignment | |||||
|---|---|---|---|---|---|---|
|
| ||||||
| pKi D2a | pKi D3b | Selectivity (D2/D3)c | pKi D2d | pKi D3e | Selectivity (D2/D3)f | |
| Test set molecules | 8, 9, 13, 16, 19, 27, 40, 41 | 5, 8, 10, 23, 24, 32, 33, 40 | 6, 8, 13, 18, 22, 24,31,41 | 8, 9, 13, 16, 19, 27, 40, 41 | 5, 8, 10, 23, 24, 32, 33, 40 | 6, 8, 13, 18, 22, 24, 31, 41 |
| r2cv | 0.719 | 0.426 | 0.797 | 0.697 | 0.493 | 0.786 |
| r2conv | 0.912 | 0.963 | 0.94 | 0.912 | 0.898 | 0.967 |
| SEE | 0.245 | 0.151 | 0.161 | 0.246 | 0.227 | 0.122 |
| Comp. | 4 | 7 | 3 | 4 | 6 | 4 |
| F values | 75.51 | 93.179 | 141.33 | 75.018 | 39.5 | 190.65 |
| Pr2=0 | 0 | 0 | 0. 00 | 0 | 0. 00 | 0 |
| Fractions | ||||||
| Steric | 0.069 | 0.055 | 0.059 | 0.078 | 0.028 | 0.068 |
| Electrost. | 0.157 | 0.194 | 0.18 | 0.156 | 0.113 | 0.143 |
| Hydrophobic | 0.205 | 0.174 | 0.164 | 0.227 | 0.204 | 0.173 |
| Donor | 0.229 | 0.308 | 0.283 | 0.211 | 0.323 | 0.277 |
| Acceptor | 0.34 | 0.268 | 0.314 | 0.328 | 0.332 | 0.339 |
| r2pred | 0.911 | 0.335 | 0.781 | 0.814 | 0.64 | 0.719 |
| σmin | 2.0 | 2.0 | 2.0 | 2.0 | 2.0 | 2.0 |
Model based on atom-based alignment and AM1 charges
Model based on atom-based alignment and AM1 charges
Model based on atom-based alignment and AM1 charges
Model based flexible alignment and Gasteiger-Hückel charges
Model based on flexible alignment and Gasteiger-Hückel charges
Model based on flexible alignment and Gasteiger-Hückel charges
Figure 3.

Experimental versus fitted (training set) activity a) dopamine D2a and b) dopamine D3b from the CoMSIA analyses of the training sets and experimental versus predicted (test set) activity c) dopamine D2a and d) dopamine D3b from the CoMSIA analyses. aThe results are from atom-based alignment and AM1 charges. bThe results are from flexible alignment and Gasteiger-Hückel charges.
The field contributions for 3D QSAR CoMSIA models are given in Table 4. For cross-validation using 10 groups, the mean r2cv values of 0.726 and 0.456 were found for D2 and D3, respectively, while r2bs of 0.951 (SDbs=0.013) and 0.936 (SDbs=0.020) were obtained for D2 and D3, respectively.
Compounds 6, 11, and 17 were found to be outliers in CoMFA and CoMSIA models for both D2 and D3 affinity, therefore, not included in the analyses. The outlier behavior could be due to several factors. One of the possible reasons could be the structural properties, including stereochemistry, of these compounds. The outlier behavior of compound 6 could be due to its constrained structure along with R stereochemistry. For this series of hybrid molecules, it was observed that the compounds with 5-OH DPAT as agonist head group (substructure containing pharmacophoric features for dopamine ligands7) with R stereochemistry were less potent than their corresponding S isomers. However, it has been observed that compounds containing 7-OH-DPAT as agonist head group with S stereochemistry due to reorientation loses the favorable interaction with the receptor.
2.3 CoMFA and CoMSIA analyses: Selectivity for D3 over D2 receptors
In order to understand the structural features responsible for D3 selectivity, 3D QSAR models were generated using both, the atom-based and flexible alignments. The resulting models showed poor internal predictivity (r2cv <0.3) (data not shown). Various combinations of the training and test sets did not improve the statistics. As described previously, compounds showing high residuals were identified. Systemic removal of these outliers from the data set resulted in improvement of the statistics.
The summary of the 3D QSAR models is shown in Tables 2 (CoMFA) and 4 (CoMSIA). The best CoMFA model was obtained using flexible alignment and AM1 charges (model f, Table 2) while the best CoMSIA model was based on atom-based alignment and AM1 charges (model c, Table 4). The best CoMFA model for selectivity (n=40) exhibited r2cv of 0.634 (5 components), r2conv of 0.958, and SEE of 0.145. This model also showed good external predictivity with r2pred of 0.864. In case of cross-validation using 10 groups, the mean r2cv value of 0.640 was found for selectivity model while r2 bs of 0.984 (SDbs=0.009) was obtained.
The best CoMSIA model for selectivity (n=39) showed r2cv of 0.797 (3 components), r2conv of 0.940, SEE of 0.161, and r2pred of 0.781. The mean r2cv value of 0.795 was found for cross-validation using 10 groups for the selectivity model while r2bs value of 0.955 (SD bs=0.016) further confirmed the robustness of the model. The experimental and fitted/predicted pKi values for the training and test sets are given in Table 5. The plots of fitted versus experimental activity values for the training set molecules and predicted versus experimental values for the test set molecules are given in Figures 4a, 4b and 4c, 4d, respectively.
Table 5.
Experimental and fitted/predicted activities of D2/D3 ligands used as the training and test sets for selectivity (D3 over D2) analyses using CoMFA and CoMSIA
| Sr. No. | pKi | ||||
|---|---|---|---|---|---|
| Experimental | Fitted/Predicted | ||||
| CoMFA | Rsd5 | CoMSIA | Rsd6 | ||
| 1 | 1.668 | 1.685 | −0.017 | 1.766 | −0.095 |
| 2 | 1.112 | 1.210 | −0.098 | 1.191 | −0.079 |
| 3 | 1.501 | 1.270 | 0.231 | 1.214 | 0.286 |
| 4 | 1.294 | 1.195 | 0.099 | 1.085 | 0.208 |
| 5 | 0.678 | 0.620 | 0.058 | 0.809 | −0.130 |
| 6 | 0.971 | 0.865 | 0.106 | 0.929 | 0.041 |
| 7 | 1.357 | 1.212 | 0.145 | 1.296 | 0.060 |
| 8 | 0.673 | 1.021 | −0.348 | 1.304 | −0.631 |
| 9 | 1.318 | 1.054 | 0.264 | 1.032 | 0.295 |
| 10 | 0.936 | 0.804 | 0.132 | 0.963 | −0.026 |
| 11 | 1.391 | 1.449 | −0.058 | 1.497 | −0.106 |
| 12 | 1.482 | 1.592 | −0.11 | 1.601 | −0.119 |
| 13 | 1.921 | 1.523 | 0.398 | 1.616 | 0.304 |
| 14 | 1.839 | 1.811 | 0.028 | 1.945 | −0.106 |
| 15 | 0.467 | 0.386 | 0.081 | 0.622 | −0.155 |
| 16 | 0.427 | 0.469 | −0.042 | 0.401 | 0.025 |
| 17 | 1.321 | 1.434 | −0.113 | 1.408 | −0.087 |
| 18 | 1.361 | 1.242 | 0.119 | 1.394 | −0.033 |
| 19 | 0.555 | 0.674 | −0.119 | 0.792 | −0.236 |
| 20 | 1.201 | 1.382 | −0.181 | 1.353 | −0.133 |
| 21 | 1.416 | 1.545 | −0.129 | 1.392 | 0.023 |
| 22 | 1.637 | 1.445 | 0.192 | 1.431 | 0.257 |
| 23 | 1.857 | 1.912 | −0.055 | 1.563 | 0.293 |
| 24 | 1.318 | 1.345 | −0.027 | 1.495 | −0.176 |
| 25 | 1.500 | 1.378 | 0.122 | 1.413 | 0.086 |
| 26 | 2.760 | 2.636 | 0.124 | 2.711 | 0.049 |
| 27 | 1.767 | 1.583 | 0.184 | 1.652 | 0.114 |
| 28 | 1.653 | 1.692 | −0.039 | 1.847 | −0.193 |
| 29 | 1.614 | 1.575 | 0.039 | 1.670 | −0.055 |
| 30 | 0.381 | 0.689 | −0.308 | 1.704 | −1.32 |
| 31 | 1.499 | 1.349 | 0.15 | 1.805 | −0.305 |
| 32 | 0.566 | 1.637 | −1.071 | 1.681 | −1.114 |
| 33 | 2.403 | 2.406 | −0.003 | 2.084 | 0.319 |
| 34 | 1.621 | 1.785 | −0.164 | 1.741 | −0.120 |
| 35 | 2.081 | 1.958 | 0.123 | 1.981 | 0.100 |
| 36 | 1.679 | 1.788 | −0.109 | 1.637 | 0.042 |
| 37 | 1.752 | 1.918 | −0.166 | 1.760 | −0.007 |
| 38 | 0.735 | 1.756 | −1.021 | 1.601 | −0.866 |
| 39 | 1.158 | 1.133 | 0.025 | 1.232 | −0.074 |
| 40 | 1.674 | 2.906 | −1.232 | 3.007 | 1.332 |
| 41 | 2.766 | 3.029 | −0.263 | 3.043 | −0.277 |
| 42 | 2.918 | 2.827 | 0.091 | 2.958 | −0.040 |
| 43 | 1.436 | 2.711 | 1.275 | 2.931 | −1.495 |
| 44 | 1.697 | 2.776 | −1.079 | 2.961 | −1.126 |
| 45 | 2.867 | 2.930 | −0.063 | 3.006 | −0.138 |
Rsd5: Residual between predicted and observed selectivity for D3 CoMFA model
Rsd2: Residual between predicted and observed selectivity for D3 CoMSIA model
Figure 4.

Experimental versus fitted (training set) selectivity (D2/D3) from a) CoMFA analysesa and b) CoMSIA analysesb of the training sets and experimental versus predicted (test set) selectivity (D2/D3) from c) CoMFA analysesa and d) CoMSIA analysesb. aThe results are from flexible alignment and AM1 charges. bThe results are from atom-based alignment and AM1 charges.
Compounds 30, 32, 38, 40, 43 and 44 were found to be outliers and therefore, not included in the analyses. The reasons for this observation could be many-fold. Since the selectivity values represent affinity differences, the experimental uncertainty due to error propagation from both the affinity values is likely to be higher.19 For these series of hybrid molecules, it was observed that the compounds with R stereochemistry exhibited lower affinity than their corresponding S isomers.
2.4 Graphical Interpretation of the CoMFA and CoMSIA models
CoMFA and CoMSIA contour maps were generated by interpolating the product between 3D QSAR coefficients and their associated standard deviations. The 3D representation of the field contributions defined as “STDEV*COEFF” contour maps which can provide better insights into the key structural features responsible for the variations in experimental binding affinities. Figure 5a shows the steric and electrostatic CoMFA contour maps derived from flexible alignment and AM1 charges for D2 affinity while Figure 5b shows the corresponding maps generated using flexible alignment and Gasteiger-Hückel charges for D3 affinity with the most active compound 4 shown inside the fields. The green contours (contribution level 80%) suggest that increase in steric bulk would result into an increase in activity, whereas yellow contours (contribution level 20%) suggest the opposite - a sterically bulky group would lead to decreased activity. Similarly, the blue (contribution level 80%) and red (contribution level 20%) contours indicate regions where the addition of electropositive and electronegative substituents, respectively, would result in an increase in activity.
Figure 5.

CoMFA STDEV*COEFF contour plots showing steric and electrostatic features from analysis based on a) flexible alignment and AM1 charges for D2 affinity and b) flexible alignment and Gasteiger-Hückel charges for D3 affinity. Green polyhedra represent sterically favored areas (contribution level of 80%) and yellow polyhedra represent sterically disfavored areas (contribution level of 20%). For electrostatic fields, blue polyhedra (contribution level of 85% and 90% for D2 and D3 respectively) are regions of the molecule where more positive charge and H-bond donors are favored or negative charge or H-bond acceptors are disfavored for high-affinity interactions. Red fields (contribution level of 15%) are regions where negatively charged substituents and H-bond acceptors are favored or more positive charge and H-bond donors are disfavored. Compound 4 is shown inside the fields in both (a) and (b).
2.4.1 Dopamine D2 receptor binding affinity
The 3D QSAR contours are divided into two groups – one consisting of contours near the aminotetraline head group (Site 1) and the second group consisting of contours at or near the phenyl ring attached to piperazine (Site 2).
Presence of several sterically favored green and disfavored yellow contours (Figure 5a) surrounding the head group depicts stricter adherence to the limited steric bulk for both the D2 affinity. The head group is likely to be situated in a well-defined cavity in the ligand-binding pockets of the D2 and D3 receptors. A small green contour is overlapping the 5-methoxy group of aminotetraline moiety of compound 4 suggesting the requirement of steric bulk at this position for high affinity interaction. A sterically unfavorable yellow region around the aminotetraline moiety arises from the third ring of the conformationally rigid analog, 6, explaining its lower binding affinity for both the receptors compared to its conformationally flexible bicyclic counterpart 2. Similarly, the presence of a yellow contour near the N-propyl group of aminotetraline moiety suggests the detrimental effect of steric bulk near this position which is in consonance with other findings. In case of electrostatic contour maps, a small red contour is observed near the oxygen of 7 position of aminotetraline head group, indicating the critical importance of hydroxyl group for D2 affinity.
As shown in Figure 5a, a large sterically unfavorable yellow contour is observed in the vicinity of the quinoline ring of 4, indicating no steric bulk is allowed in this region and explains the lesser D2 affinity of the biphenyl analog 7 compared to 3 (Ki D2= 56.3 nM and 26.0 nM, respectively). Similarly, there are three small green regions located on the 6, 7 and 8 position of quinoline moiety which signifies the importance of limited steric bulk in this region. Lower affinity of compounds 2 and 3 compared to 4, 15, and 16 could be due to the above interpretation, among others.
The appearance of blue polyhedra pointing away from position 3 position of quinoline moiety (Figure 5a) indicates that this region should carry relatively lesser electron density or should be more electropositive in nature for better binding affinity for the D2 receptor. The carbonyl group of the compounds 12, 13, 14, 41, 42 and 45 is directed towards these blue polyhedra which explain the less potent nature of these molecules. The appearance of red polyhedra in the vicinity of chlorine atom attached to the ortho and meta position of compounds 31 and 32 indicates that substitution with groups, carrying high electron density, is favorable at this position. This explains the higher affinity of 31 and 32 compared to 27 and 28 lacking the halogen substituents (Ki D2 = 56.8 nM and 243 nM for 31 and 27, respectively; Ki D2 = 44.2 nM and 1979 nM for 32 and 28, respectively). A blue polyhedron around indole-containing compound 14 indicates that this nitrogen should be more electropositive for better binding affinity at the D2 receptor.
The hydrophobic, HDon and HAcc contours of D2 CoMSIA model are displayed in Figure 6a. Yellow (the contribution level 80%) and white (the contribution level 20%) contours indicate the region where hydrophobic and hydrophilic groups, respectively, are preferred. There are three hydrophilic regions in this contour map: First, large white contour near the N-propyl group of the aminotetraline head group, which indicates that a hydrophobic group is disfavored at this position. It is a well-appreciated fact in the dopamine receptor ligands area that one of the N-substituents of a potent dopamine receptor agonist fits into a small pocket known as ‘propyl cleft’.7 Another white polyhedron is located around the piperazine ring suggesting that hydrophobic groups will decrease the activity. Third white polyhedron is observed away from the quinoline moiety of the most active compounds which is in consonance with the steric contour map. As seen in Figure 6a, the quinoline group of 4 is surrounded by a yellow contour. These results demonstrate that a hydrophobic function in this region will increase activity which is consistent with CoMFA steric contour map. The HDon-favored and disfavored regions are represented by cyan (contribution level 80%) and purple (contribution level 20%) contours, respectively. The presence of two cyan contours are near the 5- and 7-positions of the aminotetraline head group indicate that HDon functionality in this region will enhance the binding affinity.
Figure 6.

Hydrophobic (contribution level of 85% and 15%; favored and disfavored respectively for both D2 and D3), HDon (contribution level of 60% and 15%; and 70% and 15% favored and disfavored for D2 and D3 respectively) and HAcc (contribution level of 80% and 20%; favored and disfavored respectively for both D2 and D3) contour maps from the CoMSIA model using a) atom-based alignment and AM1 charges for D2 affinity and b) flexible alignment and Gasteiger-Hückel charges for D3 affinity. Compound 4 is shown inside the fields.
The HDon moieties, the hydroxyl and amino groups of the aminotetraline and thiazolidium head groups may be involved in H-bonding with the receptor amino acid residues. These results are in accordance with the similar results obtained by other authors.9,12,20,21 One cyan contour near the N of the n-propyl group of aminotetraline indicates that HDon functionality in this region will enhance the binding affinity to D2 receptor. The cyan contour map surrounding the piperazine nitrogen signifies the position of nitrogen atom as donor group present in this class of dopaminergic compounds. It is likely that these nitrogens will exist as protonated species at physiological pH and thus, may serve as HDon and/or cationic center.
CoMSIA HAcc favored and disfavored fields are shown in magenta (contribution level 80%) and red (contribution level 20%) respectively. The large red contour around the 5 position of aminotetraline indicates that any substituent containing an acceptor group will reduce the activity which is in agreement with HDon feature at this region of molecules. On the other hand a red polyhedron is seen around the carbonyl oxygen attached to the piperazine ring in compounds 12, 13, 14, 41, 41 and 45. This indicates that acceptor group is disfavored at this position and is validated by the presence of carbonyl group in compounds 12, 13, 14, 41, 41 and 45 which resulted in the reduced binding affinity for the D2 receptor. The magenta contours around the nitrogen of quinoline and indole moiety of the compounds 15, 16 and 19 suggest that this nitrogen can act as an acceptor and should be electropositive for better binding affinity.
2.4.2 Dopamine D3 receptor binding affinity
The steric and electrostatic contour plots are shown in Figure 5b. Compound 4 is shown for reference. As seen from Figure 5b, a large sterically favorable green contour is observed around the 7- and 8-positions of the aminotetrlaine head group, suggesting the requirement of bulk near these positions for higher D3 affinity. Sterically unfavorable yellow contours are observed near the N-propyl group of aminotetraline and near the pendant ring of the conformationally rigid analogs 5 as observed for D2 affinity. Significant number of red contours is observed around the molecules. The red contour seen near the piperazine nitrogen reveals that nitrogen may act as a HAcc to interact with the D3 receptor. A red polyhedron is observed around the nitrogen of the molecules having an indole moiety attached to the piperazine ring in compounds 12, 13 and 41 which indicates the involvement of indole N in H-bonding with the receptor.
The hydrophobic, HDon and HAcc contour maps of CoMSIA model based on flexible alignment and Gasteiger-Huckel charges are displayed in Figure 6b and are generally in accordance with the field distribution pattern seen for D2 affinity. In the CoMSIA contour maps for D3 affinity, there is a cyan contour map surrounding the piperazine nitrogen implying that donor group is favorable at this location for better activity. However, an acceptor favorable magenta contour on the same nitrogen signifies that the groups with the dual donor and acceptor properties are favorable at this position. A magenta polyhedron is seen around the oxygen of the carbonyl group attached to the piperazine ring in molecules 12, 13, 14, 41, 42 and 45. This indicates that an acceptor group is favored at this position and the position of carbonyl group in these compounds resulted in the higher binding affinity towards the D3 receptor which is in contrast to the corresponding D2 contour maps. These contour maps may explain the higher D3 selectivity of the carbonyl-containing compounds. The magenta contour map near the oxygen of hydroxyl group containing compounds 15, 16, 19 and on 8 position of quinoline moiety signifies that an acceptor group is favored at this position. The yellow contour on the phenyl and white hydrophobic contour on the cyclohexyl ring of aminotetraline indicate that the hydrophobic and hydrophilic groups, respectively, are favored for higher D3 affinity. A white contour near the N-propyl group of the aminotetraline and yellow contours around the quinoline ring of 15, 16 and 19 is complementary to the D2 CoMSIA contour maps (Figure 6a). A large white contour is located around the quinoline moiety suggesting that hydrophobic group will reduce the binding affinity towards D3 receptor.
2.4.3 Selectivity for D3 over D2
The steric and electrostatic contour plots obtained from the CoMFA analysis based on flexible alignment and AM1 charges are shown in Figure 7a, and are generally in accordance with the field distribution pattern seen for D2 CoMFA. Compound 42 has been shown for reference. A large blue and small red contour observed near the nitrogen and the hydroxyl group of the thiazolidium and aminotetraline head groups, respectively, suggests the dominating role of more positive charge and HDon over more negative charge and HAcc in determining D3 selectivity. A blue polyhedron around the piperazine nitrogen suggests that this nitrogen can be protonated at physiological pH and act as donor in this region of receptor. The red polyhedron around the N-propyl group signifies the role of electronegative atom in this area which cannot be explained from the current set of molecules.
Figure 7.

a) Steric (contribution level of 80% and 20%; favored and disfavored, respectively) and electrostatic CoMFA (contribution level of 85% and 15%; favored and disfavored respectively) contour maps using atom-based alignment and AM1 charges and b) hydrophobic (contribution level of 90% and 15%; favored and disfavored respectively), HDon (contribution level of 75% and 15%; favored and disfavored respectively and HAcc (contribution level of 80% and 20%; favored and disfavored respectively) CoMSIA contour maps using flexible alignment and Gasteiger-Hückel charges. Compound 42 is shown inside the fields.
A large green contour around the head group in the molecules as shown in Figure 7a substantiates the significance of steric bulk in this region. Selectivity for D3 receptor will increase further with increasing steric bulk in this region of the molecules. Two green polyhedra exist surrounding the n-propyl group indicating that the steric bulk is favored for selectivity in these areas. Compound 5, which is a rigid analog, lacking N-propyl group, is less selective (D2/D3 4.8) compared to 4 (D2/D3 31.5). A large green contour is observed around the tail region of the molecules which entails the significance of steric bulk for D3 selectivity in the molecules. Compounds with biphenyl ring like compound 33 are more selective (D2/D3 253) compared to compound 27 (D2/D3= 58.6) which is in accordance with other findings. The yellow polyhedron near to the indole moiety of 42 indicates that substitution with bulkier group will decrease selectivity for D3 receptor. This may be the reason why compound 18 is more selective compared to 19.
The hydrophobic, HDon and HAcc contour maps of the CoMSIA models based on atom based alignment and AM1 charges are displayed in Figure 7b, and are generally in accordance with the contour plots observed from D2 CoMSIA with minor modification in contribution level (hydrophobic favored with contribution level 90%, HDon favored and disfavored with the contribution levels 75% and 15%, respectively). The presence of a cyan contour around position 7 of the head group (-OH group) indicates HDon group is favorable at this position for better selectivity. However, development of purple and magenta contour on the 5 position of hydroxyl group around the head group signify that group with HAcc are favorable at this position which is complementary to the CoMFA electrostatic contour maps. This entails the necessity of dual natured group at this position. The magenta polyhedron directed towards the carbonyl group of indole-containing highly D3 selective compounds 41, 42 and 45 implies the significance of acceptor group at this location of the molecules. Carbonyl group might be playing a very critical role in the selectivity for D3 receptor which is in agreement with other findings.20 Red contour is oriented towards the N of quinoline moiety of 15, 16 and 19 which indicates that the N should be electropositive for better selectivity towards D3 receptor. The cyan contour maps, similar to the D2 and D3 CoMSIA contour maps, oriented toward the nitrogen of N-(n-propyl) group indicates that N may be acting as a HDon. A purple contour map located between the N-(n-propyl) and piperazine N indicates that HDon groups are disfavored at this location. Two big yellow contours around the distal part of the molecules imply the significance of hydrophobic features for selectivity towards D3 receptor. The emergence of yellow contours over the linker, between N-(n-propyl) and the piperazine N, suggested that substitution with hydrophobic bulky group at this position is favorable for better selectivity. White contour overlapping one of the N of the piperazine ring suggests that hydrophobic group at this position will reduce the selectivity for D3 receptor.
3. Experimental
3.1 Hardware and Software
All the molecular modeling studies including CoMFA and CoMSIA reported herein were performed on a Hewlett-Packard xw4300 computer workstation with main memory of 2 GB and Intel® Pentium® 4 CPU of 3.4 GHz under the operating system Linux Red Hat 5. The molecular modeling software packages – a) Sybyl 8.0 from Tripos Inc.22 and b) Molecular Operating Environment (MOE) 2011.10 from Chemical Computing Group, Inc.23 were employed for the present work.
3.2 Biological Data
The 3D QSAR studies were performed on a set of 45 chemically diverse, hybrid D2/D3 agonists belonging to aminothiazole, aminotetraline and conformationally-rigid analogs reported in our earlier publications (Table 1).6–7, 24–32 The binding affinity for dopamine D2 and D3 receptors was determined by competitive radioligand-binding assays. The same general protocol was used to determine the inhibition constants for displacing [3H]-spiroperidol binding to the cloned D2L and D3 receptors expressed in HEK cells. The IC50 values were converted into Ki with Cheng-Prusoff equation. These compounds covered a wide range of biological activity and spanned over 3.25 and 2.45 log units for D2 and D3 activities, respectively. The negative logarithm (pKi) of respective equilibrium constants (Ki) for D2 and D3 receptors were used as dependent variable for 3D QSAR studies. For selectivity analysis (D2/D3), the differences between pKi for each compound at D2 and D3 were used as dependent variable in the model generation process.33–34
In order to validate the QSAR models, the compounds were divided into training and test sets containing 37 and 8 compounds, respectively. Since the experimental activity varied significantly, different training and test sets were built for three cases. The compounds were rationally divided into training and test sets by considering the fact that the test set molecules cover range of biological activity similar to the training set. Further, CoMFA-based hierarchical clustering using molecular steric and electrostatic fields as parameters was also applied for the selection of the test set molecules. Thus, both the biological activity and the structural features were used to validate the generated models. The structures and the biological activities of the molecules used in this study along with their selectivity are shown in Table 1.
3.3 CoMFA Analyses
All the compounds in the present study were built using fragments in the Sybyl’s library. Each structure was fully geometry-optimized using Tripos force field35 with a distance-dependent dielectric function until a root mean square (rms) deviation of 0.001 kcal/mol Å was achieved. Partial atomic charges required for electrostatic interaction were computed by Gasteiger Hückel and AM1 method. The conformational search for the most active compound at D2/D3 receptors, 4, was performed using systemic search approach. The rotatable bonds were searched from 0 to 359° in 10° increments. The conformations within ± 10 kcal/mol from the lowest energy conformation were chosen for further analysis. The minimum energy conformations thus obtained were further used in the subsequent analysis. Further, based on the structural diversity the whole database was divided into three subsets: a) molecules containing aminotetraline as the head group (Ar1= A, B, C, compounds 5 and 6) (Table 1) b) aminothiazolidium compounds, (Ar1= D) (Table 1) and c) compounds possessing aminothiazolidium as head group and an amide bond at the piperazine nitrogen atom, distal to the agonist head group (compounds 12–14, and 41–45) (Table 1). Next, the most active compound from each subset (compounds 33 and 42 from subsets b and c, respectively) were built on the minimum energy conformation of 4 and their geometry was optimized using same protocol. Compound 33 was selected from the subset b due to its highest affinity and selectivity for D3 receptor. Thereafter, the generated conformations of compounds 33 and 42 were used as a template to construct the remaining molecules of their respective subsets, followed by geometry optimization. For the selectivity analysis, 42, the most selective compound of the series (Table 1) was used as a template to align the whole database.
3.3.1 Alignment
Structural alignment is considered as one of the most critical steps in the generation of 3D QSAR models. However, in contrast to CoMFA, CoMSIA is less sensitive to the changes in relative orientation of the aligned molecules in the lattice.36 In our present work, the ligand alignments were achieved by two different methods.
Atom-based alignment: For D2 and D3 affinity model, atoms indicated by asterisk (*) in the template molecule 4, shown in Table 1, were selected for rms fitting onto the corresponding atoms of the remaining molecules in the subset a. Next, the corresponding atoms of the representative compounds 33 and 42 from subsets b and c were similarly aligned over the selected atoms of the template molecule 4. Similarly, 33 and 42 were used to align the remaining molecules of their respective subsets b and c. Subsequently, for D2/D3 selectivity model similar alignment protocol was followed using compound 42 as the template.
For flexible alignment, the energy minimized conformations of all molecules were imported in TriposMol2 (.mol2) format in MOE 2011.1023 and stored in a molecular database. This database was used as an input in the Flexible Alignment functionality in MOE. It is an application in MOE for flexibly aligning small molecules by maximizing steric and other features, like shape, refractivity, hydrogen bond donor acceptor, and donor overlap while minimizing internal ligand strain. The most active compound, 4, was used as a template to align the whole database described above. Compound 42 was used as template to align the whole database for selectivity analysis (D2/D3). In the present study, Flexible Alignment panel was used with following settings: alignment mode -flexible, iterations - 1000, failure limit - 50, energy cutoff - 15 and configuration limit - 1000. Other parameters in the Flexible Alignment panel were kept at their default values.
CoMFA steric and electrostatic interaction fields were calculated at each lattice interaction points of a regularly spaced grid of 2.0 Å. A sp3 carbon atom with Van der Waals radius of 1.52 Å and +1.0 charges was used as a probe to calculate the steric and electrostatic fields. Values of both the fields were truncated at +30 kcal/mol. The electrostatic fields were ignored at the lattice points with maximal steric interactions. In the end, the results from both the steric and electrostatic field sampling along with biological activity (pKi) of the molecules were put into a spread sheet, and partial least square (PLS) was applied to get the final results.
Another 3D QSAR method, CoMSIA, an extension of the CoMFA methodology, was also applied. Compared to CoMFA, CoMSIA is thought to be less affected by changes in the molecular alignment since it uses Gaussian-type distance-dependent function which provides smoother and easily interpretable contour maps.36 Furthermore, in addition to the steric and electrostatic fields, CoMSIA includes hydrophobic and hydrogen bond interaction fields as well. Further methodological details of the CoMFA and CoMSIA may be referred somewhere else.36
3.3.2 Partial Least Square (PLS) Analyses
In order to generate 3D QSAR models, PLS analysis was used to correlate the binding affinity and selectivity at D2/D3 receptors with CoMFA and CoMSIA descriptors. The analyses were performed following the standard implementation in SYBYL 8.0. The statistical significance of the generated 3D QSAR models was assessed using leave-one-out (LOO procedure). Optimal number of components was determined by selecting the smallest spress value and the last added component was considered if it increases the r2 cv by more than 5% according to the parsimony principle. In order to speed up the analysis and reduce noise, minimum standard deviation threshold was set at 2.0kcal/mol. The r2 cv, spress, r2conv, SE and Fratio were computed as defined in SYBYL 8.0.22
3.3.3 Predictive r2 value
The predictive r2 was computed for the test set molecules and was regarded as
where SD is sum of square deviation between biological activities and the mean observed activity of the test set molecules and PRESS is sum of squared deviation between the observed and predicated activates of the test set molecule. Like r2 cv, predictive r2 can assume a negative value reflecting a complete lack of predictive ability of the training set for the molecules included in the test set.37 When Pr2=0, it indicates that the results are not by chance and are significant.
4. Conclusions
The 3D QSAR CoMFA and CoMSIA studies on a series of in-house generated, structurally diverse set of dopamine D2 and D3 ligands is presented. Two alignment methods, viz., flexible and atom-based alignment and two charge calculation methods, namely, AM1 and Gastëiger-Hückel were used to build D2 and D3 binding (affinity) and selectivity (D2/D3) models. Statistically significant and predictive models explained the binding affinities and selectivity of dual D2 and D3 agonists/partial agonists as well as selective D2/D3 ligands at the dopamine receptors. The flexible alignment produced CoMFA models with significant statistics and readily interpretable contour maps for D2- and D3-binding affinities and selectivity at the D3 (D2/D3) receptor. The results showed good correlation between the steric and electrostatic fields and the binding potencies at the D2, D3 receptors and selectivity at D3 (D2/D3), with a dominate contribution made by steric field over the electrostatic counterpart (for D3 and D2/D3) or vice versa (for D2). The best CoMSIA model was obtained for the selectivity (D2/D3) analysis with atom-based alignment. The resultant model showed excellent predictive capabilities and provided insights into a challenging task of developing D3 preferring ligands over D2. The model revealed the importance of a carbonyl group, which might be involved in potential H-bonding interactions with the D3 target residues, and a biphenyl substituent as important determinants for the D3 selectivity of our dataset compounds. In the absence of a target crystal structure in complex with a D2/D3 agonist, the present ligand-based QSAR study could be utilized to improve the affinity at D2, D3 and selectivity at the D3 receptor.
Supplementary Material
Acknowledgments
This work is supported by National Institute of Neurological Disorders and Stroke/National Institute of Health (NS047198, AKD). PSK thanks Ms. Sona Warrier for her help during preparation of this manuscript.
Footnotes
Supplementary Information. Additional statistics of few more 3D QSAR models and molecular alignment figures are provided.
6. Bibliographic References and Notes
- 1.Emilien G, Maloteaux JM, Geurts M, Hoogenberg K, Cragg S. Pharmacol Ther. 1999;84:133–156. doi: 10.1016/s0163-7258(99)00029-7. [DOI] [PubMed] [Google Scholar]
- 2.Missale C, Nash SR, Robinson SW, Jaber M, Caron MG. Physiol Rev. 1998;78:189–225. doi: 10.1152/physrev.1998.78.1.189. [DOI] [PubMed] [Google Scholar]
- 3.d’Ischia M, Prota G. Pigment Cell Res. 1997;10:370–376. doi: 10.1111/j.1600-0749.1997.tb00694.x. [DOI] [PubMed] [Google Scholar]
- 4.Sokoloff P, Giros B, Martres MP, Andrieux M, Besancon R, Pilon C, Bouthenet ML, Souil E, Schwartz JC. Arzneimittelforschung. 1992;42:224–230. [PubMed] [Google Scholar]
- 5.Giros B, Martres MP, Sokoloff P, Schwartz JC. C R Acad Sci III. 1990;311:501–508. [PubMed] [Google Scholar]
- 6.Dutta AK, Venkataraman SK, Fei XS, Kolhatkar R, Zhang S, Reith ME. Bioorg Med Chem. 2004;12:4361–4373. doi: 10.1016/j.bmc.2004.06.019. [DOI] [PubMed] [Google Scholar]
- 7.Brown DA, Kharkar PS, Parrington I, Reith ME, Dutta AK. J Med Chem. 2008;51:7806–7819. doi: 10.1021/jm8008629. [DOI] [PMC free article] [PubMed] [Google Scholar]
- 8.Banala AK, Levy BA, Khatri SS, Furman CA, Roof RA, Mishra Y, Griffin SA, Sibley DR, Luedtke RR, Newman AH. J Med Chem. 2011;54:3581–3594. doi: 10.1021/jm200288r. [DOI] [PMC free article] [PubMed] [Google Scholar]
- 9.Boeckler F, Gmeiner P. Pharmacol Ther. 2006;112:281–333. doi: 10.1016/j.pharmthera.2006.04.007. [DOI] [PubMed] [Google Scholar]
- 10.Boeckler F, Ohnmacht U, Lehmann T, Utz W, Hubner H, Gmeiner P. J Med Chem. 2005;48:2493–2508. doi: 10.1021/jm049269+. [DOI] [PubMed] [Google Scholar]
- 11.Ehrlich K, Gotz A, Bollinger S, Tschammer N, Bettinetti L, Harterich S, Hubner H, Lanig H, Gmeiner P. J Med Chem. 2009;52:4923–4935. doi: 10.1021/jm900690y. [DOI] [PubMed] [Google Scholar]
- 12.Elsner J, Boeckler F, Heinemann FW, Hubner H, Gmeiner P. J Med Chem. 2005;48:5771–5779. doi: 10.1021/jm0503805. [DOI] [PubMed] [Google Scholar]
- 13.a) Chien EY, Liu W, Zhao Q, Katritch V, Han GW, Hanson MA, Shi L, Newman AH, Javitch JA, Cherezov V, Stevens RC. Science. 2010;330:1091–1095. doi: 10.1126/science.1197410. [DOI] [PMC free article] [PubMed] [Google Scholar]; b) Gil-Mast S, Kortagere S, Kota K, Kuzhikandathil EV. ACS Chem Neurosci. 2013;4:940–951. doi: 10.1021/cn3002202. [DOI] [PMC free article] [PubMed] [Google Scholar]
- 14.Grundt P, Carlson EE, Cao J, Bennett CJ, McElveen E, Taylor M, Luedtke RR, Newman AH. J Med Chem. 2005;48:839–848. doi: 10.1021/jm049465g. [DOI] [PubMed] [Google Scholar]
- 15.Newman AH, Beuming T, Banala AK, Donthamsetti P, Pongetti K, LaBounty A, Levy B, Cao J, Michino M, Luedtke RR, Javitch JA, Shi L. J Med Chem. 2012;55:6689–6699. doi: 10.1021/jm300482h. [DOI] [PMC free article] [PubMed] [Google Scholar]
- 16.Varady J, Wu X, Fang X, Min J, Hu Z, Levant B, Wang S. J Med Chem. 2003;46:4377–4392. doi: 10.1021/jm030085p. [DOI] [PubMed] [Google Scholar]
- 17.Zhao Y, Lu X, Yang CY, Huang Z, Fu W, Hou T, Zhang J. J Chem Inf Model. 2010;50:1633–1643. doi: 10.1021/ci1002119. [DOI] [PubMed] [Google Scholar]
- 18.Dixit A, Kashaw SK, Gaur S, Saxena AK. Bioorg Med Chem. 2004;12:3591–3598. doi: 10.1016/j.bmc.2004.04.016. [DOI] [PubMed] [Google Scholar]
- 19.Kharkar PS, Reith MEA, Dutta AK. J Comput Aided Mol Des. 2008;22:1–17. doi: 10.1007/s10822-007-9146-7. [DOI] [PubMed] [Google Scholar]
- 20.Kortagere S, Cheng SY, Antonio T, Zhen J, Reith ME, Dutta AK. Biochem Pharmacol. 2011;81:157–163. doi: 10.1016/j.bcp.2010.08.026. [DOI] [PMC free article] [PubMed] [Google Scholar]
- 21.Sartania N, Strange PG. J Neurochem. 1999;72:2621–2624. doi: 10.1046/j.1471-4159.1999.0722621.x. [DOI] [PubMed] [Google Scholar]
- 22.SYBYL Molecular Modeling System, Version 8.0. Tripos Inc; St. Louis, MO: pp. 63144–2913. [Google Scholar]
- 23.Molecular Operating Environment (MOE) 2011.10. Chemical Computing Group, Inc; 1010 Sherbrooke Street W, Suite 910, Montreal, Quebec H3A 2R7, Canada: [Google Scholar]
- 24.Biswas S, Hazeldine S, Ghosh B, Parrington I, Kuzhikandathil E, Reith ME, Dutta AK. J Med Chem. 2008;51:3005–3019. doi: 10.1021/jm701524h. [DOI] [PubMed] [Google Scholar]
- 25.Biswas S, Zhang S, Fernandez F, Ghosh B, Zhen J, Kuzhikandathil E, Reith ME, Dutta AK. J Med Chem. 2008;51:101–117. doi: 10.1021/jm070860r. [DOI] [PubMed] [Google Scholar]
- 26.Brown DA, Mishra M, Zhang S, Biswas S, Parrington I, Antonio T, Reith ME, Dutta AK. Bioorg Med Chem. 2009;17:3923–3933. doi: 10.1016/j.bmc.2009.04.031. [DOI] [PMC free article] [PubMed] [Google Scholar]
- 27.Ghosh B, Antonio T, Gopishetty B, Reith M, Dutta A. Bioorg Med Chem. 2010;18:5661–5674. doi: 10.1016/j.bmc.2010.06.025. [DOI] [PMC free article] [PubMed] [Google Scholar]
- 28.Ghosh B, Antonio T, Reith ME, Dutta AK. J Med Chem. 2010;53:2114–2125. doi: 10.1021/jm901618d. [DOI] [PMC free article] [PubMed] [Google Scholar]
- 29.Ghosh B, Antonio T, Zhen J, Kharkar P, Reith ME, Dutta AK. J Med Chem. 2010;53:1023–1037. doi: 10.1021/jm901184n. [DOI] [PMC free article] [PubMed] [Google Scholar]
- 30.Gogoi S, Antonio T, Rajagopalan S, Reith ME, Andersen J, Dutta AK. ChemMedChem. 2011;6:991–995. doi: 10.1002/cmdc.201100140. [DOI] [PMC free article] [PubMed] [Google Scholar]
- 31.Johnson M, Antonio T, Reith ME, Dutta AK. J Med Chem. 2012;55:5826–5840. doi: 10.1021/jm300268s. [DOI] [PMC free article] [PubMed] [Google Scholar]
- 32.Kortagere S, Cheng SY, Antonio T, Zhen J, Reith ME, Dutta AK. Biochem Pharmacol. 2011;81:157–163. doi: 10.1016/j.bcp.2010.08.026. [DOI] [PMC free article] [PubMed] [Google Scholar]
- 33.Bohm M, Strzebecher J, Klebe G. J Med Chem. 1999;42:458–477. doi: 10.1021/jm981062r. [DOI] [PubMed] [Google Scholar]
- 34.Wong G, Koehler KF, Skolnick P, Gu ZQ, Ananthan S, Schonholzer P, Hunkeler W, Zhang W, Cook JM. J Med Chem. 1993;36:1820–1830. doi: 10.1021/jm00065a004. [DOI] [PubMed] [Google Scholar]
- 35.Clark M, Cramer RD., III Vab Opdenbosh N. 1989;10:982–1012. [Google Scholar]
- 36.Kharkar PS, Desai B, Gaveria H, Varu B, Loriya R, Naliapara Y, Shah A, Kulkarni VM. J Med Chem. 2002;45:4858–4867. doi: 10.1021/jm020217z. [DOI] [PubMed] [Google Scholar]
- 37.Cramer RD, Patterson DE, Bunce JD. J Am Chem Soc. 1988;110:5959–5967. doi: 10.1021/ja00226a005. [DOI] [PubMed] [Google Scholar]
Associated Data
This section collects any data citations, data availability statements, or supplementary materials included in this article.