

Abstract
In epidemiologic studies, high arsenic exposure has been associated with adverse kidney disease outcomes. We performed a systematic review of the epidemiologic evidence of the association between arsenic and various kidney disease outcomes. The search period was January 1966 through January 2014. Twenty-five papers (comprising 24 studies) meeting the search criteria were identified and included in this review. In most studies, arsenic exposure was assessed by measurement of urine concentrations or with an ecological indicator. There was a generally positive association between arsenic and albuminuria and proteinuria outcomes. There was mixed evidence of an association between arsenic exposure and chronic kidney disease (CKD), β-2 microglobulin (β2MG), and N-acetyl-β-D-glucosaminidase (NAG) outcomes. There was evidence of a positive association between arsenic exposure and kidney disease mortality. Assessment of a small number of studies with three or more categories showed a clear dose-response association between arsenic and prevalent albuminuria and proteinuria, but not with CKD outcomes. Eight studies lacked adjustment for possible confounders, and two had small study populations. The evaluation of the causality of the association between arsenic exposure and kidney disease outcomes is limited by the small number of studies, lack of study quality, and limited prospective evidence. Because of the high prevalence of arsenic exposure worldwide, there is a need for additional well-designed epidemiologic and mechanistic studies of arsenic and kidney disease outcomes.
Keywords: Arsenic, Kidney disease, Kidney, Proteinuria, Systematic review
Introduction
Inorganic arsenic exposure remains a major global public health problem [1–3 4, 5]. In general populations, arsenic exposure occurs mainly through drinking water and food [1–3]. In occupational populations, arsenic exposure generally occurs through inhalation. In the United States, the current water arsenic limit is set at 10 μg/L, yet millions of Americans are exposed to water levels above that limit [6]. Many more people in Bangladesh, China, India, and other countries are exposed to arsenic levels that are substantially greater than 10 μg/L [7].
Inorganic arsenic exposure has been linked to various adverse health outcomes, including cancer [8], cardiovascular disease [7, 9], diabetes [10, 11], respiratory outcomes [4], and neurodevelopmental and reproductive abnormalities [12]. Recent epidemiologic studies also suggest that arsenic is associated with chronic kidney disease (CKD) [13••, 14, 15•]. CKD, defined as reduced glomerular filtration rate, increased urine albumin excretion, or both, remains a major public health problem worldwide [16]. The prevalence of CKD, estimated at around 8–16 % worldwide, is increasing rapidly [16]. At its last stage (end stage renal disease [ESRD]), management of CKD requires renal replacement therapy; ESRD is a severe condition associated with significant mortality, morbidity and healthcare costs [17]. Moreover, CKD is a major risk factor for cardiovascular disease, which remains the leading cause of mortality worldwide [18–22]. Major risk factors for CKD include diabetes, hypertension [23] and obesity [24]. Environmental exposures, such as cadmium and lead, also play an important role in the development of CKD [16]. Identification of preventable CKD risk factors could contribute to reducing the incidence of CKD worldwide.
To evaluate the potential relationship between arsenic and CKD, we conducted a systematic review of epidemiologic studies that have investigated the association between inorganic arsenic exposure, assessed via geographical measures (e.g., living in a high exposure area), environmental markers (e.g., arsenic in drinking water) or biomarkers (e.g., urine arsenic), and CKD endpoints. In addition to glomerular filtration rate (GFR), urine protein excretion (albuminuria or proteinuria) [25] and CKD mortality, we also considered studies measuring other markers of kidney damage in urine, including β-2-microglobulin (β2MG), N-acetyl-β-D-glucosaminidase (NAG) [26], α-1-microglobulin (A1M) [27] and retinol binding protein (RBP) [28].
Methods
Search Strategy and Data Abstraction
We searched the PubMed (http://www.ncbi.nlm.nih.gov/pubmed) database to find published observational studies that evaluated the relationship between arsenic exposure and CKD status or kidney function markers (Fig. 1). We used free text as well as Medical Subject Heading (MeSH) terms “arsenic,” “arsenicals,” “arsenates,” or “arsenic poisoning” and “renal insufficiency, chronic,” “kidney failure, chronic,” “renal dialysis,” “proteinuria,” “albuminuria,” “glomerular filtration rate,” “albumins/urine,” or “proteins/urine.” The search period was January 1966 through January 2014 with no language restrictions. Three papers were found using a hand search [29–31].
Fig. 1.
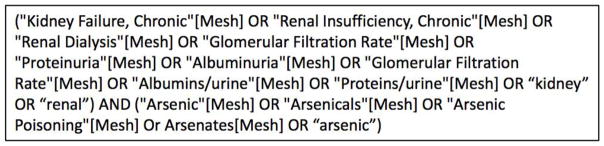
Search query entered into PubMed
Two investigators (LZ and CCK) reviewed each paper identified through the search and applied the study selection criteria. Epidemiologic studies with individual-level data on arsenic exposure and kidney disease outcomes and ecological studies with community-level data were included. We excluded reviews, non-original reports, animal and experimental studies, case series and case reports, and studies without arsenic exposure or kidney disease outcomes. We also excluded one study due to matching of cases and controls on blood pressure levels [32], as blood pressure may be in the causal pathway between arsenic and kidney disease (Fig. 2). The two investigators independently abstracted the study data, including design, study population (location, age, sex distribution), sample size, arsenic assessment and exposure levels, measured outcomes, study results, and adjustment factors. The studies were classified as studies conducted in populations exposed to high arsenic levels if arsenic levels in drinking water were above 100 μg/L, and to low-moderate arsenic levels if arsenic levels in drinking water were below 100 μg/L. For studies with multiple levels of adjustment, we abstracted the measure of association obtained from the model adjusted for the most covariates. We evaluated the quality of studies adapting the criteria developed by Longnecker et al. 1988 [33], as done in previous reviews on arsenic and health outcomes [7, 34, 35]. We checked our criteria against the PRISMA checklist for completeness of findings [36].
Fig. 2.
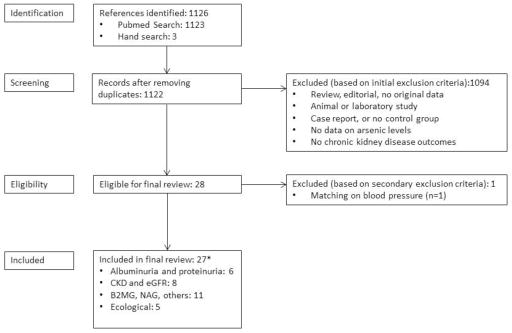
Summary of search and screening process. *Total numbers may not add up since some studies examined multiple outcomes
The authors concluded that the studies were of limited quality and too diverse in outcome measures to allow for meaningful meta-analysis of all studies [37]. Data were abstracted for summary tables. Data from five papers [15, 38–41] reporting associations with albuminuria, proteinuria, and CKD outcomes for three or more arsenic exposure categories were used for dose-response plots and graphical displays. For a study that only provided age and gender adjusted ORs in individuals with and without diabetes separately, we used random-effect meta-analysis to estimate the overall odds ratios in each exposure category [40]. In ecological studies, we pooled sex-stratified standardized mortality ratios (SMRs) to compute the overall SMR and 95 % confidence intervals within each study (Fig. 3) [42]. For descriptive purposes, we also calculated an overall pooled SMR and 95 % confidence intervals. To evaluate heterogeneity, we also estimated the I2 statistic, calculated by the methods of Higgins and Thompson [43]. The I2 statistic measures the proportion of the variation in pooled estimates that is related to heterogeneity. All analyses were performed in Stata 13 (Stata Corporation, www.stata.com) and R 2.16.1 (The R Project, cran-r.org).
Figure 3.
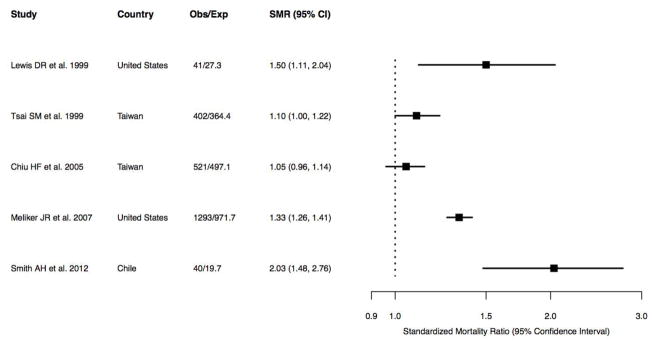
Forest plot of all ecological studies on arsenic and CKD mortality
Results
Study Characteristics
Twenty-five papers consisting of 24 studies (including five ecological studies) published between 1983 and 2013 were identified (Tables 1–4). Twenty-three studies that met the inclusion criteria were published in English, and one paper was published in Chinese. Twenty-two studies were conducted in general populations and two were conducted in occupational populations in China and Poland [44, 45]. There were ten studies in general populations exposed to high arsenic concentrations in drinking water (> 100 μg/L): two from Bangladesh [39, 46], two from China [47–49], four from Taiwan [38, 40, 50, 51], one from Chile [52] and one from Sri Lanka [53]. Two papers [47, 48] were considered together, as both used the same study population and provided complementary information.
Table 1.
Epidemiological studies of arsenic exposure and albuminuria and proteinuria outcomes
| Reference and Country | Population Type, Age, % men | Study Design | N | Outcome Ascertainment | Arsenic Assessment | Exposure Levels | Effect Estimate (95 % CI) | Adjustment Factors |
|---|---|---|---|---|---|---|---|---|
| High arsenic levels in drinking water (> 100 μg/L) | ||||||||
|
Hong et al. 2003 Southern China |
Occupational ≥ 25 years 75.6 % men |
Cross- sectional | 147 (114 workers, 33 unexposed) | Urine albumin, β2MG, NAG levels | Urine (AAS) | Urine As (μg/g) 0–49 50–99 100–199 ≥ 200 |
Urine albumin (mg/g) 6.31 10.23 16.60 19.05 p value < 0.01 |
None |
|
Nordberg et al. 2005 Hong et al. 2004 Guizhou China1* |
Adults NR 59.5 % men |
Cross- sectional | 245 | Albumin>15 mg/g | Urine (GFAA) | Mean (range) urine arsenic (μg/g) High As Area: 288.4 (33.3–1973.9) Control Area: 56.2 (12.4–476.5) |
Mean (range) urine albumin mg/g High As area: 13.1 (2.4–118.3) Control area: 4.5 (0.1–30.8) p value < 0.01 |
Age, sex (matched) |
|
Chen et al. 2011 Araihazar, Bangladesh |
Adults Mean age 37.1 years 43.3 % men |
Cross sectional | 10,956 | Proteinuria via positive dipstick | Urine (GFAA and ICPMS) | Baseline urine As 1–36 μg/L 37–66 67–114 115–205 ≥ 206 |
OR 1.00 (Reference) 1.48 (1.12–1.96) 1.65 (1.25–2.16) 1.53 (1.16–2.02) 1.65 (1.24–2.20) p trend < 0.01 |
Urine creatinine, age, sex, BMI, cigarette smoking, education, SBP, DBP, diabetes |
| Cohort | 10,160 | Proteinuria via positive dipstick | Urine (GFAA and ICPMS) | Baseline urine As (μg/L) 1–36 37–66 67–114 115–205 ≥ 206 |
HR of 1.00 (Reference) 1.00 (0.81–1.22) 0.94 (0.76–1.55) 0.90 (0.72–1.12) 0.88 (0.69–1.08) p trend 0.12 |
Urine creatinine, age, sex, BMI, smoking, education, SBP, DBP, diabetes, change in urine As since last visit | ||
| Low to moderate arsenic levels in drinking water (< 100 μg/L) | ||||||||
|
Kong et al. 2012 Hong Kong, China |
Adolescents Mean age 15.5 years 43.3 % men |
Nested Case- control | 60 cases, 60 control | Urine albumin/creatinine ratio of > 3.5 mg/mmol | Urine (ICPMS) | Median (IQR) of As (μg/L) in cases:2 4.06 (3.28–7.70) In controls: 4.45 (2.70–13.26) |
p value 0.60 | Age, sex (matched on both) |
|
Zheng et al. 2013 AZ, OK, ND, SD United States |
American Indians Mean age 56.2 years 40.9 % men |
Cross sectional | 3,821 | albumin/creatinine ratio of ≥ 30 mg/g | Urine (ICPMS) | Baseline urine As ≤ 5.8 μg/g 5.8–9.7 9.7–15.6 ≥ 15.6 |
Prevalence ratio 1.00 (Reference) 1.16 (1.00–1.34) 1.24 (1.07–1.43) 1.55 (1.35–1.78) p trend < 0.01 |
Age, sex, BMI, smoking, education, SBP, diabetes, study location, alcohol hypertension medication, eGFR |
The Zhejiang population was excluded because it was a coastal area with high seafood consumption
Originally reported as nmol and converted to μg/L
Table 4.
Ecological studies of arsenic and kidney disease mortality
| Reference and Country | Population | Study Design | N | Outcome Ascertainment | Arsenic Assessment | Exposure Levels | SMR (95 % CI) | Adjustment Factors |
|---|---|---|---|---|---|---|---|---|
| High arsenic levels in drinking water (> 100 μg/L) | ||||||||
|
Tsai et al. 1999 Putai, Taiwan |
4 townships (BFD endemic) in two counties to local population of both counties | Ecological | 206 male deaths, 196 female deaths | Nephritis, nephrotic syndrome, nephrosis mortality validated by death certificate using ICD-9 code | Groundwater data from Chen et al. 1962 | Historical content of wells ranged from 0.25 to 1.14 ppm (median 0.78 ppm) (Chen et al. 1962) |
1.10 (1.00–1.22) endemic area vs. local reference |
Age |
|
Chiu et al. 2005 Putai, Taiwan |
4 townships (BFD endemic) Use age-specific and sex-specific mortality rate of entire Taiwan population to standardize SMR |
Ecological | 273 male deaths 248 female deaths (1971–2000) |
Nephritis, nephrosis, nephrotic syndrome mortality validated by death certificate using ICD-9 code | Groundwater data from Chen et al. 1962 | Historical well water median of 0.78 ppm Current supply < 0.01 ppm (Chen et al. 1962) |
1.05 (0.96–1.14) | Age |
|
Smith et al. 2012 Northern Chile |
SMR of Antofagasta region of Chile was standardized by the mortality rate from all of Chile except Region II. Age : 30–49 years | Ecological | 14 male, 14 female deaths (born 1940–1957); 6 male, 6 female deaths (born 1958–1970) | Chronic renal disease mortality validated by the Ministry of Health using ICD-9 codes | Groundwater measured previously in Smith et al. 1998 | Historical mean water arsenic in Antofagasta 870 μg/L Rest of Chile: < 10 μg/L (mean of 14 μg/L in 1984) |
2.03 (1.48–2.76) | Age |
| Low to moderate arsenic levels in drinking water (< 100 μg/L) | ||||||||
|
Lewis et al. 1999 Utah, United States |
Several small towns in Millard County, Utah | Ecological | 27 male deaths, 14 female deaths | Nephritis, nephrosis, nephrotic syndrome mortality validated by death certificate using ICD-9 code | Historical data from Utah State Health Laboratory | Historical (1970s) data suggested a mean of 150 ppb with a range of 53 to 750 ppb. Paper stipulates that this is of individuals with < 200 ppb exposure | 1.50 (1.11–2.04) | Age |
|
Meliker et al. 2007 Michigan, United States |
Comparison of six county area of Michigan vs. rest of Michigan | Ecological | 614 male deaths 679 female deaths |
Kidney disease mortality validated by Vital Records and Health Data Development Section of MDCH using ICD9 code. | Groundwater (MDEQ database) | Population weighted median in rest of Michigan: 1.27 μg/L Study area: 7.58 μg/L |
1.33 (1.26–1.41) | Age |
There were 12 studies in general populations exposed to low-moderate arsenic concentrations in drinking water (<100 μg/L). Two were from South Korea [54, 55] three were from the United States [15, 56, 57], and the rest were from Hong Kong [58], Mexico [27], Taiwan [41], Belgium [59], India [60], Bulgaria [61], and Austria [62]. Arsenic exposure was characterized by measuring arsenic levels in drinking water in one study, in urine in 17 studies, in blood and serum in two studies, and by comparing populations living in high vs. low arsenic areas in five studies. A total of five studies evaluated albuminuria/proteinuria (Table 1), eight studies evaluated CKD outcomes based on estimated Glomerular Filtration Rate (eGFR) or medical history (Table 2), ten studies evaluated β2MG and NAG (Table 3), and five studies evaluated CKD mortality (Table 4) [57].
Table 2.
Epidemiological studies of arsenic exposure and eGFR and CKD-based outcomes
| Reference and Country | Population | Study Design | N | Outcome Ascertainment | Arsenic Assessment | Exposure Levels | Effect Estimate (95 % CI) | Adjustment Factors |
|---|---|---|---|---|---|---|---|---|
| High arsenic levels in drinking water (> 100 μg/L) | ||||||||
|
Chiou et al. 2005 Putai, Taiwan |
Participants>25 y in year 2000 49.8 % men |
Cross- sectional | 28,499 (23,99 with DM, 26,100 without) | CKD and other kidney disease ICD9 codes (585, 586, 250.4, 581.8, 582.8, 583.8) | Well water arsenic (NR) | Water As <0.1 mg/L 0.1–0.29 0.3–0.59, ≥ 0.6 |
OR 1.00 (Reference) 1.06 (0.71–1.59) 0.96 (0.58–1.60) 1.52 (0.99–2.35) |
Age, sex, meta analyzed by diabetes status |
|
Chen et al. 2011 Changhua, Taiwan |
High As area Mean age 25.0 y 46.8 % men |
Cross- sectional | 1,043 | MDRD-eGFR3 <60 ml/min/1.73m2 |
Urine (ICPMS) | Urine As (μg/g) ≤ 35 35–75 75–200 > 200 |
For eGFR<60 1.00 (Reference) 1.11 (0.56–1.80) 0.68 (0.42–1.33) 1.98 (0.95–4.99) |
Age, sex, smoking, diabetes, hypertension, lead, cadmium, nickel, living area, |
|
Hawkesworth et al. 2012 Matlab, Bangladesh |
Mother-child pairs 52.7 % male Mean age mothers 26.7 y |
Cohort (children assessed at 4.5 years) | 1,334 | Child’s eGFR levels Cystatin- C formula4 | Urine Hydride generation atomic absorption | Median (10th, 90th) maternal urine As (μg/l) 80 (24, 383) at 8 weeks of pregnancy |
Mean difference in child’s eGFR −14.2 (−32.2, 3.7) per unit increase in maternal As; |
Age, sex, parental wealth index, height at age 4.5, season of birth |
| 52.7 % male Mean age children for As assessment (18 months) |
Median (10th, 90th) of infant As (μg/l): 34 (12, 154) | Mean difference in child’s eGFR −33.4 (−70.2, 3.34) per unit increase in infant 18-month As |
Age, sex, parental wealth index, height at age 4.5, season of birth | |||||
|
Jayatilake et al. 2013 Sri Lanka |
North-central Sri Lanka. Mean age 43.0 years 41.6 % men |
Case-control | 495 (endemic sub- sample with arsenic measurements) | Unknown CKD defined by persistent albuminuria (ACR ≥ 30 mg/g) | Urine (ICPMS) | Median (range) of urine As μg/g Cases: 26.3(0.4–616.6) Controls: 7.0 (0.2–966.3) |
None | |
| Low to moderate arsenic levels in drinking water (<100 μg/L) | ||||||||
|
Mayer et al. 1993 Austria |
Healthy volunteers and dialysis patients Age: NR 51.3 % men |
Case-control | 84 Dialysis cases 25 Noncases |
Dialysis status | Serum Hydride generation atomic absorption | Median (IQR) of 9.1 (7.1,10.1) μg/L in cases controls: 10.6 (9.6,11.8) μg/L |
None | |
|
Karmaus et al. 2008 Bulgaria |
≥30 years 48.7 % men |
Cross- sectional | 201 baseline 189 follow-up |
Cockcraft- Gault eGFR | Urine (GFAA) | Median (5th, 95th percentile) μg/L 3.10 (0.70, 9.30) in 2003–2004 2.90 (0.80, 8.90) in 2004–2005 |
Mean difference in CG-eGFR (ml/min/1.73m2) per μg/L in As: 0.18 P value > 0.05 |
Age, sex, smoking, diabetes, hypertension, pyelonephritis, kidney stones, creatinine, blood lead, serum selenium, urine cadmium |
|
Hsueh et al. 2009 Taipei, Taiwan |
Hospital-based study Mean age 59.9 years 42.3 % men |
Hospital- based Case- control | 354 (125 cases 229 controls) | MDRD-eGFR <60 ml/min/1.73m2 |
Urine HPLC- Hydride generation atomic absorption | Urine As (μg/g) ≤11.8 11.8 – 20.7 ≥20.7 |
OR 1.00 (Reference) 1.41 (0.62–3.19) 4.34 (1.94–9.69) p trend <0.01 |
Age, sex, smoking, education, diabetes, hypertension ethnicity, coffee analgesic use |
|
Palaneeswari et al. 2013 Chennai, India |
Patients with and without dialysis Ages 40–60 years 60 % men |
Case-control | 100 (50 cases, 50 controls) | End stage renal disease | Blood (ICPMS) | mean (SD) blood As (μg/L) ESRD: 3.20 (0.42) Control: 2.30 (0.00) |
P value < 0.01 | None |
The study also reported the results for eGFR <90 ml/min/1.73m2, however here we report only the findings for eGFR <60 ml/min/1.73m2
Formula from Grubb et al “ Simple cystatin C-based prediction equations for glomerular filtration rate compared with the modification of diet in renal disease prediction equation for adults and the Schwartz and the Counahan-Barratt prediction equations for children.” Clin Chem 2005 51:1420–31
Table 3.
Epidemiological studies of arsenic exposure and β2MG, NAG, RBP, and A1M outcomes5
| Reference and Country | Population | Study Design | N | Outcome Ascertainment | Arsenic Assessment | Exposure Levels | Effect Estimate (95 % CI) | Adjustment Factors |
|---|---|---|---|---|---|---|---|---|
| High arsenic levels in drinking water (> 100 μg/L) | ||||||||
|
Hong et al. 2003 Southern China |
Occupational ≥ 25 years 75.6 % men |
Cross- sectional | 147 (114 workers, 33 unexposed) | Urine albumin, β2MG, NAG levels | Urine (AAS) | Urine As (μg/g) 0–49 50–99 100–199 ≥ 200 |
Urine B2MG (μg/g) 107.2 204.2 309.1 398.1 NAG (U/g) 11.2 21.4 27.5 33.1 p value < 0.01 |
None |
|
Nordberg et al. 2005 Hong et al. 2004 Guizhou China6 |
Adults NR 59.5 % men |
Cross- sectional | 245 | β2M > 0.30mg/g RBP > 0.3 mg/g, NAG > 23U/g |
Urine (GFAA) | High As area mean (range) 288.4 (33.3–1,973.0) μg/g Control Area 56.23 (12.41–476.54) μg/g |
Geometric mean 0.163 for RBP and 0.344 for β2M if UCD > 4.8 μg/g cr and As > 36 but only for women (also, see Buchet et al. 2003) |
Age, sex (matched) |
|
Wang et al. 2009 Xinjiang, China |
General (High water As area of China) 44.3 % men, All subjects > 30 years old |
Cross- sectional | 235 | Urine NAG levels | Urine (ICPMS) | Control areas: Urine As (μg/g), mean(SD) 208.6 (231.6) 16–38 μg/l water Endemic area: 20–272 μg/l water Urine As (μg/g), mean(SD) 270.6 (395.3) |
NAG: Geometric mean in control area: 10.29 Endemic area: 12.18 |
None |
|
Chen et al. 2011 Changhua,Taiwan |
High As area with industrial exposure Mean age 25.0 years 46.8 % men |
Cross- sectional | 1,043 | Renal dysfunction defined by β2MG > 0.154 mg/L | Urine (ICPMS) | Urine As μg/g ≤ 35 35–75 75–200 > 200 |
Renal dysfunction defined by β2MG: 1.00 (Reference) 1.69 (0.94–3.64) 2.11 (1.23–4.98) 2.04 (1.11–4.37) |
Age, sex, smoking, diabetes, hypertension, lead, cadmium, nickel, living area, |
| Low to moderate arsenic levels in drinking water (<100 μg/L) | ||||||||
|
Buchet et al 2003 Belgium7 |
Areas with smelters, Mean age 48.1 years 35.6 % men |
Cross- sectional | 568 | 24-hour urine β2M, NAG, RBP, and albumin | 24-h urine Hydride generation atomic absorption | Most below 25 μg/g | r = 0.16 with RBP (p < 0.05) NS with β2M, NAG, and albumin |
Hypertension, painkillers, blood cadmium*diabetes, diabetes, GGT, blood cadmium*hypertension |
|
Karmaus et al. 2008 Bulgaria |
Adults 48.9 % men ≥ 30 years 48.7 % men |
Cross- sectional | 201 baseline 189 follow-up |
Urine β2MG, | Urine (GFAA) | Median (5th, 95th percentile) 3.10 (0.70, 9.30) μg/L in 2003–2004 2.90 (0.80, 8.90) μg/L in 2004–2005 |
Mean difference in β2MG per unit increase As: 0.001 (p value=NS) | Age, sex, smoking, diabetes, hypertension, pyelonephritis, kidney stones, creatinine, blood lead, serum selenium, urine cadmium |
|
Halatek et al 2009 Poland |
Occupational Mean age 43.5 years 100 % men |
Cross- sectional | 55 39 exposed, 16 unexposed |
Urine β2MG and RBP | Urine (ICPMS) | Mean (SD) urine As in control 19.6 (19.9) μg/l Mean urine As in exposed: 43.3 (54.1) μg/l |
Spearman correlations As vs. RBP 0.43 (p value=0.01) As vs.β2M 0.32 (p value=0.05) Among exposure participants |
None |
|
Huang et al. 2009 South Korea |
Korean adults 93.4 % of participants > 40 years 29.7 % male |
Cross- sectional | 290 | Urine β2MG, NAG | Urine (GFAA) | Overall geometric mean (SD) of 5.70 (2.19) μg/L or 3.95 (1.73) μg/g | Pearson correlation As(μg/L) vs. β2MG 0.004 (p value=NS) As(μg/L)vs. NAG 0.300 (p value<0.05) As (μg /g cr) vs. β2MG 0.06 (p value=NS) As (μg /g cr) vs. NAG 0.09 (p value=NS) |
None |
|
Eom et al. 2011 Chungbuk, South Korea |
Area of high mine density, Age ≥ 20 years 43.6 % men |
Cross- sectional | 815 | Urine NAG concentration levels | Urine Hydride generation AAS | Geometric mean (SD) of 8.47 (1.89) μg/g creatinine Urine As as continuous variable | Correlation between As and NAG Low NAG group without seafood consumption: 0.052 With seafood: −0.171 (p < 0.01) High NAG group, without seafood: 0.293 (p < 0.01), with seafood 0.114. |
None |
|
Robles-Osorio et al. 2012 Central México |
5 communities in Central Mexico Mean age 40.9 years 22.2 % men |
Cross- sectional | 90 (11 had CKD) | Urine A1M levels | Urine Hydride generation AA | Mean (range) of 15.0 (0.56–89.2) μg/g | Mean difference (β) in urine A1M per increase in As is −0.109 (p < 0.01) (other results NS) Medians urine As of CKD cases/noncases: 13.6 and 16.2 μg/g cr (NS) |
Age, BMI, SBP, GFR, uric acid, glucose |
β2MG β-2 microglobulin, NAG N-acetyl-β-D-glucosaminidase, RBP Retinol binding protein, A1M α-1-microglobulin
The Zhejiang population was excluded because it was a coastal area with high seafood consumption
The Chinese cohort was excluded because it was the same cohort as Nordberg et al. 2005
Quality Assessment
All studies, except the five ecological studies evaluating CKD mortality, measured arsenic at the individual level (Tables 5–7). Nearly all studies assessing arsenic exposure at the individual level measured it in urine, except one study [40] that measured it in drinking water and two that measured it in blood and serum [60, 62]. In studies with measured urine arsenic, appropriate adjustments for urine dilution were performed. Outcome definitions for binary outcomes were generally consistent, although one study in Bangladesh [39] defined proteinuria using a dipstick, and one in Hong Kong used a different definition (albumin/creatinine ratio of >3.5 mg/mmol) [58]. Outcome definitions for kidney function (GFR)-based outcomes were generally consistent. Five ecological studies and one study in Taiwan [40] used ICD9 codes to identify CKD status. Four studies used creatinine-based equations to estimate GFR [38, 41, 46, 61]. Two studies used ESRD as determined by dialysis status or ESRD status [60, 62]. Many studies did not adjust for potential confounders such as age, sex, smoking status, diabetes status, hypertension status, and body mass index (BMI). Overall, this systematic review includes studies of both high quality (including adjustment for potential confounders and standardized exposure and outcome assessment) and low quality (including lack of adjustment for potential confounders or use of exposure or outcome metrics that are not standardized).
Table 5.
Quality criteria for the evaluation of design and data analysis in epidemiologic studies of arsenic and albuminuria and proteinuria outcomes
| Criteria | Hong et al. | Nordberg Hong et al. | Chen et al. | Kong et al. | Zheng et al. |
|---|---|---|---|---|---|
| Arsenic exposure assessed at individual level | Yes | Yes | Yes | Yes | Yes |
| Arsenic exposure assessed using a biomarker | Yes | Yes | Yes | Yes | Yes |
| Internal comparison within study participants | Yes | Yes | Yes | Yes | |
| Authors controlled for relevant confounding factors (in addition to age, sex, BMI) | No | No | Yes | Yes | Yes |
| Response rate at least 70 % | NR | NR | Yes | No | No |
| Same exclusion criteria applied to all participants | NR | NR | Yes | NR | Yes |
| Standardized definition of kidney disease/eGFR (if applicable) | No | - | Yes | Yes | Yes |
| Interviewer was blinded with respect to case or exposure status | NR | NR | NR | NR | Yes |
| Data collected in a similar manner for all participants | NR | NR | Yes | NR | Yes |
| Noncases would have been cases if they had developed kidney disease (CC only) | - | - | - | Yes | - |
| Authors controlled for healthy worker survivor effect (Occupational only) | NR | - | - | - | - |
| Same time period over which cases/controls and exposed/unexposed interviewed | - | - | - | NR | Yes |
| Loss to follow-up independent of exposure | - | - | NR | - | - |
Table 7.
Quality criteria for the evaluation of design and data analysis in epidemiologic studies of arsenic and β2MG, NAG, RBP, and A1M outcomes8
| Criteria | Hong et al. | Buchet et al. | Nordberg Hong et al. | Karmaus et al. | Halatek et al. | Huang et al. | Wang et al. | Chen et al. | Eom et al. | Robles-Osorio et al. |
|---|---|---|---|---|---|---|---|---|---|---|
| Arsenic exposure assessed at individual level | Yes | Yes | Yes | Yes | Yes | Yes | Yes | No | Yes | Yes |
| Arsenic exposure assessed using a biomarker | Yes | Yes | Yes | Yes | Yes | Yes | Yes | No | Yes | Yes |
| Internal comparison within study participants | Yes | Yes | Yes | Yes | Yes | Yes | Yes | Yes | Yes | |
| Authors controlled for relevant confounding factors (in addition to age, sex, BMI) | No | No | No | Yes | No | No | No | Yes | No | Yes |
| Response rate at least 70 % | NR | NR | NR | NR | NR | NR | NR | NR | NR | NR |
| Same exclusion criteria applied to all participants | NR | NR | NR | NR | NR | NR | NR | NR | NR | NR |
| Standardized definition of kidney disease/eGFR (if applicable) | No | - | - | Yes | - | - | - | Yes | - | - |
| Interviewer was blinded with respect to case or exposure status | NR | NR | NR | NR | NR | NR | NR | NR | NR | NR |
| Data collected in a similar manner for all participants | NR | NR | NR | NR | NR | NR | NR | Yes | NR | NR |
| Noncases would have been cases if they had developed kidney disease (CC only) | - | - | - | No | - | - | - | - | - | - |
| Authors controlled for healthy worker survivor effect (Occupational only) | NR | - | - | - | No | - | - | - | - | - |
| Same time period over which cases/controls and exposed/unexposed interviewed | - | - | - | NR | - | - | - | - | - | - |
| Loss to follow-up independent of exposure | - | - | - | - | - | - | - | - | - | - |
β2MG β-2 microglobulin, NAG N-acetyl-β-D-glucosaminidase, RBP Retinol binding protein A1M α-1-microglobulin
Arsenic and Albuminuria/Proteinuria
Five studies evaluated the association between urine arsenic concentrations and albuminuria or proteinuria outcomes. Four of the five studies were cross-sectional and found positive and statistically significant associations between arsenic and albuminuria/proteinuria with a clear dose-response relationship across studies (Table 1, Fig. 4) [15, 39, 45, 47, 48]. The only prospective study evaluating the association between arsenic and proteinuria found no association, despite a positive association in a cross-sectional study of the same population [39]. In that study, however, an increase in arsenic concentration in urine over time was associated with increased incident proteinuria [39]. One cross-sectional study, conducted in Hong Kong adolescents, found no association between urine arsenic and presence of albuminuria after adjustment for age and sex [58], although the interpretation of albuminuria as a marker of kidney damage is limited in adolescents due to the occurrence of orthostatic proteinuria [63]. Overall, cross-sectional studies in adults have found a positive association between arsenic and albuminuria and proteinuria outcomes. Prospective evidence of an association between arsenic and albuminuria or proteinuria is limited.
Figure 4.

Evaluation of dose response for arsenic exposure and albuminuria and proteinuria outcomes. Only studies with dose-response data and adjustment for confounders are presented
Arsenic and eGFR/CKD Status
Eight studies evaluated the association between urine arsenic and eGFR or CKD status, but only five adjusted for relevant confounders (age, sex, smoking status, diabetes status, hypertension status, and BMI) [38, 40, 41, 46, 61] (Table 2). Among the studies that adjusted for relevant confounders, one case-control study from Taipei, characterized by low-to-moderate arsenic exposure levels, found a statistically significant positive dose-response relationship between urine arsenic and CKD status assessed based on eGFR [41]. Two studies from high arsenic areas of Taiwan found positive cross-sectional associations between arsenic and CKD status, assessed based on eGFR or ICD-9 codes, although the association was not statistically significant in one study [40], and it was only significant in the highest quartile in the other study [38]. These studies from Taiwan are large population-based studies with adjustment for potential confounders and dose-response data (Fig. 5) and represent the best studies in this group, although all of them are cross-sectional. No association was found between urine arsenic levels and Cockcraft-Gault eGFR in a study from Bulgaria on exposure to low arsenic levels [61]. In a study among children in Bangladesh, urine arsenic concentrations measured in the mother during pregnancy or in the children at 18 months were prospectively associated with lower arsenic cystatin C-based eGFR in children measured a 4.5 year follow-up, although the associations were not statistically significant [46].
Figure 5.

Evaluation of dose response for arsenic exposure and eGFR and CKD-based outcomes. Only studies with dose-response data and adjustment for confounders are presented
Among the studies that did not adjust for confounders, arsenic levels were higher in urine [53] and blood [60] of CKD cases compared to non-cases in studies conducted in Sri Lanka and India, respectively. In a study from Austria, median serum arsenic levels were similar in participants on dialysis compared to healthy non-dialysis participants [62]. In addition to the lack of adjustment for potential confounders, the three studies were small and two of them used serum or blood arsenic, biomarkers that are less commonly used to assess arsenic exposure [64]. Overall, based on direction and strength of the associations, temporality and evidence for a dose-response, the evidence is mixed for an association between arsenic and CKD outcomes at both high and low levels of arsenic exposure.
Arsenic and β2MG, NAG, and RBP Outcomes
Urine arsenic concentrations were positively associated with the biomarkers β-2-microglobulin (β2MG) and N-acetyl-β-D-glucosaminidase (NAG) and retinol binding protein (RBP) in most studies (Table 3, total of ten studies). However, only four studies, conducted in Taiwan, Mexico, Bulgaria and Belgium, adjusted for possible confounders [27, 38, 61]. Among those, only two studies with adjustment for confounders found a significant and positive association between arsenic and high β2MG excretion, one conducted in Taiwan [38] and the other in Belgium, although in this case, the correlation was weak (r=0.16) [59]. In a small study in Mexico (N=90), the association between urine arsenic and α-1-microglobulin (A1M, a similar compound to β2MG) was inverse, and in the study from Bulgaria, urine arsenic concentrations were not associated with β2MG [61]. Three studies that did not adjust for potential confounders and conducted in China and Poland [44, 45, 47, 48] found some evidence for a positive association between arsenic and β2MG. For other studies with NAG outcomes, two studies from China and South Korea found a positive association with urine arsenic [45, 54]. Another study from South Korea found no association between NAG and arsenic after adjusting for urine creatinine [55]. Two studies from Poland and China found a positive association between urine arsenic and RBP levels [44, 45, 47]. Overall, the evidence of an association between arsenic and β2MG, NAG, and RBP is mixed. However, many studies of β2MG, NAG, and RBP measures were of poor quality, with inadequate sample sizes and not adjusting for important covariates, including age and sex.
Ecological Studies of Kidney Disease Mortality
Five studies evaluated the risk of kidney disease mortality in areas of Taiwan, Chile, and the United States affected by moderate to high arsenic levels in drinking water (Table 4, Table 8). Two studies found a positive standardized mortality rate (SMR) for kidney disease mortality (based on ICD-9 codes) for men and women in high-arsenic areas of Taiwan compared to the general population [50, 51]. One of them evaluated the trends over time, and found that the SMR decreased after the implementation of low-arsenic drinking water sources in arsenic endemic areas [51]. In Chile, adults with childhood or in-utero exposure to high concentrations of arsenic had significantly elevated SMRs for kidney disease compared to the overall population of Chile [52]. The first ecological study from the United States found an elevated SMR from “nephritis and nephrosis” death for men, but not for women in communities with high arsenic exposure in Utah [56]. The second ecological study from the United States found elevated SMRs for kidney disease mortality for both men and women residing in Michigan [57]. We calculated an overall pooled SMR (95 % CI) of 1.29 (1.10, 1.51) for all the countries combined. The I2 was 89.4, indicating that there is considerable heterogeneity across ecological studies. Overall evidence from ecological studies suggests a positive association between living in an area with arsenic exposure and kidney disease mortality, but these data need to be interpreted cautiously due to low-quality in exposure and outcome assessment, lack of adjustment for relevant confounders, and substantial heterogeneity across studies.
Table 8.
Quality criteria for the evaluation of design and data analysis in epidemiologic studies of arsenic and CKD mortality
| Criteria | Lewis et al. | Tsai et al. | Chiu et al. | Meliker et al. | Smith et al. |
|---|---|---|---|---|---|
| Arsenic exposure assessed at individual level | - | - | - | - | - |
| Arsenic exposure assessed using a biomarker | No | No | No | No | No |
| Internal comparison within study participants | No | Yes | No | No | No |
| Authors controlled for relevant confounding factors (in addition to age, sex, BMI) | Yes | Yes | Yes | Yes | Yes |
| Response rate at least 70 % | - | - | - | - | - |
| Same exclusion criteria applied to all participants | - | - | - | - | - |
| Standardized definition of kidney disease (if applicable) | Yes | Yes | Yes | Yes | Yes |
| Interviewer was blinded with respect to case or exposure status | - | - | - | - | - |
| Data collected in a similar manner for all participants | NR | NR | NR | NR | NR |
| Noncases would have been cases if they had developed kidney disease (CC only) | - | - | - | - | - |
| Authors controlled for healthy worker survivor effect (Occupational only) | - | - | - | - | - |
| Same time period over which cases/controls and exposed/unexposed interviewed | - | - | - | - | - |
| Loss to follow-up independent of exposure | - | - | - | - | - |
Discussion
This systematic review identified multiple human studies that evaluated the role of arsenic in kidney disease. This review found a positive cross-sectional association between arsenic and albuminuria/proteinuria, and a positive association with kidney disease mortality in ecological studies. These associations were observed both in areas characterized by drinking water with high (>100 μg/L) as well as low-moderate (<100 μg/L) arsenic levels. For the association of arsenic with CKD (defined by eGFR or medical record ICD9 code) and with markers of kidney damage (β2MG, NAG, RBP, and A1M levels), the evidence was inconsistent and many studies were small and lacked adjustment for relevant confounders. Overall, the evidence is insufficient to make inferences regarding a causal relationship between arsenic and chronic kidney disease due to the small sample size, cross-sectional design, and lack of adjustment for relevant confounders. The limited number of prospective studies that have evaluated the association between arsenic and kidney outcomes is a major limitation that needs to be addressed.
Experimental evidence, although limited, generally supports the association between arsenic and the development of CKD. In vivo, mice exposed to arsenic develop glomerular sclerosis, tubular necrosis, and increases in urine NAG concentrations [65]. Mice exposed to arsenic also experienced increased oxidative stress and DNA oxidative damage in kidney tissue [66]. Dogs fed with sodium arsenate also developed glomerular sclerosis and tubular necrosis [67]. In vitro studies suggest that arsenic increases inflammation [68, 69] and oxidative stress [70, 71], and induces endothelial dysfunction [72, 73]. Although somewhat unspecific mechanisms, inflammation and oxidative stress could play a role in arsenic-related kidney damage [74]. Overall, the limited number of in vitro studies with human cells is a major limitation of mechanistic evidence available.
Three high-quality epidemiological studies (relatively large studies with standardized exposure and outcome measures and adjustment for possible confounders) of the association of arsenic, measured in urine and water, with CKD, measured by eGFR, and with β2MG in high [38, 40] and low [41] water arsenic areas of Taiwan suggest a positive dose-response relationship between arsenic and CKD. In the United States, a large population-based study in American Indian communities found a positive association between arsenic exposure, as measured in urine, and prevalent albuminuria after adjustment for CKD risk factors [15], although the study was cross-sectional and the temporality of the association is unclear. Finally, a population-based study in Bangladesh also found a positive association between arsenic and prevalent proteinuria, and between changes in urine arsenic levels and changes in proteinuria levels over time, but not between baseline arsenic and incident proteinuria [39]. These studies provide the best evidence of a possible role of arsenic as a kidney disease risk factor.
Drinking water is the major source of arsenic exposure [5, 64] and arsenic in drinking water remains a worldwide public health problem. Millions of individuals around the world are exposed to high concentrations of arsenic in drinking water [4]. Naturally occurring high levels of drinking water arsenic are common in Bangladesh, Taiwan, China, Chile and other countries. In the United States, 13 million people remain exposed to arsenic at levels greater than the U.S. Environmental Protection Agency’s standard of 10 μg/L [6]. In addition to water, other sources or arsenic relevant for general populations include certain foods, such as rice, flour, and juice [75, 76]. Occupational sources of arsenic, such as copper smelting or pesticide use, have decreased in recent years, especially in developing countries [64].
Chronic Kidney Disease (CKD) has become an increasing global public health problem [16]. The incidence and prevalence of kidney disease, however, differ substantially across countries, and the prevalence of end stage kidney disease is expected to increase in China, India and many other countries. Within countries, certain population groups are at increased risk of developing CKD [16], especially those affected by hypertension, diabetes mellitus, and obesity [16, 77]. The prevalence of these risk factors is also increasing in most parts of the world [16]. Environmental causes of kidney disease including metals such as lead, cadmium, and mercury, as well as occupational solvents, certain herbal preparations, and various infectious agents [78] are also likely to play a role, alone and in conjunction with traditional risk factors. Because environmental exposures are preventable, the identification of relevant risk factors can contribute to the prevention and control of the CKD epidemic.
This systematic review revealed limitations in the epidemiologic literature on arsenic and kidney disease outcomes, such as the dearth of prospective studies, poor quality in outcome assessment, relatively small study populations and a lack of adjustment for confounders. Arsenic exposure was measured at the individual-level in many studies, although some studies have used ecological assessments. As millions of people around the world are exposed to arsenic from drinking water and food, the global prevalence of chronic kidney disease is increasing. Arsenic is a well-established carcinogen and it has been causally associated with cardiovascular disease [35, 79] and potentially also to diabetes, nonmalignant respiratory disease, pregnancy outcomes, neurodevelopmental toxicity, and immune effects. Understanding the kidney effects of arsenic, through high-quality research, would contribute to a more comprehensive characterization of the spectrum of conditions that are related to arsenic exposure.
Conclusion
This systematic review found some evidence in support of the association between arsenic and kidney disease outcomes, especially for albuminuria and proteinuria, and CKD mortality. For the association between arsenic and CKD (based on e-GFR or medical records), β2MG, NAG, and RBP levels, the evidence was mixed. These associations were found in studies conducted in populations exposed to high arsenic levels in drinking water, but were also evident in some populations exposed to low-to-moderate arsenic exposure levels. Interventions to reduce arsenic may be able to decrease CKD burden. High quality prospective studies are needed to further characterize the role of arsenic as a CKD risk factor.
Table 6.
Quality criteria for the evaluation of design and data analysis in epidemiologic studies of arsenic and eGFR and CKD-based outcomes
| Criteria | Mayer et al. | Chiou et al. | Karmaus et al. | Hsueh et al. | Chen et al. | Hawkesworth et al. | Jayatilake et al. | Palaneeswari et al. |
|---|---|---|---|---|---|---|---|---|
| Arsenic exposure assessed at individual level | Yes | No | Yes | Yes | No | Yes | Yes | Yes |
| Arsenic exposure assessed using a biomarker | Yes | No | Yes | Yes | No | Yes | Yes | Yes |
| Internal comparison within study participants | Yes | Yes | Yes | Yes | Yes | Yes | Yes | Yes |
| Authors controlled for relevant confounding factors (in addition to age, sex, BMI) | No | Yes | Yes | Yes | Yes | Yes | No | No |
| Response rate at least 70 % | NR | NR | NR | NR | NR | No | Yes | NR |
| Same exclusion criteria applied to all participants | NR | NR | NR | NR | NR | NR | NR | NR |
| Standardized definition of kidney disease/eGFR (if applicable) | Yes | Yes | Yes | Yes | Yes | Yes | Yes | Yes |
| Interviewer was blinded with respect to case or exposure status | NR | NR | NR | NR | NR | - | NR | NR |
| Data collected in a similar manner for all participants | NR | NR | NR | NR | Yes | NR | Yes | NR |
| Noncases would have been cases if they had developed kidney disease (CC only) | - | - | No | Yes | - | - | Endemic only | NR |
| Authors controlled for healthy worker survivor effect (Occupational only) | - | - | - | - | - | - | - | - |
| Same time period over which cases/controls and exposed/unexposed interviewed | - | - | NR | Yes | - | - | Yes | NR |
| Loss to follow-up independent of exposure | - | - | - | - | - | NR | - | - |
Acknowledgments
This systematic review was supported by grants from the National Heart, Lung and Blood Institute (R01HL090863) and the National Institute of Environmental Health Sciences (R01ES021367 and P30ES03819). Ms. Zheng was supported by a training grant from the National Institute of Environmental Health Sciences (T32ES103650) and the NIOSH Education and Research Center for Occupational Safety and Health (T42OH008428).
Footnotes
Compliance with Ethics Guidelines
Conflict of Interest
Laura Zheng, Chin-Chi Kuo, Jeffrey Fadrowski, Jackie Agnew, Virginia M. Weaver, and Ana Navas-Acien declare that they have no conflict of interest.
Human and Animal Rights and Informed Consent
This article does not contain any studies with human or animal subjects performed by any of the authors.
References
Papers of particular interest, published recently, have been highlighted as:
• Of importance
•• Of major importance
- 1.Hughes MF. Arsenic toxicity and potential mechanisms of action. Toxicol Lett. 2002;133:1–16. doi: 10.1016/s0378-4274(02)00084-x. [DOI] [PubMed] [Google Scholar]
- 2.Nordstrom DK. Public health. Worldwide occurrences of arsenic in ground water. Science. 2002;296:2143–5. doi: 10.1126/science.1072375. [DOI] [PubMed] [Google Scholar]
- 3.Smith AH, Steinmaus CM. Arsenic in drinking water. BMJ. 2011;342:d2248. doi: 10.1136/bmj.d2248. [DOI] [PubMed] [Google Scholar]
- 4.Naujokas MF, Anderson B, Ahsan H, et al. The broad scope of health effects from chronic arsenic exposure: update on a worldwide public health problem. Environ Health Perspect. 2013;121:295–302. doi: 10.1289/ehp.1205875. [DOI] [PMC free article] [PubMed] [Google Scholar]
- 5.Smedley PL, Kinniburgh DG. A review of the source, behaviour and distribution of arsenic in natural waters. Appl Geochem. 2002;17:517–68. [Google Scholar]
- 6.Arsenic: Environmental Chemistry, Health Threats, and Waste Treatment. West Sussex, UK: John Wiley & Sons, Ltd; 2009. [Google Scholar]
- 7.Navas-Acien A, Sharrett AR, Silbergeld EK, et al. Arsenic exposure and cardiovascular disease: a systematic review of the epidemiologic evidence. Am J Epidemiol. 2005;162:1037–49. doi: 10.1093/aje/kwi330. [DOI] [PubMed] [Google Scholar]
- 8.International Agency for Research on C. IARC Monographs on the Evaluation of Carcinogenic Risks to Humans. 2004. [Google Scholar]
- 9.Moon KGE, Umans JG, Devereux RB, Best L, Francesconi KA, Goessler W, Pollak J, Silbergeld EK, Howard BV, Navas-Acien A. Low to moderate arsenic exposure and incident cardiovascular disease: the Strong Heart Study. 2013. Under Review. [Google Scholar]
- 10.Kuo CC, Moon K, Thayer KA, Navas-Acien A. Environmental chemicals and type 2 diabetes: an updated systematic review of the epidemiologic evidence. Curr Diabetes Rep. 2013;13:831–49. doi: 10.1007/s11892-013-0432-6. [DOI] [PMC free article] [PubMed] [Google Scholar]
- 11.Maull EA, Ahsan H, Edwards J, et al. Evaluation of the Association between Arsenic and Diabetes: A National Toxicology Program Workshop Review. Environ Health Perspect. 2012;120:1658–70. doi: 10.1289/ehp.1104579. [DOI] [PMC free article] [PubMed] [Google Scholar]
- 12.Sohel N, Vahter M, Ali M, et al. Spatial patterns of fetal loss and infant death in an arsenic-affected area in Bangladesh. Int J Health Geogr. 2010;9:53. doi: 10.1186/1476-072X-9-53. [DOI] [PMC free article] [PubMed] [Google Scholar]
- 13••.Chen Y, Parvez F, Liu M, et al. Association between arsenic exposure from drinking water and proteinuria: results from the Health Effects of Arsenic Longitudinal Study. Int J Epidemiol. 2011:828–35. doi: 10.1093/ije/dyr022. This large prospective cohort study from a high arsenic area of Bangladesh looked at urine arsenic and proteinuria features both as a cross-sectional as well as a longitudinal component. This study found a positive association between urine arsenic and baseline proteinuria, as well as change in urine arsenic and incident proteinuria. It did not find an association between baseline urine arsenic and incident proteinuria. [DOI] [PMC free article] [PubMed] [Google Scholar]
- 14.Hsueh YM, Chung CJ, Shiue HS, et al. Urinary arsenic species and CKD in a Taiwanese population: a case-control study. Am J Kidney Dis. 2009;54:859–70. doi: 10.1053/j.ajkd.2009.06.016. [DOI] [PubMed] [Google Scholar]
- 15•.Zheng LY, Umans JG, Tellez-Plaza M, et al. Urine arsenic and prevalent albuminuria: evidence from a population-based study. Am J Kidney Dis. 2013;61:385–94. doi: 10.1053/j.ajkd.2012.09.011. This population-based study of American Indians in low-moderate arsenic areas looked at the association between baseline urine arsenic and albuminuria. It found a positive dose-response association between urine arsenic and albuminuria, even after adjustment for potential confounders. [DOI] [PMC free article] [PubMed] [Google Scholar]
- 16.Jha V, Garcia-Garcia G, Iseki K, et al. Chronic kidney disease: global dimension and perspectives. Lancet. 2013;382:260–72. doi: 10.1016/S0140-6736(13)60687-X. [DOI] [PubMed] [Google Scholar]
- 17.System USRD; Health NIo, editor. USRDS 2013 Annual Data Report: Atlas of Chronic Kidney Disease and End-Stage Renal Disease in the United States. Bethesda, MD: National Institute of Diabetes and Digestive and Kidney Diseases; 2013. [Google Scholar]
- 18.Astor BC, Levey AS, Stevens LA, Van LF, Selvin E, Coresh J. Method of glomerular filtration rate estimation affects prediction of mortality risk. J Am Soc Nephrol. 2009;20:2214–22. doi: 10.1681/ASN.2008090980. [DOI] [PMC free article] [PubMed] [Google Scholar]
- 19.Hillege HL, Fidler V, Diercks GF, et al. Urinary albumin excretion predicts cardiovascular and noncardiovascular mortality in general population. Circulation. 2002;106:1777–82. doi: 10.1161/01.cir.0000031732.78052.81. [DOI] [PubMed] [Google Scholar]
- 20.Manjunath G, Tighiouart H, Coresh J, et al. Level of kidney function as a risk factor for cardiovascular outcomes in the elderly. Kidney Int. 2003;63:1121–9. doi: 10.1046/j.1523-1755.2003.00838.x. [DOI] [PubMed] [Google Scholar]
- 21.Manjunath G, Tighiouart H, Ibrahim H, et al. Level of kidney function as a risk factor for atherosclerotic cardiovascular outcomes in the community. J Am Coll Cardiol. 2003;41:47–55. doi: 10.1016/s0735-1097(02)02663-3. [DOI] [PubMed] [Google Scholar]
- 22.O’Hare AM, Bertenthal D, Covinsky KE, et al. Mortality risk stratification in chronic kidney disease: one size for all ages? J Am Soc Nephrol. 2006;17:846–53. doi: 10.1681/ASN.2005090986. [DOI] [PubMed] [Google Scholar]
- 23.Levey AS, Atkins R, Coresh J, et al. Chronic kidney disease as a global public health problem: approaches and initiatives—a position statement from Kidney Disease Improving Global Outcomes. Kidney Int. 2007;72:247–59. doi: 10.1038/sj.ki.5002343. [DOI] [PubMed] [Google Scholar]
- 24.Ferris M, Hogan SL, Chin H, et al. Obesity, albuminuria, and urinalysis findings in US young adults from the Add Health Wave III study. Clin J Am Soc Nephrol. 2007;2:1207–14. doi: 10.2215/CJN.00540107. [DOI] [PubMed] [Google Scholar]
- 25.K/DOQI clinical practice guidelines for chronic kidney disease: evaluation, classification, and stratification. Am J Kidney Dis. 2002;39:S1–266. [PubMed] [Google Scholar]
- 26.Jung K, Pergande M, Graubaum HJ, Fels LM, Endl U, Stolte H. Urinary proteins and enzymes as early indicators of renal dysfunction in chronic exposure to cadmium. Clin Chem. 1993;39:757–65. [PubMed] [Google Scholar]
- 27.Robles-Osorio ML, Perez-Maldonado IN, Martin del Campo D, et al. Urinary arsenic levels and risk of renal injury in a cross-sectional study in open population. Revista de investigacion clinica; organo del Hospital de Enfermedades de la Nutricion. 2012;64:609–14. [PubMed] [Google Scholar]
- 28.Clinical Nephrotoxins: Renal Injury from Drugs and Chemicals. 2. Dordrecht: Kluwer Academic Publishers; 2003. [Google Scholar]
- 29.Li Z, Piao F, Liu S, et al. Preventive effects of taurine and vitamin C on renal DNA damage of mice exposed to arsenic. J Occup Health. 2009;51:169–72. doi: 10.1539/joh.l8038. [DOI] [PubMed] [Google Scholar]
- 30.Nordberg G, Jin T, Wu X, et al. Kidney dysfunction and cadmium exposure--factors influencing dose-response relationships. J Trace Elem Med Biol. 2012;26:197–200. doi: 10.1016/j.jtemb.2012.03.007. [DOI] [PubMed] [Google Scholar]
- 31.Sears ME. Chelation: harnessing and enhancing heavy metal detoxification—a review. The Scientific World Journal. 2013;2013:219840. doi: 10.1155/2013/219840. [DOI] [PMC free article] [PubMed] [Google Scholar]
- 32.Feng H, Gao Y, Zhao L, et al. Biomarkers of renal toxicity caused by exposure to arsenic in drinking water. Environ Toxicol Pharmacol. 2013;35:495–501. doi: 10.1016/j.etap.2013.02.010. [DOI] [PubMed] [Google Scholar]
- 33.Longnecker MP, Berlin JA, Orza MJ, Chalmers TC. A meta-analysis of alcohol consumption in relation to risk of breast cancer. JAMA. 1988;260:652–6. [PubMed] [Google Scholar]
- 34.Abhyankar LN, Jones MR, Guallar E, Navas-Acien A. Arsenic exposure and hypertension: a systematic review. Environ Health Perspect. 2012;120:494–500. doi: 10.1289/ehp.1103988. [DOI] [PMC free article] [PubMed] [Google Scholar]
- 35.Moon K, Guallar E, Navas-Acien A. Arsenic exposure and cardiovascular disease:an updated systematic review. Curr Atherosclerosis Rep. 2012;14:542–55. doi: 10.1007/s11883-012-0280-x. [DOI] [PMC free article] [PubMed] [Google Scholar]
- 36.Moher D, Liberati A, Tetzlaff J, Altman DG, Group P. Preferred reporting items for systematic reviews and meta-analyses: the PRISMA statement. Int J Surg. 2010;8:336–41. doi: 10.1016/j.ijsu.2010.02.007. [DOI] [PubMed] [Google Scholar]
- 37.Systematic Reviews in Health Care: Meta-Analysis in Context. BMJ Publishing Group; 2001. [Google Scholar]
- 38.Chen JW, Chen HY, Li WF, et al. The association between total urinary arsenic concentration and renal dysfunction in a community-based population from central Taiwan. Chemosphere. 2011;84:17–24. doi: 10.1016/j.chemosphere.2011.02.091. [DOI] [PubMed] [Google Scholar]
- 39.Chen Y, Parvez F, Liu M, et al. Association between arsenic exposure from drinking water and proteinuria: results from the Health Effects of Arsenic Longitudinal Study. Int J Epidemiol. 2011;40:828–35. doi: 10.1093/ije/dyr022. [DOI] [PMC free article] [PubMed] [Google Scholar]
- 40.Chiou JM, Wang SL, Chen CJ, Deng CR, Lin W, Tai TY. Arsenic ingestion and increased microvascular disease risk: observations from the south-western arseniasis-endemic area in Taiwan. Int J Epidemiol. 2005;34:936–43. doi: 10.1093/ije/dyi108. [DOI] [PubMed] [Google Scholar]
- 41.Hsueh YM, Chung CJ, Shiue HS, et al. Urinary arsenic species and CKD in a Taiwanese population: a case-control study. Am J Kidney Dis. 2009;54:859–70. doi: 10.1053/j.ajkd.2009.06.016. [DOI] [PubMed] [Google Scholar]
- 42.Rothman K. Modern Epidemiology. Boston, Ma: Little, Brown; 1986. Stratified analysis. [Google Scholar]
- 43.Higgins JP, Thompson SG, Deeks JJ, Altman DG. Measuring inconsistency in meta-analyses. BMJ. 2003;327:557–60. doi: 10.1136/bmj.327.7414.557. [DOI] [PMC free article] [PubMed] [Google Scholar]
- 44.Halatek T, Sinczuk-Walczak H, Rabieh S, Wasowicz W. Association between occupational exposure to arsenic and neurological, respiratory and renal effects. Toxicol Appl Pharmacol. 2009;239:193–9. doi: 10.1016/j.taap.2009.04.022. [DOI] [PubMed] [Google Scholar]
- 45.Hong F, Jin TY, Lu GD, Yin ZY. Renal dysfunction in workers exposed to arsenic and cadmium. Zhonghua lao dong wei sheng zhi ye bing za zhi = Zhonghua laodong weisheng zhiyebing zazhi = Chinese journal of industrial hygiene and occupational diseases. 2003;21:432–6. [PubMed] [Google Scholar]
- 46.Hawkesworth S, Wagatsuma Y, Kippler M, et al. Early exposure to toxic metals has a limited effect on blood pressure or kidney function in later childhood, rural Bangladesh. Int J Epidemiol. 2013;42:176–85. doi: 10.1093/ije/dys215. [DOI] [PMC free article] [PubMed] [Google Scholar]
- 47.Hong F, Jin T, Zhang A. Risk assessment on renal dysfunction caused by co-exposure to arsenic and cadmium using benchmark dose calculation in a Chinese population. Biometals. 2004;17:573–80. doi: 10.1023/b:biom.0000045741.22924.d8. [DOI] [PubMed] [Google Scholar]
- 48.Nordberg GF, Jin T, Hong F, Zhang A, Buchet JP, Bernard A. Biomarkers of cadmium and arsenic interactions. Toxicol Appl Pharmacol. 2005;206:191–7. doi: 10.1016/j.taap.2004.11.028. [DOI] [PubMed] [Google Scholar]
- 49.Wang JP, Wang SL, Lin Q, Zhang L, Huang D, Ng JC. Association of arsenic and kidney dysfunction in people with diabetes and validation of its effects in rats. Environ Int. 2009;35:507–11. doi: 10.1016/j.envint.2008.07.015. [DOI] [PubMed] [Google Scholar]
- 50.Tsai SM, Wang TN, Ko YC. Mortality for certain diseases in areas with high levels of arsenic in drinking water. Arch Environ Health. 1999;54:186–93. doi: 10.1080/00039899909602258. [DOI] [PubMed] [Google Scholar]
- 51.Chiu HF, Yang CY. Decreasing trend in renal disease mortality after cessation from arsenic exposure in a previous arseniasis-endemic area in southwestern Taiwan. JJ Toxicol Environ Health Part A. 2005;68:319–27. doi: 10.1080/15287390590900804. [DOI] [PubMed] [Google Scholar]
- 52.Smith AH, Marshall G, Liaw J, Yuan Y, Ferreccio C, Steinmaus C. Mortality in young adults following in utero and childhood exposure to arsenic in drinking water. Environ Health Perspect. 2012;120:1527–31. doi: 10.1289/ehp.1104867. [DOI] [PMC free article] [PubMed] [Google Scholar]
- 53.Jayatilake N, Mendis S, Maheepala P, Mehta FR Team CKNRP. Chronic kidney disease of uncertain aetiology: prevalence and causative factors in a developing country. BMC nephrology. 2013;14:180. doi: 10.1186/1471-2369-14-180. [DOI] [PMC free article] [PubMed] [Google Scholar]
- 54.Eom SY, Lee YC, Yim DH, et al. Effects of low-level arsenic exposure on urinary N-acetyl-beta-D-glucosaminidase activity. Hum Exp Toxicol. 2011;30:1885–91. doi: 10.1177/0960327111402239. [DOI] [PubMed] [Google Scholar]
- 55.Huang M, Choi SJ, Kim DW, et al. Risk assessment of low-level cadmium and arsenic on the kidney. J Toxicol Environ Health Part A. 2009;72:1493–8. doi: 10.1080/15287390903213095. [DOI] [PubMed] [Google Scholar]
- 56.Lewis DR, Southwick JW, Ouellet-Hellstrom R, Rench J, Calderon RL. Drinking water arsenic in Utah: A cohort mortality study. Environ Health Perspect. 1999;107:359–65. doi: 10.1289/ehp.99107359. [DOI] [PMC free article] [PubMed] [Google Scholar]
- 57.Meliker JR, Wahl RL, Cameron LL, Nriagu JO. Arsenic in drinking water and cerebrovascular disease, diabetes mellitus, and kidney disease in Michigan: a standardized mortality ratio analysis. Environmental Health. 2007;6:4. doi: 10.1186/1476-069X-6-4. [DOI] [PMC free article] [PubMed] [Google Scholar]
- 58.Kong AP, Xiao K, Choi KC, et al. Associations between microRNA (miR-21, 126, 155 and 221), albuminuria and heavy metals in Hong Kong Chinese adolescents. Clinica Chimica Acta. 2012;413:1053–7. doi: 10.1016/j.cca.2012.02.014. [DOI] [PubMed] [Google Scholar]
- 59.Buchet JP, Heilier JF, Bernard A, et al. Urinary protein excretion in humans exposed to arsenic and cadmium. Int Arch Occup Environ Health. 2003;76:111–20. doi: 10.1007/s00420-002-0402-9. [DOI] [PubMed] [Google Scholar]
- 60.Palaneeswari MS, Rajan PM, Silambanan S, Jothimalar Blood Arsenic and Cadmium Concentrations in End-Stage Renal Disease Patients who were on Maintenance Haemodialysis. J Clin Diagn Res. 2013;7:809–13. doi: 10.7860/JCDR/2013/5351.2945. [DOI] [PMC free article] [PubMed] [Google Scholar]
- 61.Karmaus W, Dimitrov P, Simeonov V, Tsolova S, Bonev A, Georgieva R. Metals and kidney markers in adult offspring of endemic nephropathy patients and controls: a two-year follow-up study. Environ Health. 2008;7:11. doi: 10.1186/1476-069X-7-11. [DOI] [PMC free article] [PubMed] [Google Scholar]
- 62.Mayer DR, Kosmus W, Pogglitsch H, Mayer D, Beyer W. Essential trace elements in humans. Serum arsenic concentrations in hemodialysis patients in comparison to healthy controls. Biol Trace Elem Res. 1993;37:27–38. doi: 10.1007/BF02789399. [DOI] [PubMed] [Google Scholar]
- 63.Brandt JR, Jacobs A, Raissy HH, et al. Orthostatic proteinuria and the spectrum of diurnal variability of urinary protein excretion in healthy children. Pediatr Nephrol. 2010;25:1131–7. doi: 10.1007/s00467-010-1451-z. [DOI] [PMC free article] [PubMed] [Google Scholar]
- 64.Fowler BA, Chou SJ, Jones RL, Chen CJ. Arsenic. In: Nordberg GF, Fowler BA, Nordberg M, Freiberg LT, et al., editors. Handbook on the Toxicology of Metals. Amsterdam: Elsevier; 2007. pp. 367–443. [Google Scholar]
- 65.Liu J, Liu Y, Habeebu SM, Waalkes MP, Klaassen CD. Chronic combined exposure to cadmium and arsenic exacerbates nephrotoxicity, particularly in metallothionein-I/II null mice. Toxicology. 2000;147:157–66. doi: 10.1016/s0300-483x(00)00194-3. [DOI] [PubMed] [Google Scholar]
- 66.Li Z, Piao F, Liu S, Wang Y, Qu S. Subchronic exposure to arsenic trioxide-induced oxidative DNA damage in kidney tissue of mice. Experimental and toxicologic pathology : official journal of the Gesellschaft fur Toxikologische Pathologie. 2010;62:543–7. doi: 10.1016/j.etp.2009.07.003. [DOI] [PubMed] [Google Scholar]
- 67.Tsukamoto H, Parker HR, Gribble DH, Mariassy A, Peoples SA. Nephrotoxicity of sodium arsenate in dogs. Am J Vet Res. 1983;44:2324–30. [PubMed] [Google Scholar]
- 68.Escudero-Lourdes C, Medeiros MK, Cardenas-Gonzalez MC, Wnek SM, Gandolfi JA. Low level exposure to monomethyl arsonous acid-induced the over-production of inflammation-related cytokines and the activation of cell signals associated with tumor progression in a urothelial cell model. Toxicol Appl Pharmacol. 2010;244:162–73. doi: 10.1016/j.taap.2009.12.029. [DOI] [PMC free article] [PubMed] [Google Scholar]
- 69.Ned RM, Yesupriya A, Imperatore G, et al. Inflammation gene variants and susceptibility to albuminuria in the U.S. population: analysis in the Third National Health and Nutrition Examination Survey (NHANES III), 1991–1994. BMC Med Genet. 2010;11:155. doi: 10.1186/1471-2350-11-155. [DOI] [PMC free article] [PubMed] [Google Scholar]
- 70.Barchowsky A, Dudek EJ, Treadwell MD, Wetterhahn KE. Arsenic induces oxidant stress and NF-kappa B activation in cultured aortic endothelial cells. Free Radic Biol Med. 1996;21:783–90. doi: 10.1016/0891-5849(96)00174-8. [DOI] [PubMed] [Google Scholar]
- 71.Barchowsky A, Klei LR, Dudek EJ, Swartz HM, James PE. Stimulation of reactive oxygen, but not reactive nitrogen species, in vascular endothelial cells exposed to low levels of arsenite. Free Radic Biol Med. 1999;27:1405–12. doi: 10.1016/s0891-5849(99)00186-0. [DOI] [PubMed] [Google Scholar]
- 72.Shai I, Pischon T, Hu FB, Ascherio A, Rifai N, Rimm EB. Soluble intercellular adhesion molecules, soluble vascular cell adhesion molecules, and risk of coronary heart disease. Obesity(SilverSpring) 2006;14:2099–106. doi: 10.1038/oby.2006.245. [DOI] [PubMed] [Google Scholar]
- 73.Wijnstok NJ, Twisk JW, Young IS, et al. Inflammation markers are associated with cardiovascular diseases risk in adolescents: the Young Hearts project 2000. J Adolesc Health. 2010;47:346–51. doi: 10.1016/j.jadohealth.2010.04.008. [DOI] [PMC free article] [PubMed] [Google Scholar]
- 74.Malyszko J, Malyszko JS, Pawlak K, Mysliwiec M. Visfatin and apelin, new adipocytokines, and their relation to endothelial function in patients with chronic renal failure. Adv Med Sci. 2008;53:32–6. doi: 10.2478/v10039-008-0024-x. [DOI] [PubMed] [Google Scholar]
- 75.Gilbert-Diamond D, Cottingham KL, Gruber JF, et al. Rice consumption contributes to arsenic exposure in US women. Proc Natl Acad Sci USA. 2011;108:20656–60. doi: 10.1073/pnas.1109127108. [DOI] [PMC free article] [PubMed] [Google Scholar]
- 76.Jackson BP, Taylor VF, Karagas MR, Punshon T, Cottingham KL. Arsenic, organic foods, and brown rice syrup. Environ Health Perspect. 2012;120:623–6. doi: 10.1289/ehp.1104619. [DOI] [PMC free article] [PubMed] [Google Scholar]
- 77.Meguid El Nahas A, Bello AK. Chronic kidney disease: the global challenge. Lancet. 2005;365:331–40. doi: 10.1016/S0140-6736(05)17789-7. [DOI] [PubMed] [Google Scholar]
- 78.Soderland P, Lovekar S, Weiner DE, Brooks DR, Kaufman JS. Chronic kidney disease associated with environmental toxins and exposures. Adv Chronic Kidney Dis. 2010;17:254–64. doi: 10.1053/j.ackd.2010.03.011. [DOI] [PubMed] [Google Scholar]
- 79.Critical Aspects of EPA’s IRIS Assessment of Inorganic Arsenic: Interim Report. The National Academies Press; 2014. [Google Scholar]