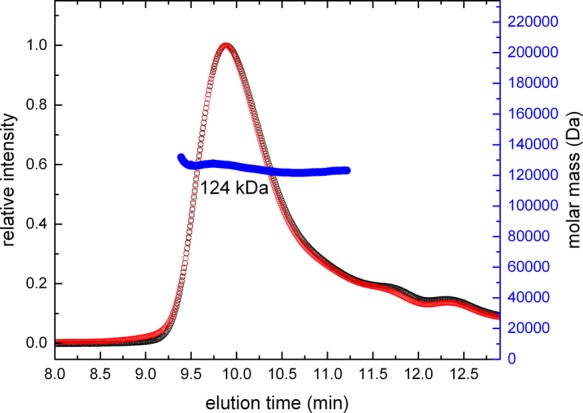
Figure 5.

Determination of the molecular mass of RcPutA using MALS. The red curve represents the light scattering response measured at 90°. The black curve represents the response of the refractive index detector. The blue curve shows the derived molecular mass.
