Abstract
Background
Since 2009, scheduling legislation of synthetic cannabinoids prompted new compound emergence to circumvent legal restrictions. 2-(4-methoxyphenyl)-1-(1-pentyl-indol-3-yl)methanone (RCS-4) is a potent cannabinoid receptor agonist sold in herbal smoking blends. Absence of parent synthetic cannabinoids in urine suggests the importance of metabolite identification for detecting RCS-4 consumption in clinical and forensic investigations.
Materials & methods & Results
With 1 h human hepatocyte incubation and TOF high-resolution MS, we identified 18 RCS-4 metabolites, many not yet reported. Most metabolites were hydroxylated with or without demethylation, carboxylation and dealkylation followed by glucuronidation. One additional sulfated metabolite was also observed. O-demethylation was the most common biotransformation and generated the major metabolite.
Conclusion
For the first time, we present a metabolic scheme of RCS-4 obtained from human hepatocytes, including Phase I and II metabolites. Metabolite structural information and associated high-resolution mass spectra can be employed for developing clinical and forensic laboratory RCS-4 urine screening methods.
Background
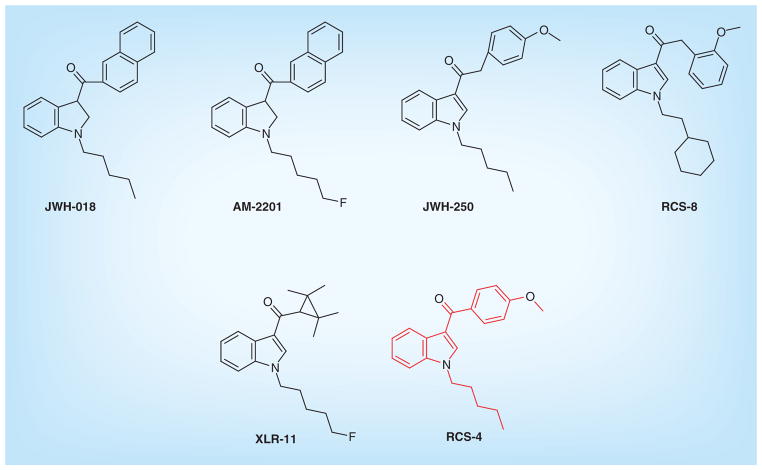
Synthetic cannabinoids are emerging drugs of abuse worldwide. During the 1990s, they were synthesized and studied extensively for their modulation of the endogenous cannabinoid system as a therapeutic tool [1]. However, clandestine drug manufacturers sell synthetic cannabinoids as legal alternatives to cannabis or marijuana [2]. They were first marketed in 2004 under the brand names K2/Spice, sold in head shops, the Internet and gas stations as ‘not for human consumption’ [3]. Based on chemical structure, synthetic cannabinoids were earlier classified into eight chemical classes, such as naphthoylindoles (JWH-018, JWH-073 by John W Huffman, WIN-55,212–2), naphthyl-methylindoles (JWH-175), naphthoylpyrroles (JWH-307), naphthylmethylindenes (JWH-176), phenylacetylindoles (JWH-250, RCS-8), cyclohexylphenols (CP47,497 by Pfizer), benzoylindoles (RCS-4 by Research Chemical Suppliers, AM-694 by Alexandros Makriyannis) and classical synthetic cannabinoid (HU-210 by Hebrew University). However, many new compounds now contain other substructures such as adamantane (AKB-48, STS-135), tetramethylcyclopropyl (UR-144, XLR-11), indole-3-carboxamide (UR-12, Org 28611) or quinolinyl esters (PB-22, 5F-PB-22). Chemical structures of representative compounds are shown in Figure 1.
Figure 1.
Chemical structures of structurally related synthetic cannabinoids.
LC–MS/MS and GC–MS methods were reported for detecting JWH-, AM-, WIN-, RCS-series of synthetic cannabinoids at low concentrations in whole blood, serum, urine, oral fluid and hair [4–11]. However, synthetic cannabinoid parent compounds are seldom present in urine [12–14]. This necessitates characterization of urinary metabolic profiles of synthetic cannabinoids identifying markers of consumption for clinical and forensic urine testing, and for determining analytes that should be synthesized as analytical reference standards. Synthetic cannabinoids are not detected by routine immunoassay-based cannabinoid urine screening methods and are unscheduled when initially marketed prior to legislative efforts. This led to widespread abuse, especially among teenagers, eventually leading to alarmingly high calls to poison control centers [15]. Recent studies with alternative drug testing matrices highlight advantages of hair and oral fluid for documenting synthetic cannabinoid intake [16–24]. Since parent drugs predominate in these matrices, elucidating drug metabolite profiles is not required. However, hair and oral fluid testing have disadvantages as well. Drugs are incorporated into hair follicles and can be detected for weeks or months [25], but initial drug incorporation into hair is delayed and cannot detect recent drug use effectively [25]. Passive contamination from smoked drugs and potential hair color bias can also complicate interpreting hair testing results [16,25], and we do not know minimum detection limits for incorporation into hair. Limited oral fluid specimen volumes and low analyte concentrations complicate oral fluid testing and yield shorter detection windows than for urine [20]. Although urine drug testing requires identifying metabolite targets, drug metabolites initially appear within hours of intake and remain detectable for days or weeks in urine, providing effective drug monitoring for clinical and forensic testing.
In vitro and in vivo studies suggest stronger affinities at cannabinoid CB1 and CB2 receptors for many synthetic cannabinoids compared with the active constituent of cannabis, Δ9-tetrahydrocannabinol (THC) [1,26,27]. In addition, metabolites of JWH-018 and JWH-073 were also shown to have strong binding affinity and potency at human CB1 and CB2 receptors [28–30]. Synthetic cannabinoids are extensively metabolized in humans [5,12]. In vitro studies showed that cytochrome P450 (CYP) oxidation followed by glucuronidation by uridine diphosphate glucuronosyltransferase enzymes is important for metabolizing synthetic cannabinoids [31–33]. Several studies showed the utility of human liver microsomes in elucidating metabolic profiles of synthetic cannabinoids [33–35]. However, simultaneous formation of Phase II metabolites during microsomal studies is difficult to accomplish requiring incubation with the preformed Phase I metabolites and cofactors such as UDPGA (for glucuronidation) and PAPS (for sulfation). Alternatively, human hepatocytes are superior to microsomes for studying drug metabolism, since they contain both Phase I and II enzymes and more realistically mimic the in vivo liver environment.
RCS-4 [2-(4-methoxyphenyl)-1-(1-pentyl-indol-3-yl)methanone] was first reported to the European Center for Drugs and Drug Addiction via the Early Warning System by Hungary in 2010. RCS-4 was introduced in the market in 2010 and was frequently identified in seizures around the world including 2012 [36]. Recent studies also identified RCS-4 along with three other synthetic cannabinoids in seized herbal samples in Belgium [37]. Although, recently, 16 metabolites of RCS-4 were identified in human urine by GC–MS after enzyme hydrolysis, the authors could not directly determine Phase II metabolites (glucuronides) that frequently predominate in human urine after synthetic cannabinoid intake [12–14]. The authors identified hydroxylated metabolites coupled with or without O-demethylation/ oxygenation. Our approach identifies Phase I and II metabolites including glucuronide and sulfate metabolites. We employed liquid chromatography/high-resolution MS (LC–HRMS) and used MetabolitePilot™ software to directly identify Phase I and II metabolites formed during human hepatocyte incubation. HRMS simplifies metabolite elucidation compared with lower resolution MS. We propose that incubation of emerging drugs of abuse with human hepatocytes followed by analysis via LC–HRMS provides rapid and robust information regarding biotransformation pathways and anticipated metabolic products. This information is of particular relevance for clinical and forensic laboratories that have to keep pace with the constantly emerging drugs, which might only be found as metabolites in their analytical screening methods. This study provides HRMS spectra that can be used for detecting RCS-4 metabolites in authentic biological samples in order to prove drug intake.
Materials & methods
Chemicals & reagents
Cryopreserved human hepatocytes, thawing and incubation media were purchased from BioreclamationIVT (MD, USA), and RCS-4 was obtained from Cerilliant (TX, USA). LC–MS grade acetonitrile and water were from Sigma-Aldrich (MO, USA) and Fisher Scientific (NJ, USA), respectively.
Incubation of RCS-4 with human hepatocytes
Cryopreserved human hepatocytes pooled from three donors were thawed in a water bath at 37°C. After processing the hepatocytes as per the manufacturer’s instructions, cell viability was assessed with 0.4% v/v Trypan blue solution. Viability was >80%. RCS-4 (10 μM) was incubated with human hepatocytes (1.3 million cells/ml) in 20 ml glass scintillation vials at 37°C with constant shaking in a humidified incubator. Diclofenac (CYP2C9 substrate) was the positive control to ensure hepatocyte metabolic activity. Samples were removed after 0 and 1 h; the reaction was stopped by protein precipitation with an equal volume of ice-cold acetonitrile immediately upon collection. Samples were stored at −80°C until analysis.
Sample preparation
Samples were centrifuged at 15,000 × g for 5 min at 4°C in a 5804 R centrifuge (Eppendorf, Hamburg, Germany) to remove any cell debris or particulate matter. Supernatant was removed, diluted 2X with mobile phase (A:B 50:50 v/v) and injected onto the LC–MS/MS system.
Chromatographic instrumentation & analysis
Chromatography was performed with a Shimadzu UFL-Cxr system: DGU-20A5R degasser, SIL-20ACXR autosampler, CTO-20 AC column oven and two LC-20ADXR pumps (Shimadzu Corp., MD, USA). An additional LC-10AD HPLC pump delivered initial mobile phase conditions to the source during MS auto-calibration every fifth injection and when column flow was diverted to waste. Analytes were separated via gradient elution at 300 μl/min on a Kinetex™ C18 column (100 × 2.1 mm, 2.6 μm) fitted with a KrudKatcher Ultra in-line filter (0.5 μm × 0.1 mm ID; Phenomenex, CA, USA) with mobile phase consisting of 0.1% formic acid in (A) water and (B) acetonitrile, respectively. Initial gradient 10% B conditions were held for 0.3 min, increased to 20% B at 0.5 min, then ramped to 75% B over 20 min, increased to 95% B at 20.1 min and held for 0.8 min before column re-equilibration at 10% B at 22 min for a total run time of 25 min. Column and autosampler temperatures were maintained at 40 and 4°C, respectively.
MS instrumentation & analysis
Mass spectrometric analysis was performed on a Triple-TOF™ 5600 mass spectrometer (AB Sciex, Redwood City, CA, USA). Data were acquired with Analyst TF v.1.6 (AB Sciex). A DuoSpray ion source was operated in positive electrospray ionization mode to acquire full scan data and information-dependent acquisition (IDA) fragment ion spectra with mass defect filtering (MDF) and dynamic background subtraction. IDA experimental criteria were: inclusion of ions exceeding 500 counts per second (cps), exclusion of isotopes within 3 Da, mass tolerance 50 mDa and mass defect tolerance 40 mDa, respectively. MDF-IDA criteria are shown in Table 1.
Table 1.
Mass defect filter: information-dependent acquisition criteria for detection of Phase I and II RCS-4 metabolites.
| Biotransformation | Formula | Protonated MW (Da) | Width (Da) | Mass defect (mDa) |
|---|---|---|---|---|
| Parent | C21H24NO2 | 322.1802 | 100 | 180.2 |
| Glucuronidation | C27H32NO8 | 498.2122 | 100 | 212.2 |
| GSH conjugation | C31H41N4O8S | 629.2640 | 100 | 264.0 |
| Sulfation | C21H24NO5S | 402.1370 | 100 | 137.0 |
| Demethoxylation | C20H22NO | 292.1696 | 100 | 169.6 |
| Demethylation | C20H22NO2 | 308.1645 | 100 | 164.5 |
| Depentylation | C16H14NO2 | 252.1019 | 100 | 101.9 |
| Depentylation + glucuronidation | C22H22NO8 | 428.1340 | 100 | 134.0 |
GSH: Glutathione; MW: Molecular weight.
We employed MDF-IDA data acquisition that does not use a traditional inclusion/exclusion list of target compounds for metabolite detection. MDF-IDA acquisition experiments employ signal intensity and MDFs as IDA selection criteria. The MDF-IDA acquisition method includes a list of potential biotransformations (depentylation, depentylation + glucuronidation and so on) and MDF windows for each biotransformation as detailed in Table 1. MS/MS spectra were obtained for any TOF-MS masses exceeding 500 cps that were within any biotransformation calculated mass range (±50 Da) and also fell within the corresponding biotransformation’s calculated MDF (±40 mDa). We also re-injected our specimens with a non-MDF-IDA method where MS/MS spectra were acquired for any TOF-MS peak exceeding 500 cps to assure that we did not miss detecting any metabolites not included in our MDF-IDA method biotransformation list. TOF-MS and MS/MS spectra were acquired throughout single injections using MDF-IDA and non-MDF-IDA methods.
TOF mass spectra were acquired scanning a mass range of m/z 100–950 followed by product ion scanning from m/z 60–950 with accumulation times of 0.1 and 0.075 s, respectively. Declustering potential was set at 120 V with an entrance potential of 10 V. Collision energy was set to 40 eV with a collision energy spread of ±10 eV. An automated delivery system infused calibrant every fifth injection to verify mass resolution.
Data analysis
Data were analyzed by AB Sciex MetabolitePilot™ v.1.5 employing peak finding algorithms and data mining tools, such as common product ion and neutral loss filters, MDF, predicted biotransformation and generic peak-finding for identifying potential metabolites in the raw data. Extracted ion peak intensity threshold was set at 1400 cps, MS at 400 cps and MS/MS at 100 cps, respectively. In the case of multiple hits at the same retention time in the unprocessed list of potential metabolites, metabolites that could be attributed to in-source fragmentation or were generated by adduct formation were considered as false positives and were excluded.
Results & discussion
RCS-4 extracted ion chromatogram & mass spectrum
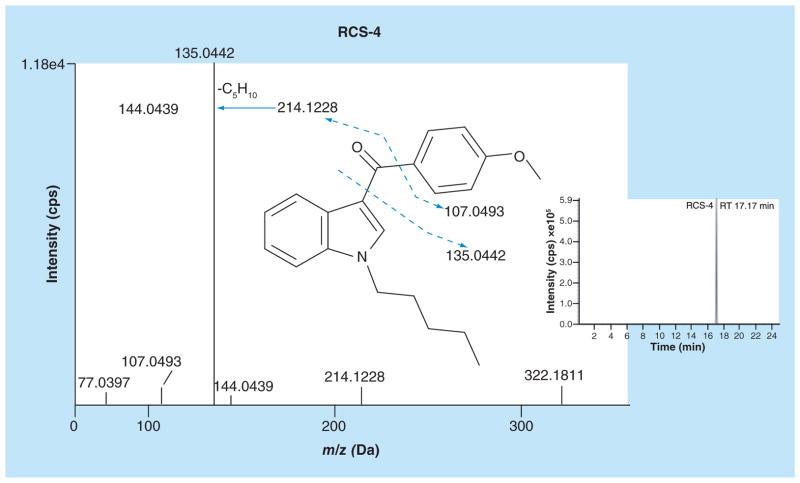
Identification of 4′-hydroxydiclofenac and diclofenac acyl β-D glucuronide metabolites confirmed normal hepatocyte activity. An extracted ion chromatogram (XIC; Figure 2, insert) and fragment ion spectra of RCS-4 after 1 h incubation with human hepatocytes are shown in Figure 2. RCS-4 eluted at 17.17 min in a 25 min run; a slow gradient was needed for metabolite separation. TOF-MS revealed an RCS-4 peak with an m/z 322.1811 protonated molecular ion. RCS-4 fragment ion spectrum contained the methoxyphenyl acylium ion as a base peak at m/z 135.0442. Cleavage of the bond between the carbonyl group and the phenyl ring produced an N-pentylindole acylium ion (m/z 214.1228) and indole acylium ion at m/z 144.0439 (due to loss of N-pentyl chain) (Figure 2). m/z 107.0493 was produced by carbonyl group cleavage from the methoxyphenyl moiety.
Figure 2.
Fragment ion spectra and extracted ion chromatogram of RCS-4 (m/z 322.1810).
Identification & structural characterization of RCS-4 metabolites
We did not observe any metabolite peaks other than the parent compound in our control sample at 0 h. We identified 18 RCS-4 metabolites, including products of aromatic or aliphatic monohydroxylations (M16, M17); monohydroxylation/glucuronidation (M10, M12, M14), dihydroxylation/glucuronidation (M4), carboxylation of the N-pentyl chain (M15), O-demethylation (M18), O-demethylation/monohydroxylation (M9), O-demethylation/glucuronidation (M13), O-demethylation/N-depentylation/glucuronidation (M1), O-demethylation/monohydroxylation/glucuronidation (M3, M5, M6, M11), O-demethylation/ dihydroxylation/glucuronidation (M2), O-demethylation/carboxylation (M8) and O-demethylation/ monohydroxylation/sulfation (M7). Most O-demethylation with or without monohydroxylation/dihydroxylation metabolites were present as glucuronide conjugates.
In general, biotransformations were similar to those found for other structurally related synthetic cannabinoids like JWH-018, JWH-122 or JWH-210 [38]. Hydroxylations were the most common Phase I reactions and occurred at similar positions as observed for other synthetic cannabinoids [33,38]. Demethylation was observed similarly to JWH-250 and dealkylation took place as seen for other synthetic cannabinoids with alkyl side chains [11]. The common Phase II reaction was glucuronidation. Hydroxyl groups or glucuronide moieties for which no definite position could be assigned based on MS analysis alone are attached by dotted lines. All metabolites eluted between 4.11 and 13.84 min. Accurate mass data, elemental composition, characteristic fragment ions, mass error and retention times are listed in Table 2. All metabolite mass errors were less than ±3 ppm.
Table 2.
Accurate mass data, elemental composition, diagnostic fragment ions, mass error, retention times, and MS peak areas of RCS-4 and its metabolites.
| Peak ID | Metabolic reaction | Elemental composition | Protonated molecular ion (m/z) | Diagnostic fragmentions (m/z) | Mass error (ppm) | Retention time (min) | MS area 1 h |
|---|---|---|---|---|---|---|---|
| Parent | C21H23NO2 | 322.1811 | 107.0493, 135.0442, 144.0439, 214.1228 | 2.9 | 17.17 | 1.86 × 10⁶ | |
| M1 | O-demethylation/ depentylation/ glucuronidation | C21H19NO8 | 414.1190 | 93.0349, 121.0282, 144.0444, 238.0865 | 1.5 | 4.11 | 1.79 × 10⁴ |
| M2 | O-demethylation/ dihydroxylation/ glucuronidation | C26H29NO10 | 516.1869 | 137.0229, 186.1278, 204.1374, 340.1547 | 0.8 | 5.27 | 4.95 × 10⁴ |
| M3 | O-demethylation/ monohydroxylation/ glucuronidation | C26H29NO9 | 500.1919 | 121.0281, 130.0653, 186.1274, 204.1380, 250.0859, 324.1596 | 0.8 | 5.51 | 8.82 × 10⁴ |
| M4 | Dihydroxylation/ glucuronidation | C27H31NO10 | 530.2024 | 151.0383, 186.1274, 204.1404, 230.1160, 354.1699 | 0.6 | 5.73 | 1.63 × 10⁴ |
| M5 | O-demethylation/ monohydroxylation/ glucuronidation | C26H29NO9 | 500.1920 | 121.0279, 186.1276, 204.1373, 250.0847, 324.1597 | 1.1 | 5.81 | 2.26 × 10⁴ |
| M6 | O-demethylation/ monohydroxylation/ glucuronidation | C26H29NO9 | 500.1915 | 121.0281, 130.0651, 186.1272, 204.1359, 250.0859, 324.1592 | 0.0 | 6.15 | 1.13 × 10⁴ |
| M7 | O-demethylation/ monohydroxylation/ sulfation | C20H21NO6S | 404.1170 | 121.0278, 186.1273, 200.9848, 204.1384, 250.0868, 324.1608 | 1.8 | 6.58 | 6.89 × 10⁴ |
| M8 | O-demethylation/ carboxylation | C20H19NO4 | 338.1396 | 121.0279, 144.0453, 218.1197, 244.0966 | 2.7 | 7.60 | 3.25 × 10⁴ |
| M9 | O-demethylation/ monohydroxylation | C20H21NO3 | 324.1602 | 121.0285, 153.0770, 186.1266, 250.0848 | 2.3 | 7.66 | 1.43 × 10⁴ |
| M10 | Monohydroxylation/ glucuronidation | C27H31NO9 | 514.2070 | 135.0437, 230.1172, 338.1751 | −0.3 | 8.83 | 6.68 × 10⁴ |
| M11 | O-demethylation/ monohydroxylation/ glucuronidation | C26H29NO9 | 500.1915 | 137.2032, 144.0455, 188.1431, 214.1226, 324.1593 | 0.0 | 9.49 | 4.67 × 10⁴ |
| M12 | Monohydroxylation/ glucuronidation | C27H31NO9 | 514.2069 | 135.0436, 230.1168, 320.1668, 338.1753 | −0.5 | 9.60 | 4.18 × 10⁴ |
| M13 | O-demethylation/ glucuronidation | C26H29NO8 | 484.1961 | 121.0282, 188.1427, 214.1217, 308.1641 | −1.0 | 9.92 | 5.85 × 10⁴ |
| M14 | Monohydroxylation/ glucuronidation | C27H31NO9 | 514.2060 | 144.0342, 151.0384, 214.1221, 338.1745 | −2.3 | 10.02 | 2.19 × 10⁴ |
| M15 | Carboxylation | C21H21NO4 | 352.1547 | 107.0489, 135.0438, 144.0449, 244.0970 | 1.1 | 10.15 | 2.60 × 10⁴ |
| M16 | Monohydroxylation | C21H23NO3 | 338.1754 | 107.0491, 135.0437, 144.0445, 230.1168, 264.1002 | 0.9 | 10.40 | 1.80 × 10⁴ |
| M17 | Monohydroxylation | C21H23NO3 | 338.1753 | 107.0495, 135.0437, 160.0405, 230.1153 | 0.6 | 13.34 | 1.36 × 10⁴ |
| M18 | O-demethylation | C20H21NO2 | 308.1650 | 121.0283, 132.0810, 144.0436, 188.1430, 214.1222 | 1.5 | 13.84 | 1.18 × 10⁵ |
Monohydroxylation with or without glucuronidation
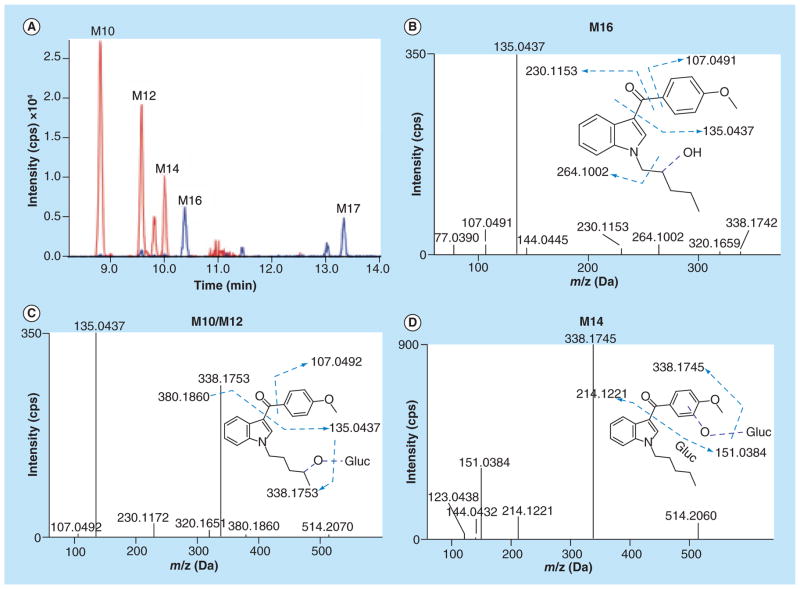
We found two monohydroxylated metabolites (M16 and M17) with a protonated molecular ion at m/z 338.1753. Representative XICs are shown in Figure 3A. Metabolite (M16) fragment ion spectra showed signals for unaltered methoxyphenyl (m/z 135.0437) and indole (m/z 144.0445) moieties (Figure 3B). Presence of m/z 230.1153 indicated monohydroxylation on the N-pentyl chain. The M17 fragment ion spectrum (not shown) was similar to M16, but showed an additional signal at m/z 160.0405 indicating monohydroxylation on the indole ring with unaltered methoxyphenyl ring (m/z 135.0437) (Table 2).
Figure 3. Extracted ion chromatograms and fragment ion spectra of monohydroxylated and monohydroxylated/glucuronidated RCS-4 metabolites.
(A) Extracted ion chromatograms of M10 (514.2070), M12 (514.2069), and M14 (m/z 514.2060), M16 (338.1754) and M17 (m/z 338.1753); (B) fragment ion spectra of monohydroxylated RCS-4 metabolite (M16); (C) fragment ion spectra of monohydroxylated/glucuronidated RCS-4 metabolites (M10/M12); and (D) M14.
Three monohydroxylated/glucuronide conjugates with protonated molecular ions at m/z 514.2070 (M10), 514.2069 (M12) and 514.2060 (M14) also were observed. M10 and M12 had similar spectra including m/z 135.0437 reflecting an unaltered methoxyphenyl moiety, m/z 230.1172 (monohydroxylated N-pentyl chain) and m/z 380.1860 (monohydroxylation/ glucuronidation on the N-pentyl chain) (Figure 3C). The M14 fragment ion spectrum was similar to the M10/M12 spectra containing m/z 144.0432 and m/z 214.1221 indicating unaltered N-pentyl indole structure, m/z 151.0384 indicating monohydroxylation on the methoxyphenyl ring and m/z 338.1753 representing a monohydroxylated aglycone moiety (Figure 3D).
Dihydroxylation with glucuronidation
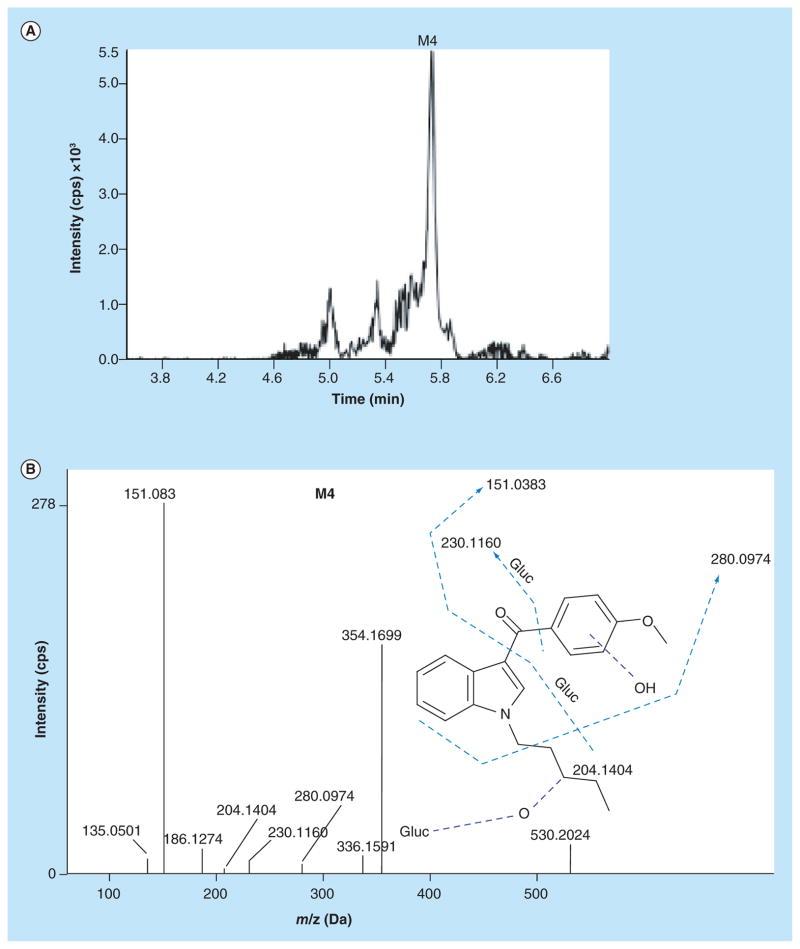
No Phase I dihydroxylated metabolites were observed. Although this contrasts with Kavanagh et al. who found dihydroxylated RCS-4 metabolites in urine specimens at low concentrations [12]; the authors hydrolyzed urine specimens prior to GC–MS analysis as opposed to our methodology where no hydrolysis was involved. We identified one dihydroxylated/glucuronidated RCS-4 metabolite (M4) with protonated molecular ion at m/z 530.2024 (Figure 4A). For M4, the fragment ions spectrum showed monohydroxylations on the methoxyphenyl moiety (m/z 151.0383) and N-pentyl chain (m/z 230.1160), and glucuronidation occurring on one of the hydroxyl groups, respectively (Figure 4B). m/z 354.1699 reflects the dihydroxylated aglycone moiety.
Figure 4. Extracted ion chromatogram and fragment ion spectra of dihydroxylated/glucuronidated RCS-4 metabolite.
(A) Extracted ion chromatogram of M4 (m/z 530.2024); (B) fragment ion spectra of dihydroxylated/ glucuronidated RCS-4 metabolite (M4).
O-demethylation with or without mono- or di-hydroxylation followed by glucuronidation
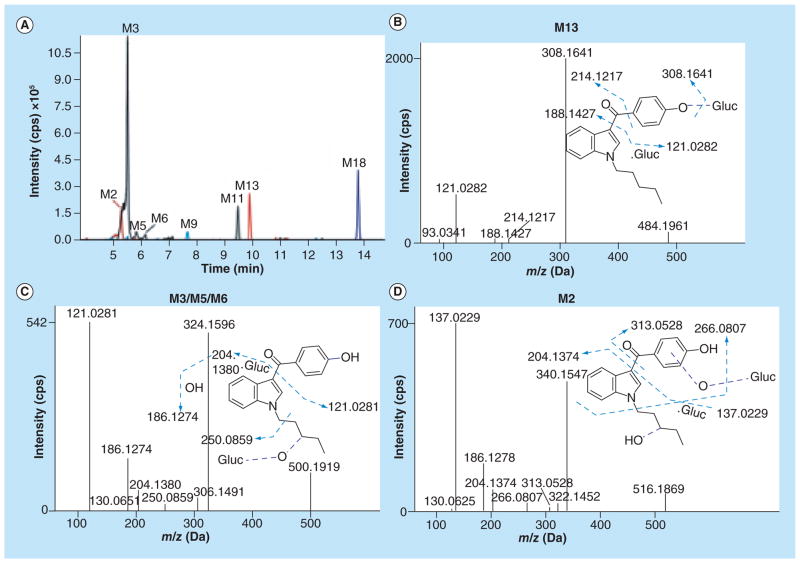
Eleven O-demethylated RCS-4 metabolites were identified. Representative XICs are shown in Figure 5A. M18 was observed as an O-demethylated metabolite with a protonated molecular ion at m/z 308.1650. The fragment ion spectrum contained m/z 121.0283 indicating a demethylated methoxyphenyl ring and m/z 144.0436, 188.1430 and 214.1222 indicating an unaltered N-pentyl indole structure (spectrum not shown). Glucuronidation of M18 produced M13 with a protonated molecular ion at m/z 484.1961. Fragment ions at m/z 188.1427 and 214.1217 indicated an unaltered N-pentyl indole structure; m/z 308.1641 corresponded to the aglycone moiety (Figure 5B). An O-demethylated/monohydroxylated metabolite (M9) with protonated molecular ion at m/z 324.1602 also was observed. Demethylation of the methoxyphenyl moiety yielded an ion at m/z 121.0285, m/z 144.0445 corresponds to the unaltered indole moiety. The fragment ion at m/z 250.0848 corresponds to the indole + O-demethylated phenol ring (Table 2, spectrum not shown).
Figure 5. Extracted ion chromatograms and fragment ion spectra of O-demethylated/glucuronidated, O-demethylated/ monohydroxylated/glucuronidated and O-demethylated/dihydroxylated/glucuronidated RCS-4 metabolites.
(A) Extracted ion chromatograms of M2 (m/z 516.1869), M3 (500.1919), M5 (500.1920), M6 (500.1915), and M11 (m/z 500.1915), M9 (m/z 324.1602), M13 (m/z 484.1961), and M18 (m/z 308.1650); (B) fragment ion spectra of O-demethylated/glucuronidated RCS-4 metabolite (M13); (C) fragment ion spectra of O-demethylated/monohydroxylated/glucuronidated RCS-4 metabolites (M3, M5, and M6); and (D) fragment ion spectra of O-demethylated/dihydroxylated/glucuronidated RCS-4 metabolites (M2).
M3, M5, M6 and M11 with protonated molecular ions at m/z 500.1919, 500.1920, 500.1915 and 500.1915 were observed as O-demethylated/monohydroxylated/glucuronidated RCS-4 metabolites, respectively. M3, M5, and M6 fragment ion spectra contained m/z 121.0281 (demethylated methoxyphenyl ring), m/z 130.0651 (unaltered indole ring), m/z 204.1380 (monohydroxylated N-pentyl chain) and m/z 250.0859 (loss of monohydroxylated N-butyl chain from the aglycone), respectively (Figure 5C). On the other hand, M11 contained an unaltered N-pentyl indole structure (m/z 144.0455 and 214.1226) and was generated by monohydroxylation at the demethylated methoxyphenyl ring (m/z 137.0232) followed by glucuronidation (Table 2, spectrum not shown).
M2 with a protonated molecular ion at m/z 516.1869 was an O-demethylated/dihydroxylated/glucuronidated product of RCS-4. The fragment ions at m/z 340.1547 corresponded to the O-demethylated/dihydroxylated aglycone moiety of RCS-4. Upon further analysis, M2 showed a demethylated/monohydroxylated methoxyphenyl ring (m/z 137.0229) and another hydroxylation on the N-pentyl chain (m/z 204.1374), respectively (Figure 5D).
O-demethylation with subsequent biotransformations
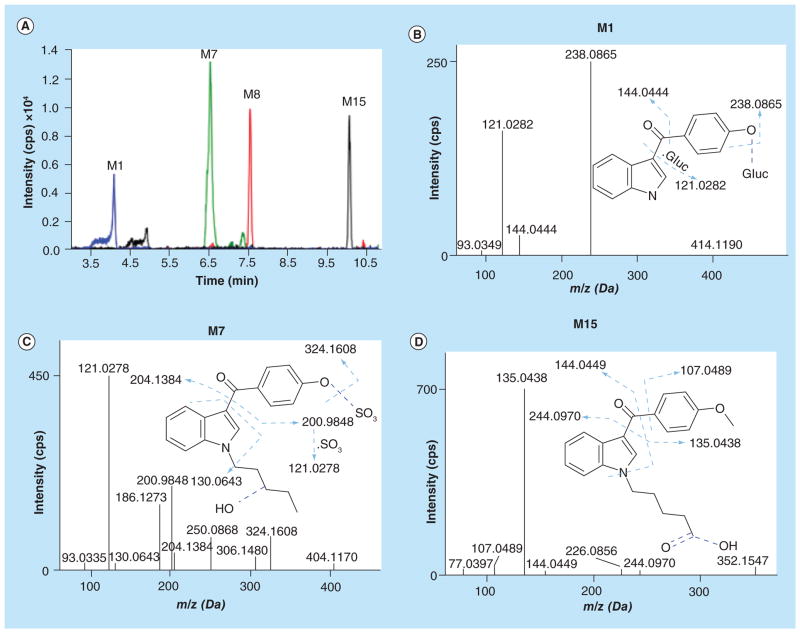
Additional O-demethylated metabolites with subsequent N-dealkylation/glucuronidation, carboxylation or sulfation also were observed. Representative XICs are shown in Figure 6A. M1 with a protonated molecular ion at m/z 414.1190 was an O-demethylated/N-depentylated/glucuronidated product of RCS-4. The fragment ion m/z 121.0282 indicated loss of a methyl group from the methoxyphenyl ring, m/z 144.0444 suggested an N-depentylated indole ring, and m/z 238.0865 represents the aglycone moiety, respectively (Figure 6B). M7 was an O-demethylated/monohydroxylated/sulfated RCS-4 metabolite with a protonated molecular ion at m/z 404.1170. m/z 121.0278 fragment ion suggested O-demethylation of the methoxyphenyl ring followed by sulfation (m/z 200.9848). m/z 130.0643 is associated with an unchanged indole ring, m/z 204.1384 with the monohydroxylated N-pentylindole (Figure 6C). m/z 306.1480 and 324.1608 fragment ions corresponded to the unsulfated part of M7. Furthermore, two carboxylated RCS-4 metabolites (M15 and M8) were identified. The M15 (protonated molecular ion at m/z 352.1547) spectrum contained m/z 107.0489 and 135.0438 fragment ions indicating unaltered methoxyphenyl ring, m/z 144.0449 suggesting unaltered indole ring and m/z 244.0970 pointing to carboxylation at the terminal position of the N-pentyl chain (Figure 6D). Demethylation of M15 led to M8 with a protonated molecular ion at m/z 338.1396. The m/z 121.0279 fragment ion indicated O-demethylation at the methoxyphenyl ring, m/z 144.0453 represents the unaltered indole ring, and m/z 218.1197 and 244.0966 indicate carboxylation in position 5 of the N-pentyl chain (Table 2; spectrum not shown).
Figure 6. Extracted ion chromatograms and fragment ion spectra of O-demethylated/N-depentylated/glucuronidated, O-demethylated/monohydroxylated/sulfated, and carboxylated RCS-4 metabolites.
(A) Extracted ion chromatograms of M1 (m/z 414.1190), M7 (m/z 404.1170), M8 (m/z 338.1396), and M15 (m/z 352.1547); (B) fragment ion spectra of O-demethylated/N-depentylated/glucuronidated RCS-4 metabolite (M1); (C) fragment ion spectra of O-demethylated/monohydroxylated/sulfated RCS-4 metabolite (M7); and (D) Fragment ion spectra of carboxylated RCS-4 metabolite (M15).
Human RCS-4 hepatic metabolic pathway & its comparison to published urinalysis study
As discussed earlier, human hepatocytes are superior in vitro systems as compared with human liver microsomes. We recently studied metabolism of AKB-48, an adamantyl based designer drug, using human hepatocytes and HRMS [39]. Mass spectra of designer drugs generated using human hepatocytes, or other in vitro systems such as human liver microsomes, liver subcellular fractions and recombinant drug-metabolizing enzymes or microorganisms are useful to identify metabolite targets for clinical and forensic urine drug screening methods. A limitation of our current method is that accurate structural assignment based on MS/MS data is often impossible. For unambiguous determination of the exact location of each functional group, other analytical procedures such as nuclear magnetic resonance spectroscopy, synthesis and chromatographic analysis of possible isomers or chiral GC or LC analysis are necessary.
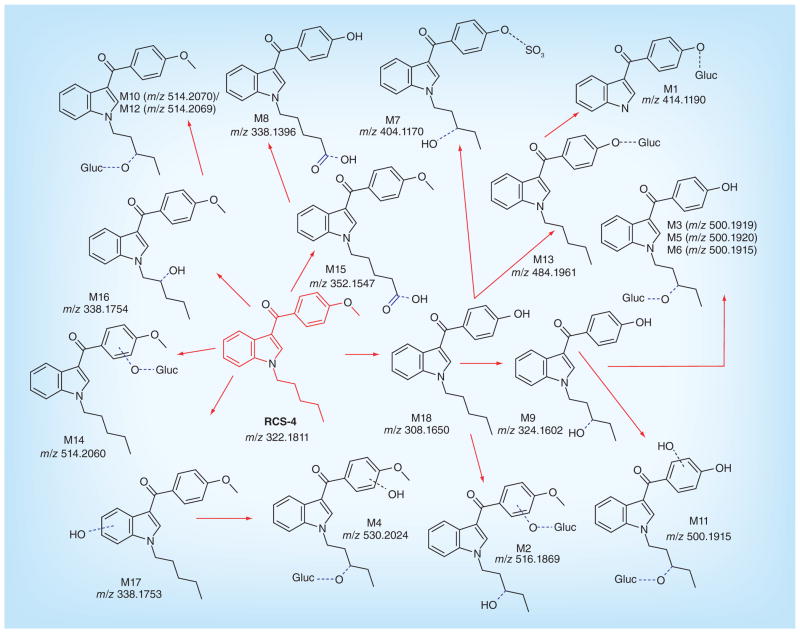
Although an earlier study identified some RCS-4 metabolites in human urine by GC-MS [12], a complete RCS-4 human metabolic pathway was unavailable. Based on the metabolic profile observed following human hepatocyte incubation, we propose RCS-4 Phase I and II metabolism in humans (Figure 7). Parent synthetic cannabinoids are rarely reported in clinical and forensic urine specimens [12–14], while metabolites predominate, suggesting extensive synthetic cannabinoid metabolism; therefore, it is likely that RCS-4 metabolites will also predominate in urine.
Figure 7.
Proposed metabolic pathways of RCS-4 in humans (m/z values correspond to protonated molecules).
A comparison of our data with Kavanagh et al.’s study highlights the importance of human hepatocytes for Phase I and II RCS-4 metabolite identification [12]. Similarly to Kavanagh et al., who observed four monohydroxylated RCS-4 metabolites, we observed two monohydroxylated and three monohydroxylated glucuronide conjugates (Table 2) contributing to more than 6% of the total metabolites observed. We observed a dihydroxylated glucuronide conjugate at low concentrations similar to results of the GC–MS analysis where dihydroxylated aglycone RCS-4 metabolites were observed at low levels in hydrolyzed urine. Our results show that the major pathways are O-demethylation of the methoxyphenyl moiety with simultaneous mono- or dihydroxylations with or without glucuronidation, which are partly in accordance with the published study. Kavanagh et al. observed monohydroxylation on the methoxyphenyl moiety and oxidation on the N-pentyl chain; we additionally observed both hydroxylation and oxidation reactions on the N-pentyl chain forming RCS-4 N-pentanoic acid metabolites (M8 and M15). The N-depentylated metabolite was similar to that observed by Kavanagh et al. Furthermore, sulfation (which led to one of the major metabolites) was also observed as an additional metabolic pathway of RCS-4. Metabolite profiling data obtained from our human hepatocyte study proposes metabolites useful for identifying RCS-4 intake. Identification of RCS-4 metabolites is critical because in vitro and in vivo studies showed that Phase I and II metabolites of JWH-018 and JWH-073 retain strong binding affinity and exhibit agonist potency at CB1 and CB2 receptors [28–30]. These metabolites should be synthesized for use as reference standards in clinical and forensic laboratory RCS-4 urine screening and confirmation testing.
Thus, out of 18 RCS-4 metabolites, we identified the following five as major metabolites based upon a pre-defined metabolite filtering criteria of peak area >5 × 10⁴. These are (in increasing rank order): O-demethylation/ glucuronidation (M13), monohydroxylation/glucuronidation (M10), O-demethylation/monohydroxylation/ sulfation (M7), O-demethylation/monohydroxylation/ glucuronidation (M3) and O-demethylation (M18).
Conclusion
This is the first study identifying both Phase I and II RCS-4 metabolites with human hepatocytes. An RCS-4 metabolic scheme was determined by analyzing in vitro human hepatocyte samples with high-resolution MS employing MDF- and dynamic background subtraction-IDA. Synthetic cannabinoid parent compounds are rarely found during synthetic cannabinoid testing and this is expected for other structurally related compounds like RCS-4. Parent compound scarcity in urine highlights the importance of targeting metabolites in synthetic cannabinoid testing. We identified metabolites that should be targeted in clinical and forensic analytical methods for detecting RCS-4 intake; we confirmed what was previously reported on Phase I metabolism via GC–MS analysis of hydrolyzed urine specimens [12], while also characterizing Phase II metabolites. Our in vitro hepatocyte metabolite spectra can be incorporated into LC–MS/MS urine screening method reference libraries to effectively identify RCS-4 intake.
Future perspective
Synthetic cannabinoids are gaining wide popularity across the globe. However, synthetic cannabinoids and their metabolites are difficult to detect with immunoassay techniques, due to the time required to develop antibodies to the emerging synthetic cannabinoids. Rarely are parent compounds found in urine; thus, identification of synthetic cannabinoids metabolites in urine is necessary. In most cases, we don’t know the urine metabolites of these new emerging synthetic cannabinoids. Incubation of synthetic cannabinoids with human hepatocytes and HRMS generates a complete range of Phase I and II metabolites. The mass spectra of these metabolites can be incorporated into mass spectral libraries that can be used to screen and confirm the presence of synthetic cannabinoids in human urine samples. If the introduction of new synthetic cannabinoids continues to increase, the need for a rapid, sensitive and specific high resolution urine screen will be needed to address this important public health problem. Rapidly determining the human metabolic profile of newly introduced synthetic cannabinoids and other designer drugs will be necessary. The spectra generated from human hepatocyte incubation and HRMS can be incorporated into MS libraries to aid screening of these important analytes. Also, identifying the most important metabolites will aid commercial standard manufacturers in their selection of analytes for standard preparation, another resource critical for the field to advance identification of these designer drugs.
Key terms.
- Spice
A herbal mixture containing one or more different synthetic cannabinoids intended to produce psychoactive effects similar to marijuana.
- Human hepatocytes
Hepatocytes are parenchymal cells of the liver. Being rich in drug-metabolizing enzymes, they play a major role in determining the fate of xenobiotics in the body.
- Phase I and II enzymes
Phase I drug-metabolizing enzymes typically comprise of the cytochrome P450 enzymes involved in oxidation, reduction or hydrolysis reactions leading to either active, inactive or reactive metabolites. Phase II enzymes generally produce polar drug conjugates that can readily be eliminated from the body.
- Triple TOF 5600 mass spectrometer
A hybrid mass spectrometer with Q1 as a Quadrupole assembly, Q2 as the Collision cell and Q3 as the TOF mass detector providing accurate mass and high resolution.
- Information-dependent acquisition
An information-dependent acquisition method automatically runs experiments based on results obtained from a previous experiment. The data acquired in the first experiment, the so-called survey scan, is evaluated based on user-defined criteria (e.g., ion intensity); then dependent scans are triggered. This methodology saves sample volume and run time.
Executive summary.
Background
Identification of urinary metabolic profile of new designer synthetic cannabinoid, RCS-4, by incubation with human hepatocytes followed by high resolution MS.
Results
Eighteen Phase I and II metabolites identified, with the major metabolic reactions being O-demethylation with or without glucuronidation.
This is the first study to report a sulfate metabolite of a synthetic cannabinoid.
Conclusion
Human hepatocyte culture and high resolution MS with data mining software is highly useful for identifying metabolic profiles for documenting new synthetic cannabinoid intake.
Acknowledgments
The authors thank AB Sciex for providing the 5600 TripleTOF mass spectrometer for mass spectral data acquisition.
Footnotes
Ethical conduct of research
The authors state that they have obtained appropriate institutional review board approval or have followed the principles outlined in the Declaration of Helsinki for all human or animal experimental investigations. In addition, for investigations involving human subjects, informed consent has been obtained from the participants involved.
For reprint orders, please contact reprints@future-science.com
Financial & competing interests disclosure
This research was supported by the Intramural Research Program of the National Institute on Drug Abuse, National Institutes of Health. The authors have no other relevant affiliations or financial involvement with any organization or entity with a financial interest in or financial conflict with the subject matter or materials discussed in the manuscript apart from those disclosed.
No writing assistance was utilized in the production of this manuscript.
References
- 1.Di Marzo V, Petrocellis LD. Plant, synthetic, and endogenous cannabinoids in medicine. Annu Rev Med. 2006;57:553–574. doi: 10.1146/annurev.med.57.011205.135648. [DOI] [PubMed] [Google Scholar]
- 2.Wiley JL, Marusich JA, Huffman JW, Balster RL, Thomas BF. Hijacking of basic research: the case of synthetic cannabinoids. Methods Rep RTI Press. 2011;2011:17971. doi: 10.3768/rtipress.2011.op.0007.1111. [DOI] [PMC free article] [PubMed] [Google Scholar]
- 3.Dresen S, Ferreiros N, Putz M, Westphal F, Zimmermann R, Auwarter V. Monitoring of herbal mixtures potentially containing synthetic cannabinoids as psychoactive compounds. J Mass Spectrom. 2010;45(10):1186–1194. doi: 10.1002/jms.1811. [DOI] [PubMed] [Google Scholar]
- 4.Hutter M, Kneisel S, Auwarter V, Neukamm MA. Determination of 22 synthetic cannabinoids in human hair by liquid chromatography-tandem mass spectrometry. J Chromatogr B Analyt Technol Biomed Life Sci. 2012;903:95–101. doi: 10.1016/j.jchromb.2012.07.002. [DOI] [PubMed] [Google Scholar]
- 5.Hutter M, Broecker S, Kneisel S, Auwarter V. Identification of the major urinary metabolites in man of seven synthetic cannabinoids of the aminoalkylindole type present as adulterants in ‘herbal mixtures’ using LC–MS/MS techniques. J Mass Spectrom. 2012;47(1):54–65. doi: 10.1002/jms.2026. [DOI] [PubMed] [Google Scholar]
- 6.Yanes EG, Lovett DP. High-throughput bioanalytical method for analysis of synthetic cannabinoid metabolites in urine using salting-out sample preparation and LC–MS/MS. J Chromatogr B Analyt Technol Biomed Life Sci. 2012;909:42–50. doi: 10.1016/j.jchromb.2012.10.013. [DOI] [PubMed] [Google Scholar]
- 7.Shanks KG, Dahn T, Terrell AR. Detection of JWH-018 and JWH-073 by UPLC-MS-MS in postmortem whole blood casework. J Anal Toxicol. 2012;36(3):145–152. doi: 10.1093/jat/bks013. [DOI] [PubMed] [Google Scholar]
- 8.Kneisel S, Speck M, Moosmann B, Corneillie TM, Butlin NG, Auwarter V. LC/ESI–MS/MS method for quantification of 28 synthetic cannabinoids in neat oral fluid and its application to preliminary studies on their detection windows. Anal Bioanal Chem. 2013;405(14):4691–4706. doi: 10.1007/s00216-013-6887-0. [DOI] [PubMed] [Google Scholar]
- 9.Wohlfarth A, Scheidweiler KB, Chen X, Liu HF, Huestis MA. Qualitative confirmation of 9 synthetic cannabinoids and 20 metabolites in human urine using LC–MS/MS and library search. Anal Chem. 2013;85(7):3730–3738. doi: 10.1021/ac3037365. [DOI] [PMC free article] [PubMed] [Google Scholar]
- 10.de Jager AD, Warner JV, Henman M, Ferguson W, Hall A. LC–MS/MS method for the quantitation of metabolites of eight commonly-used synthetic cannabinoids in human urine--an Australian perspective. J Chromatogr B Analyt Technol Biomed Life Sci. 2012;897:22–31. doi: 10.1016/j.jchromb.2012.04.002. [DOI] [PubMed] [Google Scholar]
- 11.Kneisel S, Auwarter V. Analysis of 30 synthetic cannabinoids in serum by liquid chromatography-electrospray ionization tandem mass spectrometry after liquid-liquid extraction. J Mass Spectrom. 2012;47(7):825–835. doi: 10.1002/jms.3020. [DOI] [PubMed] [Google Scholar]
- 12.Kavanagh P, Grigoryev A, Melnik A, Simonov A. The identification of the urinary metabolites of 3-(4-methoxybenzoyl)-1-pentylindole (RCS-4), a novel cannabimimetic, by gas chromatography-mass spectrometry. J Anal Toxicol. 2012;36(5):303–311. doi: 10.1093/jat/bks032. [DOI] [PubMed] [Google Scholar]
- 13.Grigoryev A, Melnik A, Savchuk S, Simonov A, Rozhanets V. Gas and liquid chromatography-mass spectrometry studies on the metabolism of the synthetic phenylacetylindole cannabimimetic JWH-250, the psychoactive component of smoking mixtures. J Chromatogr B Analyt Technol Biomed Life Sci. 2011;879(25):2519–2526. doi: 10.1016/j.jchromb.2011.07.004. [DOI] [PubMed] [Google Scholar]
- 14.Sobolevsky T, Prasolov I, Rodchenkov G. Detection of urinary metabolites of AM-2201 and UR-144, two novel synthetic cannabinoids. Drug Test Anal. 2012 doi: 10.1002/dta.1418. (Epub ahead of print) [DOI] [PubMed] [Google Scholar]
- 15.CESAR. Synthetic marijuana third most reported substance used by US high school students. CESAR FAX Report. 2013;22:17. [Google Scholar]
- 16.Kim J, In S, Park Y, Park M, Kim E, Lee S. Deposition of JWH-018, JWH-073 and their metabolites in hair and effect of hair pigmentation. Anal Bioanal Chem. 2013;405(30):9769–9778. doi: 10.1007/s00216-013-7423-y. [DOI] [PubMed] [Google Scholar]
- 17.Gottardo R, Sorio D, Musile G, et al. Screening for synthetic cannabinoids in hair by using LC-QTOF MS: a new and powerful approach to study the penetration of these new psychoactive substances in the population. Med Sci Law. 2014;54(1):22–27. doi: 10.1177/0025802413477396. [DOI] [PubMed] [Google Scholar]
- 18.Salomone A, Gerace E, D’Urso F, Di Corcia D, Vincenti M. Simultaneous analysis of several synthetic cannabinoids, THC, CBD and CBN, in hair by ultra-high performance liquid chromatography tandem mass spectrometry. Method validation and application to real samples. J Mass Spectrom. 2012;47(5):604–610. doi: 10.1002/jms.2988. [DOI] [PubMed] [Google Scholar]
- 19.Salomone A, Luciano C, Di Corcia D, Gerace E, Vincenti M. Hair analysis as a tool to evaluate the prevalence of synthetic cannabinoids in different populations of drug consumers. Drug Test Anal. 2014;6(1–2):126–134. doi: 10.1002/dta.1556. [DOI] [PubMed] [Google Scholar]
- 20.Coulter C, Garnier M, Moore C. Synthetic cannabinoids in oral fluid. J Anal Toxicol. 2011;35(7):424–430. doi: 10.1093/anatox/35.7.424. [DOI] [PubMed] [Google Scholar]
- 21.de Castro A, Pineiro B, Lendoiro E, Cruz A, Lopez-Rivadulla M. Quantification of selected synthetic cannabinoids and Delta9-tetrahydrocannabinol in oral fluid by liquid chromatography-tandem mass spectrometry. J Chromatogr A. 2013;1295:99–106. doi: 10.1016/j.chroma.2013.04.035. [DOI] [PubMed] [Google Scholar]
- 22.Oiestad EL, Johansen U, Christophersen AS, Karinen R. Screening of synthetic cannabinoids in preserved oral fluid by UPLC-MS/MS. Bioanalysis. 2013;5(18):2257–2268. doi: 10.4155/bio.13.182. [DOI] [PubMed] [Google Scholar]
- 23.Rodrigues WC, Catbagan P, Rana S, Wang G, Moore C. Detection of synthetic cannabinoids in oral fluid using ELISA and LC–MS-MS. J Anal Toxicol. 2013;37(8):526–533. doi: 10.1093/jat/bkt067. [DOI] [PubMed] [Google Scholar]
- 24.Strano-Rossi S, Anzillotti L, Castrignano E, Romolo FS, Chiarotti M. Ultra high performance liquid chromatography-electrospray ionization-tandem mass spectrometry screening method for direct analysis of designer drugs, ‘spice’ and stimulants in oral fluid. J Chromatogr A. 2012;1258:37–42. doi: 10.1016/j.chroma.2012.07.098. [DOI] [PubMed] [Google Scholar]
- 25.Scheidweiler KB, Cone EJ, Moolchan ET, Huestis MA. Dose-related distribution of codeine, cocaine, and metabolites into human hair following controlled oral codeine and subcutaneous cocaine administration. J Pharmacol Exp Ther. 2005;313(2):909–915. doi: 10.1124/jpet.104.082388. [DOI] [PubMed] [Google Scholar]
- 26.Aung MM, Griffin G, Huffman JW, et al. Inf luence of the N-1 alkyl chain length of cannabimimetic indoles upon CB(1) and CB(2) receptor binding. Drug Alcohol Depend. 2000;60(2):133–140. doi: 10.1016/s0376-8716(99)00152-0. [DOI] [PubMed] [Google Scholar]
- 27.Wilson RI, Nicoll RA. Endocannabinoid signaling in the brain. Science. 2002;296(5568):678–682. doi: 10.1126/science.1063545. [DOI] [PubMed] [Google Scholar]
- 28.Rajasekaran M, Brents LK, Franks LN, Moran JH, Prather PL. Human metabolites of synthetic cannabinoids JWH-018 and JWH-073 bind with high affinity and act as potent agonists at cannabinoid type-2 receptors. Toxicol Appl Pharmacol. 2013;269(2):100–108. doi: 10.1016/j.taap.2013.03.012. [DOI] [PMC free article] [PubMed] [Google Scholar]
- 29.Brents LK, Gallus-Zawada A, Radominska-Pandya A, et al. Monohydroxylated metabolites of the K2 synthetic cannabinoid JWH-073 retain intermediate to high cannabinoid 1 receptor (CB1R) affinity and exhibit neutral antagonist to partial agonist activity. Biochem Pharmacol. 2012;83(7):952–961. doi: 10.1016/j.bcp.2012.01.004. [DOI] [PMC free article] [PubMed] [Google Scholar]
- 30.Brents LK, Reichard EE, Zimmerman SM, Moran JH, Fantegrossi WE, Prather PL. Phase I hydroxylated metabolites of the K2 synthetic cannabinoid JWH-018 retain in vitro and in vivo cannabinoid 1 receptor affinity and activity. PLoS ONE. 2011;6(7):e21917. doi: 10.1371/journal.pone.0021917. [DOI] [PMC free article] [PubMed] [Google Scholar]
- 31.Chimalakonda KC, Seely KA, Bratton SM, et al. Cytochrome P450-mediated oxidative metabolism of abused synthetic cannabinoids found in K2/Spice: identification of novel cannabinoid receptor ligands. Drug Metab Dispos. 2012;40(11):2174–2184. doi: 10.1124/dmd.112.047530. [DOI] [PMC free article] [PubMed] [Google Scholar]
- 32.Chimalakonda KC, Bratton SM, Le VH, et al. Conjugation of synthetic cannabinoids JWH-018 and JWH-073, metabolites by human UDP-glucuronosyltransferases. Drug Metab Dispos. 2011;39(10):1967–1976. doi: 10.1124/dmd.111.040709. [DOI] [PMC free article] [PubMed] [Google Scholar]
- 33.Jin MJ, Lee J, In MK, Yoo HH. Characterization of in vitro metabolites of CP 47,497, a synthetic cannabinoid, in human liver microsomes by LC–MS/MS. J Forensic Sci. 2013;58(1):195–199. doi: 10.1111/j.1556-4029.2012.02261.x. [DOI] [PubMed] [Google Scholar]
- 34.Kim U, Jin MJ, Lee J, Han SB, In MK, Yoo HH. Tentative identification of Phase I metabolites of HU-210, a classical synthetic cannabinoid, by LC–MS/MS. J Pharm Biomed Anal. 2012;64–65:26–34. doi: 10.1016/j.jpba.2012.02.007. [DOI] [PubMed] [Google Scholar]
- 35.Wintermeyer A, Moller I, Thevis M, et al. In vitro Phase I metabolism of the synthetic cannabimimetic JWH-018. Anal Bioanal Chem. 2010;398(5):2141–2153. doi: 10.1007/s00216-010-4171-0. [DOI] [PubMed] [Google Scholar]
- 36.Logan BK, Reinhold LE, Xu A, Diamond FX. Identification of synthetic cannabinoids in herbal incense blends in the United States. J Forensic Sci. 2012;57(5):1168–1180. doi: 10.1111/j.1556-4029.2012.02207.x. [DOI] [PubMed] [Google Scholar]
- 37.Denooz R, Vanheugen JC, Frederich M, de Tullio P, Charlier C. Identification and structural elucidation of four cannabimimetic compounds (RCS-4, AM-2201, JWH-203 and JWH-210) in seized products. J Anal Toxicol. 2013;37(2):56–63. doi: 10.1093/jat/bks095. [DOI] [PubMed] [Google Scholar]
- 38.Patton AL, Chimalakonda KC, Moran CL, et al. K2 toxicity: fatal case of psychiatric complications following AM2201 exposure. J Forensic Sci. 2013;58(6):1676–1680. doi: 10.1111/1556-4029.12216. [DOI] [PMC free article] [PubMed] [Google Scholar]
- 39.Gandhi AS, Zhu M, Pang S, et al. First characterization of AKB-48 metabolism, a novel synthetic cannabinoid, using human hepatocytes and high-resolution mass spectrometry. AAPS J. 2013;15(4):1091–1098. doi: 10.1208/s12248-013-9516-0. [DOI] [PMC free article] [PubMed] [Google Scholar]


