

Abstract
When the initial effect of photodynamic therapy (PDT) involves mitochondrial photodamage, an early effect is loss of the mitochondrial membrane potential (Δψm). Using murine hepatoma 1c1c7 cells and a photosensitizing agent known to target mitochondria, we examined loss of Δψm, initiation of apoptosis and loss of viability as a function of time and light dose. There was a correlation between loss of viability and the rapid disappearance of Δψm, as detected by the potential-sensitive probe Mitotracker Orange (MTO). Loss of Δψm was, however, reversible even with a substantial loss of viability. Unless there was a supra-lethal level of photodamage, 1c1c7 cells recovered their mitochondrial membrane potential, even if the cell population was on the pathway to apoptosis and cell death. These results indicate that when mitochondria are the initial PDT target, a qualitative estimate of photokilling can be provided by assessing the initial loss of Δψm.
INTRODUCTION
In 2001, Oleinick’s group reported that the initiation of apoptosis and cell death, after irradiation of murine leukemia cells photosensitized with the phthalocyanine Pc 4, was not necessarily correlated with loss of the mitochondrial membrane potential (Δψm) (1). Pc 4 binds to a variety of intracellular loci including mitochondria, lysosomes and the ER (2). In the present study, the relationship between apoptotic cell death and Δψm loss was examined using the photosensitizer BPD (benzoporphyrin derivative) an agent known to preferentially target mitochondria for photodamage (3,4). As in previous studies delineating PDT death pathways (5,6), murine 1c1c7 hepatoma cell culture was our model system.
There are several fluorescent probes that localize in mitochondria. MitoTracker Orange (MTO) can be used to probe the membrane potential (7) while MitoTracker Green (MTG) is much less responsive to Δψm (8). In order to characterize effects of mitochondrial photodamage on viability, caspase activation and Δψm, we used a clonogenic assay, assessed MTO and MTG localization and assessed activation of procaspases 3 and 7 by a fluorogenic assay (9).
MATERIALS AND METHODS
Chemicals and supplies
BPD (benzoporphyrin derivative, Verteporfin) was purchased from VWR (Cat No 1711461). Other reagents were obtained from Sigma-Aldrich and were of the highest available purity. Fluorescent probes were provided by Life Technologies/Molecular Probes/Invitrogen, Carlsbad, CA.
Cell culture and clonogenic assays
Growth of murine hepatoma 1c1c7 cells and procedures for clonogenic assays are described in Ref. 6.
PDT protocols
Cultures were grown on cover slips in 35 mm diameter plastic dishes. These were incubated with 0.5 μM BPD for 1 h at 37°. The medium was then replaced and the dishes irradiated using a 600-watt quartz-halogen source filtered through 10 cm of water to remove wavelengths of light > 900 nm. The bandwidth of the light beam was further confined by interference filters (Oriel, Stratford CT) to 690 ± 10 nm. Irradiation times were calculated, based on clonogenic studies, so as to yield the desired effects on viability.
Microscopy protocols
After specified procedures, cells were incubated with MTO and MTG (0.2 μM) for 10 min at 37°. Phase-contrast and fluorescence images were acquired with a Nikon E-600 microscope and a Rolera EM-CCD camera. Images were processed by MetaMorph software. MTG fluorescence at 515 nm was detected using a Nikon B2A filter assembly (450–490 nm excitation); MTO fluorescence (575 nm) was detected with a G filter (510–560 nm excitation). To eliminate fluorescence derived from BPD, a 650 nm low-pass filter was inserted into the emission pathway. For all determinations involving fluorescence microscopy, at least 10 images of 30–50 cells were acquired at a magnification of 400X. Typical fluorescence images are shown in Figs. 1–3.
Figure 1.
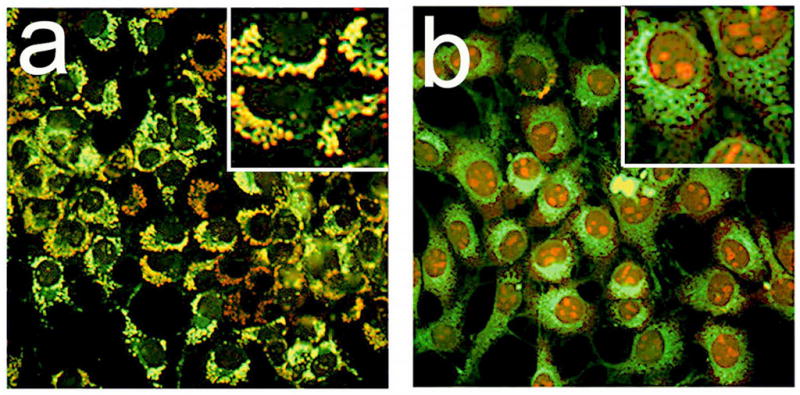
Mitochondrial labeling patterns: MTO (red), MTG (green). Left: control (untreated) 1c1c7 cells. Right, cells photosensitized with BPD and labeled directly after irradiation (300 mJ/sq cm). In panel b, the intensity of the red pixels was amplified by a factor of 2 so that they could more readily be seen. Insets show details of labeling patterns at a higher magnification.
Figure 3.

Recovery of Δψm 10–60 min after irradiation, as detected by MTO labeling patterns. Cells were incubated for intervals specified on the y axis, then labeled with MTO for an additional 10 min. The light dose is indicated on the x axis.
DEVDase assays
For this assay, cells were grown on 35mm diameter plastic dishes. After irradiation, cell cultures were maintained at 37° for one hour. Adhering cells were scraped from the plate; any floating cells were collected by centrifugation. The resulting cell pellets were then assayed for DEVDase activity as described in Ref. 9. This procedure measures the maximum rate of cleavage of a fluorogenic substrate, reflecting the activation of procaspases 3 and 7. This enzymatic process is a known factor in the intrinsic apoptosis pathway (10). A kit provided by Invitrogen/Life Technologies was used for this purpose (cat. no. E13184). Enzyme levels are reported in terms of nmol product/min/mg protein. Each assay was performed in triplicate. The Micro Lowry assay (Sigma Aldrich Cat Nos TP0200, B3984) was used to estimate protein concentrations, using bovine serum albumin as the standard.
RESULTS AND DISCUSSION
Fluorescence labeling patterns
MTO and MTG both label mitochondria, but MTO is much more responsive to changes in Δψm, while MTG labels mitochondria irrespective of Δψm. This is illustrated by Fig. 1 where the probes were simultaneously used to assess effects of an LD99 PDT dose on 1c1c7 cells. In untreated controls, there was a high degree of co-localization (yellow pixels), although there were some regions that were labeled with MTG but not MTO (panel a). These presumably represent mitochondria without a sufficient membrane potential to attract MTO. Mitochondrial photodamage led a loss of punctate MTO fluorescence that colocalized with MTG (panel b). Images showing the loss of punctate MTO fluorescence in cells that lose Δψm are shown in Fig. 2.
Figure 2.
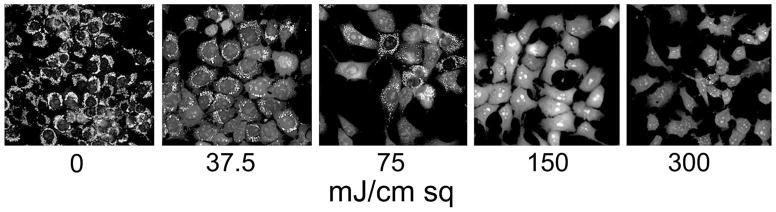
Loss of Δψm of 1c1c7 cells photosensitized with BPD, as indicated by MTO labeling (10 min) directly after irradiation. The total light dose (mJ/sq cm) is indicated under each panel.
PDT effects on Δψm viability and apoptosis
MTO labeling patterns were assessed within 10 min of irradiation of photosensitized cells. Control (untreated) cells showed a pattern consistent with mitochondrial localization, but this was progressively lost as the PDT dose was increased. The loss of MTO labeling reflected the decrease in loss of viability as measured by a clonogenic assay (Table 1). A comparison with DEVDase levels, a measure of caspase 3/7 activation, indicated that the extent of photokilling was associated with the activation of these procaspases. Once a maximum rate of caspase activation is reached, this cannot be altered by increasing the light dose. Moreover, it is possible that very high levels of photodamage might result in non-specific inactivation of procaspase proteins.
Table 1.
Effects of graded PDT doses on DEVDase activity and clonogenicity.
| Light dose mJ/sq cm | DEVDase activity | Clonogenicity |
|---|---|---|
| 0 | 0.07 ± 0.01 | 100 ± 3 |
| 37.5 | 0.21 ± 0.03 | 91 ± 3 |
| 75 | 0.91 ± 0.13 | 48 ± 5 |
| 150 | 2.5 ± 0.18 | 5 ± 2 |
| 300 | 2.2 ± 0.31 | <1 |
1c1c7 cells were treated with 0.5 μM BPD for 60 min at 373, the medium was replaced and the cultures irradiated at 690 ± 10 nm using the specified light doses. DEVDase activity (expressed as nmol/mg protein/min) was measured 60 min later. Triplicate samples were used to determine survival by a clonogenic assay. DEVDase results represent average ± SD for 3 replicate samples.
Recovery of Δψm after photodamage
When 1c1c7 cells were maintained at 373after irradiation, the punctate MTO labeling pattern gradually returned (Fig. 3) unless a supralethal light dose (> 99.9% photokilling) had been administered. With lesser levels of photodamage, the time for recovery of the MTO labeling pattern was proportional to the light fluence. Using a 75 mJ/sq cm light dose (LD50 conditions), the MTO labeling pattern began to return after 30 min and was observed in almost all cells 60 min after irradiation. Under LD95 conditions, approx. 50% of the cell population showed an MTO labeling pattern consistent with Δψm recovery 60 min after irradiation. With the highest light dose, only a few cells showed recovery of Δψm after 60 min, and this did not improve after 4 hr.
Oleinick had reported that irradiation of murine leukemia cells photosensitized with Pc 4 showed a progressive decrease in Δψm after irradiation, with no evidence of recovery or repair (1). A possible explanation relates to differences in the cell types being compared. The Pc 4 study involved a murine lymphoblastic leukemia cell line. Such cells tend to contain high levels of procaspases and have a very rapid apoptotic response to photodamage (9).
These results indicate that the initial loss of Δψm can provide an approximate estimate of the extent of photokilling. This will not replace clonogenic or other viability measurements, but may be useful for providing an estimate of the efficacy of photosensitizing agents that predominantly target mitochondria. The association of caspase activation with photokilling suggests an apoptotic pathway to cell death, a finding that is often associated with photodynamic therapy (11). An unexpected observation was the finding that cultures of 1c1c7 cells can regain their mitochondrial membrane potential even after photodamage sufficient to kill 95% of a cell population.
Acknowledgments
This study was supported by grant CA23378 from the National Cancer Institute, National Institutes of Health. I thank Ann Marie Santiago for excellent technical assistance and Prof. John J. Reiners Jr for a critical commentary on this report.
References
- 1.Chiu SM, Oleinick NL. Dissociation of mitochondrial depolarization from cytochrome c release during apoptosis induced by photodynamic therapy. Br J Cancer. 2001;84:1099–1106. doi: 10.1054/bjoc.2000.1714. [DOI] [PMC free article] [PubMed] [Google Scholar]
- 2.Trivedi NS, Wang HW, Nieminen AL, Oleinick NL, Izatt JI. Quantitative analysis of Pc 4 localization in mouse lymphoma (LY-R) cells via double-label confocal fluorescence microscopy. Photochem Photobiol. 2000;71:634–639. doi: 10.1562/0031-8655(2000)071<0634:qaopli>2.0.co;2. [DOI] [PubMed] [Google Scholar]
- 3.Peng TI, Chang CJ, Guo MJ, Wang YH, Yu JS, Wuand HY, Jou MJ. Mitochondrion-targeted photosensitizer enhances the photodynamic effect-induced mitochondrial dysfunction and apoptosis. Ann N Y Acad Sci. 2005;1042:419–428. doi: 10.1196/annals.1338.035. [DOI] [PubMed] [Google Scholar]
- 4.Runnels JM, Chen N, Ortel B, Kato D, Hasan T. BPD-MA-mediated photosensitization in vitro and in vivo: cellular adhesion and beta1 integrin expression in ovarian cancer cells. Br J Cancer. 1999;80:946–953. doi: 10.1038/sj.bjc.6690448. [DOI] [PMC free article] [PubMed] [Google Scholar]
- 5.Reiners JJ, Jr, Caruso JA, Mathieu P, Chelladurai B, Yin XM, Kessel D. Release of cytochrome c and activation of pro-caspase-9 following lysosomal photodamage involves Bid cleavage. Cell Death Differ. 2002;9:934–944. doi: 10.1038/sj.cdd.4401048. [DOI] [PMC free article] [PubMed] [Google Scholar]
- 6.Andrzejak M, Price M, Kessel D. Apoptotic and autophagic responses to photodynamic therapy in 1c1c7 murine hepatoma cells. Autophagy. 2011;7:979–984. doi: 10.4161/auto.7.9.15865. [DOI] [PMC free article] [PubMed] [Google Scholar]
- 7.Krysko DV, Roels F, Leybaert L, D’Herde K. Mitochondrial transmembrane potential changes support the concept of mitochondrial heterogeneity during apoptosis. J Histochem Cytochem. 2001;49:1277–1284. doi: 10.1177/002215540104901010. [DOI] [PubMed] [Google Scholar]
- 8.Keij JF, Bell-Prince C, Steinkamp JA. Staining of mitochondrial membranes with 10-nonyl acridine orange, MitoFluor Green, and MitoTracker Green is affected by mitochondrial membrane potential altering drugs. Cytometry. 2000;39:203–210. doi: 10.1002/(sici)1097-0320(20000301)39:3<203::aid-cyto5>3.0.co;2-z. [DOI] [PubMed] [Google Scholar]
- 9.Kessel D, Luo Y. Photodynamic therapy: a mitochondrial inducer of apoptosis. Cell Death Differ. 1999;6:28–35. doi: 10.1038/sj.cdd.4400446. [DOI] [PubMed] [Google Scholar]
- 10.Jiang X, Wang X. Cytochrome C-mediated apoptosis. Annu Rev Biochem. 2004;73:87–106. doi: 10.1146/annurev.biochem.73.011303.073706. [DOI] [PubMed] [Google Scholar]
- 11.Agostinis P, Berg K, Cengel KA, Foster TH, Girotti AW, Gollnick SO, Hahn SM, Hamblin MR, Juzeniene A, Kessel D, Korbelik M, Moan J, Mroz P, Nowis D, Piette J, Wilson BC, Golab J. Photodynamic therapy of cancer: an update. CA Cancer J Clin. 2011;61:250–281. doi: 10.3322/caac.20114. [DOI] [PMC free article] [PubMed] [Google Scholar]