

Abstract
Fully manual use of conventional multiwell plates makes enzyme-linked immunosorbent assay (ELISA)-based immunoassays highly time-consuming and labor-intensive. Here, we present a capillarity-driven on-chip immunoassay that greatly saves time and labor with an inexpensive setup. Our immunoassay process starts with pipetting multiple solutions into multiwells constructed on a microfluidic device chip. Subsequently, capillarity spontaneously transports multiple sample solutions and common reagent solutions into assigned detection channels on the chip in a purely passive and preprogrammed manner. Our device implements capillarity-driven immunoassays involving four sample and six reagent solutions within 30 min by orchestrating the functions of on-chip passive components. Notably, our immunoassay technique reduces the total number of pipetting processes by ~5 times, as compared to assays on multiwell plates (48 vs 10). This assay technique allows us to quantify the concentrations of C-reactive protein and suppressor of tumorigenicity 2 with a detection limit of 8 and 90 pM, respectively. This device should be useful for sophisticated, parallel biochemical microfluidic processing in point-of-care settings under limited resources.

Biochemical analysis based on immunoassay provides a powerful means to detect or quantify biomarkers in biological samples.1 Among various immunoassay techniques, the enzyme-linked immunosorbent assay (ELISA) is widely used due to its high detection sensitivity and selectivity.2–4 ELISA-based immunoassays are, however, normally (i) time-consuming and (ii) labor-intensive. This is because the ELISA technique typically entails the use of a plate consisting of multiwells, and each well requires many pipetting steps and long incubation times for the assay reagents and molecules. Specifically, slow biomolecular diffusion in each well results in an incubation time as long as several hours in each conjugation step, which, in the end, amounts to a total assay time of up to a day. Also, much labor is inevitable even for a single well, as multiple pipetting steps are used to carefully change and wash solutions over the multistep assay sequence. Obviously, a user’s labor becomes enormous as the number of the wells increases. So far, an automated external controller such as an expensive robotic pipettor has been used to save human users the enormous labor requirement. But this still does not reduce the assay time. Is there any inexpensive way to significantly save both time and labor for doing parallel immunoassays?
One potential approach is to exploit capillarity in microfluidic channels. Capillarity is a liquid’s spontaneous motion inside microchannels that occurs without any external controllers. In this paper, we report on fully passive programming and controlling of capillarity in a microfluidic chip. Specifically, our study demonstrates that capillarity-driven reagent transport through microfluidic channels reduces the biomolecular incubation time, owing to convective flows and smaller diffusion lengths. Also, we show that capillarity through the channels can eliminate many labor-intensive pipettings with a microfluidic design that shares common reagents among multiwells and that enables direct sequential replacement of biomolecular solutions without additional washing steps.
To date, passively controlling capillarity in a sophisticated manner has been perceived as a significant challenge: without active capillarity control such as electrowetting,5,6 operations of many passive components should be orchestrated in a complex microfluidic network. Moreover, passive sequential and parallel flow processing of these solutions are further challenging especially when the solutions have a wide variation in physical properties. Several research groups demonstrated microfluidic devices passively regulating capillarity for immunoassay.7–23 But these devices are only useful for a limited number of solutions as their functions are generally realized with relatively simple channel architectures. In contrast, we developed capillarity control mechanisms to regulate meniscus flow timing, synchronize different meniscus motions, and regulate flow directions of multiple solutions in our previous study.24 However, these mechanisms have not yet been applied to immunoassays with clinically relevant biochemical solutions. Successful implementation of these mechanisms for clinical tests would open the door to practical use of capillarity-driven immunoassays in disease screening.
Here, we apply the aforementioned sophisticated capillarity-control mechanisms to on-chip parallel immunoassays. In our parallel immunoassay, capillarity sequentially transports multiple sample solutions and common reagent solutions into assigned detection channels of our microfluidic device in a purely passive and preprogrammed manner (Figure 1). All the solution distribution steps needed for multiplexing and transport processes required for the assay are spontaneously achieved after single-time sequential loading of each solution into designated on-chip wells using a pipet. In this way, our method completely eliminates the use of resource-intensive automated external controllers. Importantly, our method eliminates both the user’s waiting time for each incubation process and a large number of the pipetting steps. Also, the total assay time only takes ~30 min owing to convective flows in microfluidic channels. In this study, we successfully demonstrated four-sample parallel immunoassays detecting clinically relevant biomarkers, such as C-reactive protein (CRP) and suppressor of tumorigenicity 2 (ST2).
Figure 1.

Capillarity-driven immunoassay device for sequential and parallel flow processing. (a) Photographs of the device. An immunoassay using our device involved sequential pipetting of the capture antibody (cAb), blocking (B), sample (S), synchronization (Sync), detection antibody (dAb), and washing (W) solutions into the wells. Each well is labeled according to the loaded solution. (b) Schematic of the device consisting of the inlet wells, the timing channels, the Sync channel, the detection channels, the auxiliary channels, and the connection channel. The number marked in each well represents the order of the pipetting and assay sequence. (c) Expanded view of sections i–iii of panel a. Section i shows an area including the detection, Sync, and auxiliary channels. Section ii illustrates the device structure for the merging of solutions, and section iii shows a timing channel serially connected from a relatively wide channel.
WORKING PROCESS
Our microfluidic device consists of four sample wells and six reagent wells, and all the wells are connected via microchannels to share common reagent solutions (Figure 1). An immunoassay using our device involves sequential pipetting of the capture antibody (cAb) solution (sequence 1), the blocking (B) solution (sequence 2), the sample (S) solution (sequence 3), the synchronization (Sync) solution (sequence 3s), and the detection antibody (dAb) solution (sequence 4) with a 1 min interval, and finally the washing solution (W) (sequence 5) with a 5 min interval. These solutions are categorized into two types: (1) target solutions that should enter the detection channels and (2) nontarget solutions that should not enter the detection channels. Figure 1b shows the order of the pipetting and loading steps in the wells and depicts the timing channels (black with the timer symbol), the Sync channel (green with the circulation symbol), the auxiliary channels (light green), the detection channels (red), and the connection channel (orange). The main channel includes the detection and connection channels. For the flow timing control, the timing channels delay the timing of each solution’s flow to the detection channels sequentially, and the Synch channels enable synchronized motion of sample solutions. Also, each solution’s flow direction is passively controlled by the inlet meniscus pressure in conjunction with the channel’s fluidic conductance.
Figure 2a shows the time sequence of microfluidic solution motion toward the detection channels. The top panels of each step figure illustrate the sequential biomolecule conjugation process on the top wall of the detection channel. The dotted lines in the bottom panels of each step in Figure 2a represent unfilled channels. As the assay progresses, these channels are filled with solutions sequentially loaded into their assigned wells. For example, in the second bottom panel of step 1, we pipet the blocking solution, and it passes its timing channel (blue color). In the diagram, the wells containing solutions that do not directly contribute to the assay in the detection channel are colored in gray. The first bottom panels of steps 2–5 (Figure 2a) illustrate the moment that target solutions merge with a solution in the main channel. The merging happens after the target solutions are pipetted and their motion is delayed in the timing channels. Figure 2b presents the delay time imposed by the timing channels and the pipetting time, which is the duration for completing all the pipetting processes in each step. These pipetting and delay times comprise the loading time of target solutions to the main channel. The targeting solutions and the nontarget solutions involved in each step are listed in Table 1.
Figure 2.

Sequential, parallel immunoassay. (a) Immunoassay steps. Dotted lines represent unfilled channels. In each step, biomolecules related to the assay sequentially conjugate on the surface of the detection channels (defined in Figure 1b). The arrows represent the flow directions of target solutions in each step. The cross-sectional views of AA′ show the sequential conjugation of the assay molecules on the detection-channel surface. The initial well pressures of the cAB, sample, and other solutions were 15, 78, and ~100 Pa, respectively. (b) Loading time of target solutions of each assay step. The loading time includes the flow-delay time caused by the timing channels and the pipetting time (i.e., the total duration for finishing all the pipetting processes in each step).
Table 1.
Summary of Target and Nontarget Solutions in Each Assay Step
| target solution | nontarget solution | |
|---|---|---|
| step 1 | cAb | none |
| step 2 | B | none |
| step 3 | S | Sync, B |
| step 4 | dAb | Sync, B, S |
| step 5 | washing | Sync, B, S, dAb |
The arrows in each step (Figure 2a) represent the flow directions of solutions. The size of each arrow corresponds to the relative speed of the solution. As shown in step 1 of Figure 2a, the cAb solution fills the detection channels and then the connection channels by means of capillarity. As a result, the cAb solution occupies the main channel. Meanwhile, the cAb molecules are immobilized primarily on the top and side poly(dimethylsiloxane) (PDMS) walls of the channel because of their surface hydrophobicity [1% (w/v) bovine serum albumin (BSA) contact angle: 98°]. In step 2, the blocking solution consisting of 1% BSA merges with the cAb solution in the main channel, passes through the connection channels, and then fills the detection channels to adsorb BSA. This prevents nonspecific biomolecule binding onto the non-cAb immobilized spots of the channel walls. Then, in step 3, the Sync solution passes through the Sync channel and merges with the four different sample solutions; see the first bottom panel of step 3. This merging process triggers the synchronized parallel motion of the sample solutions into their assigned detection channels. Note that the blocking solution also moves toward the detection channels, but it does not enter the detection channels; see the second bottom panel of step 3. In addition, the auxiliary channels (defined in Figure 1a) generate flow barriers in assay step 3 to prevent the entry of the blocking solution into the detection channels.24 Finally, the dAb and washing solutions sequentially move into the detection channels. In these two steps, the local motions of the solutions in the timing channels toward the detection channels happen. As shown in the second bottom panels of steps 4 and 5, the nontarget solutions do not move into the main channels. The detailed sequence is also shown in the Supporting Information text and movie. For this sequential and parallel motion of multisolutions, the control of their flow timing and direction is crucial and successfully demonstrated.
METHODS
Device Fabrication
The device is composed of a top and a bottom layer. The top layer was fabricated in PDMS by soft lithography and has 60 μm height microfluidic channels. The bottom layer was made of hydrophilically surface-treated Si. A Si wafer was deposited with hydrophilic SiO2 by low-pressure vapor chemical deposition, and then a 400:1 (v/v) mixture of xylene and hexamethyldisilazane (HMDS) was spin-coated on the SiO2 surface.24 This coating was used to control the bottom layer’s surface property so that its originally highly hydrophilic surface becomes less hydrophilic, thus effectively regulating the meniscus flow speed. The top and the bottom layers were reversibly bonded by mild pressure without plasma treatment. Immunoassay experiments were performed right after the bonding.
Experimental Conditions and Materials
When we used a normal pipet for the solution dispensing, air bubbles formed in droplets at inlet wells. To prevent this problem, we used a positive displacement pipet (Microman M10, Gilson). Also, because evaporation of the solutions in inlet wells significantly changes inlet pressures, we used an approach to prevent the evaporation: we put the device in a Petri dish partially filled with water and sealed it with a glass cover; we opened the cover only when solutions were dispensed. According to Berthier et al., this type of experimental setup results in a humidity level >85% inside the Petri dish within 1 min after sealing the Petri dish.25 The meniscus volume in the inlet well significantly affects the device operation, because the volume determines the inlet well pressures and thus the flow directions. To load a meniscus of consistent volume in the inlet well, we first measured the depth of each well for the fabricated devices and then adjusted the dispensed droplet volume. Thus, we could maintain the meniscus volume of inlet well at a designed value. For the CRP assay, we used human CRP (ProSpec), and 6.7 μM cAb and 600 nM FITC-labeled detection antibody (Bethyl Laboratory). For the ST2 assay, we used 720 μg/mL capture antibody and human ST2 from ST2 ELISA kit (R&D Systems) and 10 μg/mL FITC-labeled detection antibody (MBL).
RESULTS AND DISCUSSION
Flow Timing Control
The flow timing of each solution’s transport to detection channels was determined by its loading interval time to inlet wells and its meniscus flow speed in the channels. As described above, we loaded, with a pipet, each solution into its inlet well with 1 min interval but the last washing solution with a 5 min interval. Each interval was designed to give sufficient time to change pipet tips and to load solutions. Once each solution was pipet into its inlet well, microfluidic channels passively regulated its meniscus flow speed.
Notably, the passive flow-speed control was enabled by the channel width: narrowing the channel width slowed down the meniscus flow speed. This was attributed to the heterogeneous channel surfaces having hydrophilic bottom and hydrophobic top and sides, which made the net channel surface property more hydrophobic with decreasing channel widths. A meniscus flow speed of 1% BSA solution in a 400 μm wide channel was ~3 mm/s, whereas that in a 90 μm wide channel was <0.7 mm/min with flow-speed variation of <12% (n = 10). Thus, the 90 μm wide channel effectively delayed the meniscus motion. The 90 μm wide channel significantly influenced flow timings of the immunoassay solutions. Thus, we call these types of channels timing channels. A solution meniscus would rapidly move in other channels having widths of >160 μm.
The flow timings of the solutions, however, could change even within the same timing channel if multiple solutions have variations in their fluidic property (e.g., contact angle). The solutions passing through the timing channels in steps 2–5 of Figure 2a were the blocking, Sync, dAb, and washing solutions, respectively. These solutions had similar contact angles on the bottom layer of the device (24–26°) because their compositions were dominated by the 1% BSA contained in all solutions. Thus, we could effectively regulate the delay time of the timing channels by simply adjusting the channels’ length. On the other hand, in step 3 sample solutions such as human plasma have different contact angles, owing to their heterogeneity; their contact angles on the bottom layer were measured to be 21–29° (n = 5). To simultaneously control the flow timing of four sample solutions, we used a method depicted in the step 3 of Figure 2a. First, the Sync solution consisting of 1% BSA passes the timing channel with a preprogrammed delay time and then moves into the Sync channel. The Sync channel consists of dually bifurcated and 400 μm wide channels (defined in Figure 1b), so the BSA meniscus rapidly moves in the channels and splits into four menisci. Then, the four BSA menisci synchronously merge with their corresponding sample solutions that had halted at the capillary stop valves (section i of Figure 1c). This merging triggers the motion of the sample solutions into the detection channels in synchrony. Thus, controlling the flow timing of the Sync solution permits control of the flow timing of the sample solutions indirectly, regardless of the contact angle differences between the sample solutions. In this way, we controlled the flow timings of all solutions.
Flow Direction Control
In addition to flow timing control, we also need to ensure that the target solution of each step moves into the detection channels. When the meniscus pressure of the inlet wells is different, the flow of the merged solutions in each step is directed toward a well with the lowest pressure. The conditions below made the initial pressure of the cAb wells the lowest in each step: the initial well pressures of the cAb, sample, and other solutions were 15, 78, and ~100 Pa, respectively, by the pipetting of 4.7 μL of cAb, 1.4 μL of the sample, and 2.2 μL of other solutions into their assigned wells. Also, the diameter of the cAb wells is larger than those of the other wells (4 vs 2 mm). Thus, the merged solutions move into the cAb wells through the detection channels.
During the motion of the target solution to the detection channels, we also need to prevent the other nontarget solutions from flowing into the detection channels. The task becomes more difficult with the increasing step number, where a larger number of wells become connected to each other via the filled timing channels. This connection can possibly result in unwanted flow of the nontarget solutions toward the detection channel. We prevented the unwanted flow through carefully designing the channel geometries and dimensions based on theoretical modeling (see Supporting Information Figure S1 for more details). Consequently, only the target solution moved into the detection channels in each step as the assay progressed.
To quantify the level of the target solution filling in the detection channels, we employed a parameter named the “target solution-to-channel volume ratio”, ΔVa(n)/V(n), where V(n) is the volume of the black-color channel region that is defined in each inset of Figure 3a panels in step n (n = 2, 3, 4, 5), and ΔVa(n) is the volume of the target solution accumulated in the black-color channel over time by capillary motion in step n. At ΔVa(n)/V(n) = 1, the target solutions reached the end of the four detection channels in step n. Then, at ΔVa(n)/V(n) > ~1.2 it was observed that the target solution completely washed away the preceding solution from step n – 1 that stayed in the detection channels by Taylor dispersion. As the assay progressed, the increase of ΔVa(n)/V(n) slowed down but continued until the well pressures affecting the flow motion reached equilibrium in each step. Meanwhile, each target solution was incubated in the detection channels and the convective flow expedited the conjugation between molecules. The incubation time of assay solutions in each step is shown in Figure 3b.
Figure 3.

Sequential incubation of target molecules by fluidic motion. (a) Target solution-to-channel volume ratio as a function of time. The lines and circles represent theoretical and experimental values, respectively. The volume ratio of 1 means the target solution reaches the ends of the detection channels. Target molecules sequentially conjugate and are incubated while the solutions move. (b) Incubation time of target solutions (n = 10) of each assay step.
Immunoassay with Capillarity
The approach described above could be generally used for any sandwich immunoassays. We specifically applied our method to immunoassays of CRP and ST2. CRP is used as a biomarker for cardiovascular disease and inflammation, and ST2 is a biomarker for graft-versus-host disease (GVHD) as well as cardiac disease.26–28 Figure 4a shows the fluorescent image of CRP immunoassay, which clearly demonstrates that CRP was confined in the assigned detection channels (i.e., no flow crosstalk). Also, the fluorescent intensities in the two detection channels were uniform throughout the regions, with the use of the same CRP concentration (8.8 nM). Note that the intensities in the two auxiliary channels were different because these channels nonuniformly received the blocking solution, as opposed to the detection channels. Similarly, the use of the same CRP concentration for four sample wells resulted in uniform fluorescent intensities across the four detection channels (Figure 4b). We loaded four different concentrations of CRP onto the four sample wells of the device and found no crosstalk between the four detection channels. We repeated the same assay for four different device chips and obtained good signal consistency between these chips (Figure 4c). The calibration curve of human CRP is shown in Figure 4d. The limit of detection (LOD) was 8 pM, which is defined as 3 times the standard deviation above the mean noise level of blank solution (1% BSA). The LOD of our method is similar to that of the conventional ELISA, which used much longer assay time (several hours).29
Figure 4.
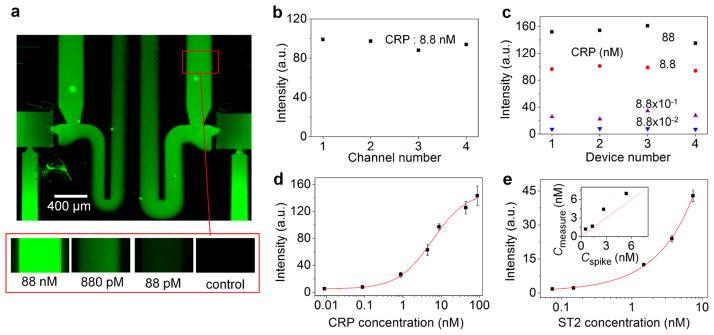
Detection of CRP and ST2 biomarkers. (a) Fluorescent micrographs showing detection of CRP biomarkers. The top image shows no fluorescence signal at the downstream of the detection channel, thus verifying no crosstalk of CRP biomarkers between the different detection channels. (b) Channel-to-channel signal intensity uniformity. (c) Signal consistency across four device chips. (d) Calibration curve for CRP (n > 3 for each point). (e) Calibration curve for ST2 (n > 3 for each point). The inset shows good agreement between ST2 concentration values experimentally measured by our assay (Cmeasure) and originally known values (Cspike), both for identical ST2-spiked human plasma samples. The experimental values were converted from fluorescence signal intensities based on the calibration curve.
Despite the relatively short incubation time in each step (on the order of 1 min, Figure 3b), sufficiently good sensitivity was achieved. We attribute this result to the conjugation of target molecules, promoted by the convective flows that continuously supplied the molecules onto the surface of the detection channel walls. This argument is supported by a previous study by Delamarche group, where the researchers showed that flow duration of 3 min was sufficient to capture ~80% of the maximum capturable amount of 800 pM CRP.30 The Ahn group also reported a similar result for IL-4.7
With the calibration curve of ST2 at an LOD of 90 pM (Figure 4e), we performed quantitative capillarity-driven parallel immunoassay for human plasma using our microfluidic device; the LOD of ST2 that is worse than that of CRP could be attributed to the weaker binding affinity of the ST2 molecules. To validate our assay method, we first spiked ST2-free (<500 pM) healthy donor’s plasma samples with recombinant human ST2 of various known concentrations. We subsequently detected the fluorescence signals from the plasma samples and determined their ST2 concentrations from the calibration curve. The inset of Figure 4e shows that the measured ST2 concentrations are in good agreement with the original concentrations that we applied to the plasma samples of healthy donors.
In general, our scheme of capillarity control leads to practical benefits. In conventional microwell plate immunoassays such as ELISA,2 additional washing steps are necessary. This is because the first solution itself cannot wash the next solution to facilitate the conjugation between two molecules, thereby requiring a large total number of pipetting steps for washing for the entire assay process. In contrast, our device eliminated the washing process between each step with a preceding solution being completely washed away by a subsequent solution through microfluidic channels (see channel color change in the Supporting Information movie). Furthermore, reagent solutions were shared in the detection channels without fluidic crosstalk, thus saving more pipetting steps compared to microwell plates. These two features (no additional washing steps and solution sharing) greatly decreased the number of the necessary pipetting steps. In the microwell plate method for four samples, which requires two washings in each step, 48 pipettings would be necessary, whereas our device required only 10 pipetting steps. Equally important, in a manual ELISA, users need to wait several hours between each step to dispense solutions because the conjugation between molecules is diffusion-limited. Our method requires no user waiting time for each incubation step owing to the timing channels. This makes an unmanned assay operation possible once the user finishes the initial sequential solution loading process. Also, each incubation time is relatively short owing to small diffusion lengths and convective flows. The reduced assay time would significantly facilitate timely disease screening.
CONCLUSIONS
We demonstrated the unprecedented capability of capillarity-driven microfluidic flow control for passive, parallel immunoassays. Our device was utilized for the biomarker detection of CRP and ST2. After manually pipetting solutions to our device with predetermined time intervals, capillarity alone enabled fully passive immunoassay using multiple reagents and samples in a sequential and parallel manner, with no use of autonomous external controllers. This scheme also provided a more efficient platform compared to manual multiwell plates by saving users’ labor and time. Through integration of a larger number of sample wells, the device would enable more massively parallel immunoassays, while achieving rapid analysis through convection-enhanced conjugation of target molecules and saving large amounts of precious samples and reagents. Our fully passive on-chip immunoassay method promises to provide a new approach to global health diagnostics under limited resources.
Supplementary Material
Acknowledgments
This work was supported by the National Science Foundation under Grants CBET-0966723 and ECCS-0601237, the National Institutes of Health under Grant R01-CA-142750-01, and the Coulter Foundation. We thank Y. J. Park for measuring PDMS thickness. Devices were partially fabricated in the Lurie Nanofabrication Facility.
Footnotes
Notes
The authors declare no competing financial interest.
Theoretical motion of the nontarget solutions and movie that shows the flow sequence. This material is available free of charge via the Internet at http://pubs.acs.org.
References
- 1.Wild D. The Immunoassay Handbook. Elsevier; Amsterdam, The Netherlands: 2005. [Google Scholar]
- 2.Lequin RM. Clin Chem. 2005;51:2415–2418. doi: 10.1373/clinchem.2005.051532. [DOI] [PubMed] [Google Scholar]
- 3.Akanda MR, Aziz MA, Jo K, Tamilavan V, Hyun MH, Kim S, Yang H. Anal Chem. 2011;83:3926–3933. doi: 10.1021/ac200447b. [DOI] [PubMed] [Google Scholar]
- 4.Akanda MR, Choe YL, Yang H. Anal Chem. 2012;84:1049–1055. doi: 10.1021/ac202638y. [DOI] [PubMed] [Google Scholar]
- 5.Cho SK, Moon H, Kim CJ. J Microelectromech Syst. 2003;12:70–80. [Google Scholar]
- 6.Abdelgawad M, Wheeler AR. Adv Mater. 2009;21:920–925. [Google Scholar]
- 7.Kai J, Puntambekar A, Santiago N, Lee SH, Sehy DW, Moore V, Han J, Ahn C. Lab Chip. 2012;12:4257–4262. doi: 10.1039/c2lc40585g. [DOI] [PubMed] [Google Scholar]
- 8.Gervais L, Delamarche E. Lab Chip. 2009;9:3330–3337. doi: 10.1039/b906523g. [DOI] [PubMed] [Google Scholar]
- 9.Martinez AW, Phillips ST, Whitesides GM, Carrilho E. Anal Chem. 2010;82:3–10. doi: 10.1021/ac9013989. [DOI] [PubMed] [Google Scholar]
- 10.Lutz BR, Trinh P, Ball C, Fu E, Yager P. Lab Chip. 2011;11:4274–4278. doi: 10.1039/c1lc20758j. [DOI] [PMC free article] [PubMed] [Google Scholar]
- 11.Chen H, Cogswell J, Anagnostopoulos C, Faghri M. Lab Chip. 2012;12:2909–2913. doi: 10.1039/c2lc20970e. [DOI] [PubMed] [Google Scholar]
- 12.Kim SJ, Lim YT, Yang H, Shin YB, Kim K, Lee DS, Park SH, Kim YT. Anal Chem. 2005;77:6494–6499. doi: 10.1021/ac0504417. [DOI] [PubMed] [Google Scholar]
- 13.Fu E, Liang T, Spicar-Mihalic P, Houghtaling J, Ramachandran S, Yager P. Anal Chem. 2012;84:4574–4579. doi: 10.1021/ac300689s. [DOI] [PMC free article] [PubMed] [Google Scholar]
- 14.Kim SJ, Lim YT, Yang H, Kim K, Kim YT. Electrophoresis. 2010;31:709–713. doi: 10.1002/elps.200900551. [DOI] [PubMed] [Google Scholar]
- 15.Novo P, Volpetti F, Chu V, Conde JP. Lab Chip. 2013;13:641–645. doi: 10.1039/c2lc41083d. [DOI] [PubMed] [Google Scholar]
- 16.Delaney JL, Hogan CF, Tian J, Shen W. Anal Chem. 2011;83:1300–1306. doi: 10.1021/ac102392t. [DOI] [PubMed] [Google Scholar]
- 17.Lu Y, Shi W, Qin J, Lin B. Anal Chem. 2010;82:329–335. doi: 10.1021/ac9020193. [DOI] [PubMed] [Google Scholar]
- 18.Dungchai W, Chailapakul O, Henry CS. Anal Chem. 2009;81:5821–5826. doi: 10.1021/ac9007573. [DOI] [PubMed] [Google Scholar]
- 19.Vella SJ, Beattie P, Cademartiri R, Laromaine A, Martinez AW, Phillips ST, Mirica KA, Whitesides GM. Anal Chem. 2012;84:2883–2891. doi: 10.1021/ac203434x. [DOI] [PMC free article] [PubMed] [Google Scholar]
- 20.Jokerst JC, Adkins JA, Bisha B, Mentele MM, Goodridge LD, Henry CS. Anal Chem. 2012;84:2900–2907. doi: 10.1021/ac203466y. [DOI] [PubMed] [Google Scholar]
- 21.Lewis GG, DiTucci MJ, Baker MS, Phillips ST. Lab Chip. 2012;12:2630–2633. doi: 10.1039/c2lc40331e. [DOI] [PubMed] [Google Scholar]
- 22.Hossain SMZ, Brennan JD. Anal Chem. 2011;83:8772–8778. doi: 10.1021/ac202290d. [DOI] [PubMed] [Google Scholar]
- 23.Mentele MM, Cunningham J, Koehler K, Volckens J, Henry CS. Anal Chem. 2012;84:4474–4480. doi: 10.1021/ac300309c. [DOI] [PubMed] [Google Scholar]
- 24.Kim S-J, Paczesny S, Takayama S, Kurabayash K. Lab Chip. 2013;13:2091–2098. doi: 10.1039/c3lc50187f. [DOI] [PMC free article] [PubMed] [Google Scholar]
- 25.Berthier E, Warrick J, Yu H, Beebe DJ. Lab Chip. 2008;8:852–859. doi: 10.1039/b717422e. [DOI] [PMC free article] [PubMed] [Google Scholar]
- 26.Clearfield MB. J Am Osteopath Assoc. 2005;105:409–416. [PubMed] [Google Scholar]
- 27.Bhardwaj A, Januzzi J. Expert Rev Mol Diagn. 2010;10:459–464. doi: 10.1586/erm.10.25. [DOI] [PubMed] [Google Scholar]
- 28.Lugt MV, Braun T, Ferrara J, Hanash S, Levine J, Harris A, Couriel D, Paczesny S. J Immunol. 2012;188:126–13. [Google Scholar]
- 29.Park J, Sunkara V, Kim T, Hwang H, Cho Y. Anal Chem. 2012;84:2133–2140. doi: 10.1021/ac203163u. [DOI] [PubMed] [Google Scholar]
- 30.Wolf M, Juncker D, Michel B, Hunziker P, Delamarche E. Biosens Bioelectron. 2004;19:1193–1202. doi: 10.1016/j.bios.2003.11.003. [DOI] [PubMed] [Google Scholar]
Associated Data
This section collects any data citations, data availability statements, or supplementary materials included in this article.