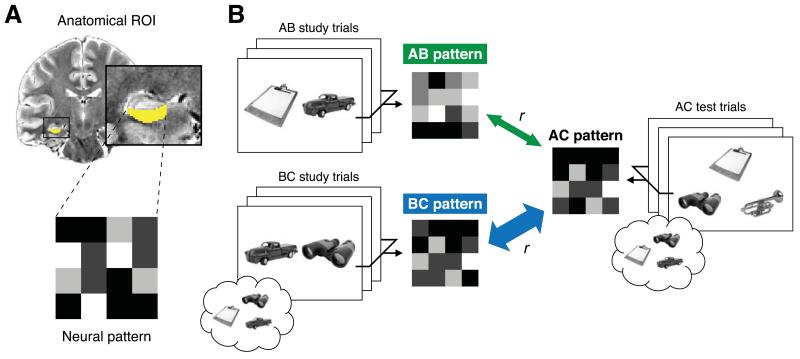
Figure 2.
Schematic depiction and rationale of neural pattern similarity analysis (NPSA). (a) Average patterns of activation associated with specific trial types were extracted for each anatomical ROI. Here we depict the cross-participant analysis (see Neural pattern similarity analysis section of Materials and Methods), which was estimated irrespective of memory performance. Trials were modeled according to event type (AB, BC for study phase; AC for test phase) using a GLM. Parameter estimates associated with conditions of interest were then extracted for each voxel within the ROI (example ROI shown in yellow). The intensity in each cell in the grayscale matrix schematic represents the parameter estimate for a single voxel in the brain. The similarity of two patterns was then determined by computing a Pearson correlation between the two matrices. (b) Predictions for NPSA when existing memories are retrieved and linked to current experience during overlapping event encoding. Example AB study, BC study, and inference test screens are shown; simplified hypothetical mean patterns of activation associated with each trial type are depicted next to the corresponding condition. As BC study trials provide a unique opportunity to link prior memories with current experience, we predicted greater reinstatement of BC than AB study patterns during AC inference judgments. Reinstatement of study patterns evoked during overlapping event encoding would be reflected by a higher correlation between BC-AC study-test (thick blue arrow) than between AB-AC study-test (thin green arrow).

