

Abstract
The chromatin-associated proteome (chromatome) regulates cellular gene expression by restricting access of transcriptional machinery to template DNA, and dynamic re-modeling of chromatin structure is required to regulate critical cell functions including growth and replication, DNA repair and recombination, and oncogenic transformation in progression to cancer. Central to the control of these processes is efficient regulation of the host cell cycle, which is maintained by rapid changes in chromatin conformation during normal cycle progression. A global overview of chromatin protein organization is therefore essential to fully understand cell cycle regulation, but the influence of the chromatome and chromatin binding topology on host cell cycle progression remains poorly defined. Here we used partial MNase digestion together with iTRAQ-based high-throughput quantitative proteomics to quantify chromatin-associated proteins during interphase progression. We identified a total of 481 proteins with high confidence that were involved in chromatin-dependent events including transcriptional regulation, chromatin re-organization, and DNA replication and repair, whereas the quantitative data revealed the temporal interactions of these proteins with chromatin during interphase progression. When combined with biochemical and functional assays, these data revealed a strikingly dynamic association of protein HP1BP3 with the chromatin complex during different stages of interphase, and uncovered a novel regulatory role for this molecule in transcriptional regulation. We report that HP1BP3 protein maintains heterochromatin integrity during G1–S progression and regulates the duration of G1 phase to critically influence cell proliferative capacity.
The eukaryotic cell cycle consists of two major consecutive events: duplication of the genome by DNA synthesis and distribution of the duplicated genome into daughter cells via mitosis. Between mitotic cycles, the cells enter an intermediate state known as interphase, which consists of a DNA synthesis step (S phase) flanked by periods of relative inactivity (gaps G1 and G2), during which the cells prepare to undergo mitosis. Numerous chromatin-dependent genetic events occur during interphase, those are required to regulate cell cycle progression, and successful completion of these events requires transient access to the DNA template. However, the influence of these dynamic changes in chromatin protein conformation on cell cycle progression remains poorly understood.
Rapid access to the DNA template during interphase is achieved by maintaining chromatin in a highly dynamic state (1, 2), and is required for the efficient transmission of genetic and epigenetic information into daughter cells via careful regulation of the host cell cycle (3, 4). Epigenetic modifications are critical mediators of host cell differentiation, which plays an important role in developmental biology (5) as well as in many of the un-programmed cellular events that drive pathological changes in cancer (6–8). Transmission of epigenetic information from mother cell to daughter cells (epigenetic inheritance) is mediated via DNA and histone modifications, histone variants, non-histone chromatin proteins, nuclear RNA, and changes in higher-order chromatin structure (9–13). During interphase, chromatin is structured in two distinct forms; euchromatin (loosely compacted active regions) and heterochromatin (highly compacted silent regions) that are continuously interchanged according to requirements for access to the DNA template. Euchromatin is essential for gene transcription and normal cell function between replicative cycles (14–17), whereas heterochromatin is vital to prevent aberrant DNA access that could disrupt the cell cycle and impede genome transfer into progeny cells (18–22). Accordingly, imbalance in the chromatin structure-dependent regulatory system de-regulates the cell cycle and promotes carcinogenesis (23, 24).
Chromatin conformation is regulated by protein-DNA and protein-protein interactions that are influenced by structural modification of the component histones (25) and DNA sequences (26–28). However, the contribution of non-histone proteins to control chromatin biology is poorly understood. Recent data indicate that non-histone proteins including RNA polymerase III, topoisomerase II α, heterochromatin protein 1, and high-mobility group nucleosome-binding proteins (HMGNs) critically influence chromatin structural dynamics (29–33), but current data are insufficient to fully establish the role played by chromatin-associated proteins in the control of the host cell cycle. Data describing the chromatin-associated proteome (chromatome) during cell division have been reported for C. Elegans (34), yeast (35), and human cells (36), whereas other investigators have carried out proteomic analyses of the DNA damage response complex (37) and post-meiotic genome in mice (38). However, detailed profiling of chromatome dynamics during cell cycle progression has not previously been conducted.
In the current report, we extracted chromatin from cells synchronized in different stages of interphase and used partial MNase digestion together with an iTRAQ-based quantitative proteomic approach to delineate chromatome components and topology during normal cell cycle progression. We provide valuable new data on the dynamics of chromatin re-modeling during cell cycle progression that may help to clarify how disruption of chromatome configuration promotes pathological changes in diseases such as cancer. We further report that novel chromatin protein HP1BP3 maintains heterochromatin integrity during G1–S progression in order to regulate the duration of G1 phase and thereby control cell proliferation. Our approach of constructing a global picture of chromatin-associated protein dynamics during interphase progression may allow future studies to better determine the influence of chromatin biology on other cellular processes and disease pathogenesis.
MATERIALS AND METHODS
Reagents
All reagents were purchased from Sigma-Aldrich unless otherwise indicated (Sigma-Aldrich, WI). Antibodies against α-tubulin (sc-5286), GAPDH (sc-32233), Ku-70 (sc-17789), and Ku-80 (sc-5280) were from Santa Cruz Biotechnology, Santa Cruz, CA. Anti-histone H2A (ab13923), histone H4 (ab10158), and HP1BP3 (ab98894) antibodies were purchased from Abcam, UK. The anti-actin antibody (MAB1501) was purchased from Millipore, USA. Mono-methyl histone H3 (Lys4) (D1A9) XP (5326P) and Di-methyl histone H3 (Lys4) (C64G9) Rabbit mAb (#9725P) were procured from Cell Signaling Technology, Danvers, MA.
EXPERIMENTAL METHODOLOGIES
Cell Culture and Synchronization
The 293F cells (Invitrogen, Carlsbad, CA) were cultured and maintained in Free-Style 293 Expression medium (GIBCOTM, Invitrogen, USA) according to the protocol provided. 293F cells were easily cultured in bulk quantity in a single flask, which could reduce experimental variation. Viable cells (3 × 10⁵/ml) were seeded into sterile 125 ml vented PETG flasks (NALGENE) and incubated at 37 °C in a shaking incubator with 5% CO2 at 120rpm. Cells were synchronized in G1/S phase by double thymidine treatment (exposure to 2.5 mm thymidine for 18h, release from block for 8h, then a second exposure to 2.5 mm thymidine for 18 h). G2/M phase synchronization was achieved by treating the cells with 2.5 mm thymidine for 24 h and then 3 h release prior to addition of 200 ng/ml nocodazole for 16h. G0/G1 synchronization was achieved by releasing cells for 6h after the G2/M blocking step. Synchronization experiment was performed in a triplicate. Cells form all three replicates pooled together and used for the subsequent chromatin extraction.
Flow-cytometry Analysis
Viable cells (2 × 10⁶) were washed with ice cold PBS and fixed with −20 °C ethanol. The fixed cells were then stained with propidium iodide (0.5 mg/ml) for 15min at 37 °C. Cellular DNA content was measured by flow cytometer (BD FACSCalibur™, BD Biosciences, USA) and analyzed using CELLQUEST software (BD FACSCalibur™, BD Biosciences, USA).
Chromatin Isolation and Digestion
Chromatin isolation was performed according to the method published by Dutta et al. (39) with minor modification. Briefly, 7 × 10⁷ cells were suspended in nuclei extraction buffer A (10 mm HEPES pH 7.5, 10 mm KCl, 1 mm MgCl2, 0.34 m sucrose, 0.1% triton X-100, 1 mm DTT, and protease inhibitor mixture from Roche Diagnostics, Mannheim, Germany) and were kept on ice for 30min prior to pestle homogenization. The homogenate was centrifuged at 2000 × g for 3min at 4 °C and the supernatant discarded. The cell pellet was then re-suspended in nuclei extraction buffer B (10 mm HEPES pH 7.5, 10 mm KCl, 1.5 mm MgCl2, 0.34 m sucrose, 0.1% Nonidet P-40, 1 mm DTT, and protease inhibitor mixture) and then pestle homogenized for a second time. The homogenate was loaded onto a 2.1 m sucrose gradient (10 mm HEPES pH 7.5, 10 mm KCl, 1.5 mm MgCl2, 2.1 m sucrose, 1 mm DTT, and protease inhibitor mixture) prior to ultra-centrifugation at 150,000 × g for 3h at 4 °C using a SW41 rotor with the Optima™ l-100XP Ultra apparatus (Beckman Coulter, USA). After ultracentrifugation, the supernatant was removed and the chromatin pellet collected from bottom of the tube. The chromatin pellet was washed with wash buffer (10 mm HEPES pH 7.5, 1 mm DTT, and protease inhibitor mixture) and collected by centrifugation at 20,000 × g for 45min at 4 °C. The purified chromatin pellet was then suspended in 50 μl MNase digestion buffer (10 mm HEPES pH 7.5, 2.5 mm CaCl2, and 2.5 mm MgCl2) before 20U MNase was added and the digestion mixture incubated for 60min at 37 °C in a water bath with occasional vortexing. Addition of 1 mm EDTA was used to stop the digestion before the supernatant fraction (fraction S) was collected by centrifugation at 20,000 × g at 4 °C for 30min. The remaining undigested pellet (fraction P) was dissolved in 2% SDS solution. The protein contents of the supernatant and pellet fractions were subsequently measured using 2-D Quant Kits (Amersham Biosciences, USA).
In-gel Protein Digestion and iTRAQ Labeling
A total mass of 75 μg protein from each sample was loaded into 12.5% SDS-PAGE gels for electrophoresis at 80V for 15min. Each sample lane was cut into small pieces and washed with 25 mm triethylammonium bicarbonate (TEAB) in 75% ACN. The gel pieces were then dehydrated with 100% ACN and vacuum dried. Reduction was carried out using 5 mm Tris 2-carboxyethyl phosphine hydrochloride (TCEP) in 25 mm TEAB buffer at 60 °C for 30min, followed by alkylation with 10 mm methyl methanethiosulfonate (MMTS) in 25 mm TEAB buffer at room temperature for 45min. TCEP and MMTS were removed by performing alternate washes with 25 mm TEAB buffer and 25 mm TEAB in 75% ACN. The gel pieces were then dehydrated and dried for a second time. Sequencing-grade modified trypsin solution (Promega Corporation, Madison, WI) in 25 mm TEAB (10 ng/ml) was used for overnight digestion at 37 °C. Tryptic peptides were extracted using 50% ACN and 5% acetic acid before being dried via vacuum centrifugation (Eppendorf). Labeling was performed using iTRAQ reagent multiplex kits according to the manufacturer's protocol (Applied Biosystems, Foster City, CA). Supernatant fractions G1-S, G1/S-S, and G2/M-S and pellet fractions G1-P, G1/S-P, and G2/M-P were labeled with 113, 114, 115, 117, 118, and 119 isobars accordingly. The iTRAQ-labeled peptides were pooled together and desalted using Sep-Pak C18 Vac cartridges (Waters, Milford, MA) before being vacuum-centrifuged to dryness.
Electrostatic Repulsion-hydrophilic Interaction Chromatography (ERLIC) Fractionation
iTRAQ-labeled peptides were fractionated by ERLIC as described by Hao et al. (40) with minor modifications. Briefly, labeled peptides were reconstituted in 200 μl sample loading buffer (10 mm ammonium acetate in 85% ACN and 1% Formic acid) and fractionated using PolyWAX LP™ 20 columns (4.6 × 200 mm, 5 μm particle size, 300Å pore size) (PolyLC, Columbia, MD, USA) on a HPLC unit (Prominence™, Shimadzu, Kyoto, Japan) at flow rate of 1 ml/min. The HPLC gradient comprised 100% buffer A (85% ACN and 0.1% acetic acid) for 5min; 0–28% buffer B (30% ACN and 0.1% formic acid) for 40min; then 28%-100% buffer B for 5min, followed by 100% buffer B for 10min. The chromatograms were recorded at 260 nm. A total of 52 fractions were collected within the 60min time period. The collected fractions were combined into 28 fractions according to their chromatogram and then concentrated to dryness using vacuum centrifugation.
LC-MS/MS Analysis
The ERLIC-fractionated, iTRAQ-labeled peptides were reconstituted in HPLC-grade water containing 0.1% formic acid for LC-MS/MS analysis. The mass spectroscopy analysis was performed using a Q-STAR Elite mass spectrometer coupled with online nano-flow HPLC system (Applied Biosystems; MDS-Sciex, Foster City, CA). The peptides were separated using nano-bored C18 columns with a picofrit nanospray tip (75 μm ID × 15 cm, 5 μm particles) (New Objectives, Wubrun, MA).The flow-rate was maintained at 300 nl/min throughout and all LC-MS analysis was performed in triplicate. All MS data were acquired in positive ion mode with a mass range of 300–2000 m/z. Peptides with charge of +2 to +4 were selected for MS/MS. The top three most abundant peptide ions above a five count threshold were selected for MS/MS and dynamically excluded for 30s with 30mDa mass tolerance. Smart information-dependent acquisition (IDA) was activated with automatic collision energy and automatic MS/MS accumulation. The fragment intensity multiplier was set at 20 and maximum accumulation time was set at 2 s. The peak areas of the iTRAQ reporter ions reflected the relative abundance of the proteins in the samples.
Mass Spectrometry Data Analysis
Data acquisition was performed using Analyst QS 2.0 software (Applied Biosystems/MDS SCIEX). The identification and quantification of proteins was performed using Protein Pilot 3 Software (Applied Biosystems). The Paragon algorithm in the Protein Pilot software was used for the peptide identification, and further processing was conducted by ProGroup algorithm (with isoform-specific quantification). The defined parameters were as follows: (1) Sample Type, iTRAQ 8-plex (Peptide Labeled); (2) Cysteine alkylation, MMTS; (3) Digestion, Trypsin; (4) Instrument, QSTAR Elite ESI; (5) Special factors, None; (6) Species, None; (7) Specify Processing, Quantities; (8) ID Focus, biological modifications, amino acid substitutions; (9) Database, The UniProt Knowledgebase (UniProtKB) human protein database (downloaded on 12 March 2010, 95,624 sequences and 36,307,192 residues) and its reversed complement were combined and used for the searches, and the corresponding reverse sequence was used for false discovery rate (FDR) estimation; and (10) Search effort, thorough. The search parameters set as a default were: (1) mass tolerance of 0.2Da for both precursor and fragment mass; and (2) maximum considerable missed and/or nonspecific cleavages number is 2. The peptide for quantification was automatically selected by ProGroup algorithm with criteria: (1) the peptide was usable for quantitation, that is, the iTRAQ reporter area is not zero; (2) the peptide was identified with good confidence; and (3) the peptide was not shared with another protein identified with higher confidence to calculate the reporter peak area, error factor (EF) and p value. Protein pilot calculate the p value based upon degrees of freedom for the average ratio and t value [t = (Weighted Average of Log Ratios- Log Bias) ÷ Standard Error of the Weighted Average of Log Ratios]. The p value evaluated the result based on the certainty of the change, not by the magnitude of the change. The resulting data set was automatically bias-corrected to eliminate variation because of potential unequal mixing while combining the different samples. We used Protein knowledgebase (UniProtKB) database for classification and functional annotation of enlisted proteins. We combined the iTRAQ ratios of matching pellet and supernatant fractions were used to determine their overall chromatin association. Online Gene Pattern software (http://genepattern.broadinstitute.org) was used for cluster analysis. Hierarchical clustering and Pearson correlation methods were applied for the clustering.
Western Blot Analysis
Cell lysates were prepared by dissolving frozen cells via sonication in lysis buffer (1% SDS in 10 mm tris-HCl pH 7.4) and protein concentration was measured using the Bradford method. For whole chromatin samples, chromatin extracts were sonicated and dissolved in 2.5% SDS in 10 mm tris-HCl (pH 7.4) and sample protein content was measured using 2-D Quant Kits. Equal amounts of protein from each sample were used for Western blot analysis. Protein samples were resolved on 10% SDS-PAGE gels and transferred onto nitrocellulose membranes. Immunoblotting was performed using antiprotein antibodies together with the ECL system for detection (Invitrogen).
HP1BP3 Knock-down
HP1BP3 inhibition was achieved by shRNA-mediated knockdown using the Thermo Scientific Open Biosystems RNA intro GIPZ Lentiviral shRNAmir Starter Kit. (Catalogue #: RHS4287). All pGIPZ clones were grown at 37 °C in 100 μg/ml ampicillin containing 2X LB broth (low salt) media. Plasmids were extracted using plasmid extraction kits (Axygen, USA) and cell transfection with GIPZ Lentiviral shRNAmir (either non-silencing or HP1BP3-specific) was performed using TurboFect Transfection Reagent (Thermo Scientific) according to the manufacturer's protocol. A total of 4 μg GIPZ Lentiviral shRNAmir DNA and 6 μl TurboFectin reagent was used for each transfection. Transfected cells were incubated in DMEM supplemented with 10% FBS at 37 °C with 5% CO2 for 48 h, and transgene expression was determined by detection of GFP expression. After 48 h, the transfected cells were trypsinized and re-suspended in DMEM containing 2 μg/ml puromycin and 10% FBS for selection of stable transfectants. Cells were cultured in puromycin-containing medium for 15 days thereafter and the medium was occasionally refreshed as required. After 15d, each colony was cultured separately and the efficiency of HP1BP3 knock-down was determined by Western blot using an anti-HP1BP3 antibody. The colony that exhibited the most efficient HP1BP3 inhibition was then used as a cell source for all subsequent experiments.
Chromatin Compaction Measurement
Cellular chromatin was extracted according to the above protocol and then suspended in MNase digestion buffer (50 mm tris-Cl pH 7.9; 5 mm CaCl2). Chromatin suspensions were then divided into three equal volumes and increasing quantities of MNase were added to each (0, 5, and 10 U). Digestion was performed at 37 °C for 10 min and the reaction was terminated by addition of an equal volume of 2X TNESK solution (20 mm tris-Cl pH 7.4; 200 mm NaCl; 2 mm EDTA; 1% SDS; and 0.2 mg/ml protein kinase K) with overnight incubation at 37 °C. DNA fragments were extracted using Phenol-chloroform and DNA content was measured by NanoDrop 2000 UV-Vis Spectrophotometer (Thermo Fisher Scientific). Equal amounts of DNA from each sample were then loaded and resolved on 1% agarose gels for analysis.
Quantitative Proteomic Profiling of HP1BP3-depleted Cells
Quantitative proteomic profiling was performed using iTRAQ technology. All three biological replicates were pooled and the cells lysed by sonication. Equal amounts of lysate from mock- and HP1BP3-depleted cells were digested and labeled with 114 and 115 isobars of 4-plex iTRAQ reagent respectively, and then fractionated as described above. The LC-MS/MS analysis was performed using a Q Exactive mass spectrometer coupled with online nano-HPLC system (Thermo Scientific). Data acquisition was performed using Xcaliber 2.2 software (Thermo Scientific). Protein identification and quantification were performed using Proteome Discoverer 1.3.0.339 (Thermo Fisher) together with the Sequest search engine (parameters included cysteine alkylation with MMTS as static modification; methionine oxidation, and asparagines and glutamine deamidation as dynamic modifications; full trypsin digestion and maximum two missed and/or nonspecific cleavages as digestion parameter; 10ppm precursor mass and 0.02Da fragment mass tolerance). The UniProt Knowledgebase (UniProtKB) of human proteins (downloaded on 12 March 2010, including 95,624 sequences and 36,307,192 residues) was used as a search database with a cut-off false discovery rate of <0.05% at the peptide level. The resulting data set was automatically bias-corrected to eliminate potential variation because of unequal mixing when combining samples. All LC-MS/MS analysis was performed in duplicate.
Cell Proliferation Assay
A total of 3 × 10³ cells/well were seeded into 96-well plates in DMEM containing 10% FBS and incubated at 37 °C, 5% CO2 for 24 h before the medium was refreshed and supplemented with 0.5 mg/ml MTT reagent. After 2h the culture medium was aspirated and the remaining formazan crystals were dissolved in DMSO. Optical density was measured at 570 nm using a micro-plate reader with a reference wavelength of 630 nm (Tecan MagellanTM, Switzerland).
Clonogenic Assay
A total of 500 cells/well were seeded into six well plates in DMEM containing 10% FBS and incubated at 37 °C, 5% CO2 for 12 d. After 12 d of culture the medium was aspirated and the cells fixed in 95% ethanol before being stained with 5% crystal violet for 15 min at room temperature. Excess crystal violet was removed by extensive washing with PBS and the plate was air-dried overnight at room temperature. The number of colonies formed per well was counted and the crystal violet was dissolved in 0.5% triton X-100 solution for quantification by measurement of optical density at 595 nm.
Immunofluorescence Analysis
Cells were plated onto glass cover slips and fixed with 4% paraformaldehyde. Cell membrane was stained with Alexa 594-conjugated wheat germ agglutinin (1:5000) (Invitrogen) then permeabilized and counterstained with DAPI (1.5 μg/ml) (Vector Laboratories, Burlingame, CA). Stained cells were examined by Axio Observer D1 microscope equipped with a 63X/1.25 NA Plan-Neofluar objective (Zeiss, Germany) and Image J software was used for image processing and preparation.
Cell Cycle Phase Duration Measurement
Cells were synchronized in G1/S phase using double thymidine block (2.5 mm thymidine for 18h, release for 8h, and then a second thymidine treatment for 18h). The G1/S-synchronized cells were then released in fresh medium and cells were collected at different time point between 0–12 h thereafter. The harvested cells were fixed and stained with propidium iodide for measurement of DNA content by flow-cytometry and determined the cell cycle stages. To study the effects of KDM1 inhibition on cell cycle progression, G1/S-synchronized cells were released in fresh cell culture medium containing 100 μm (±)-trans-2-phenylcyclopropylamine hydrochloride (2-PCPA) and cells were collected within 0–12 h time period. 2-PCPA is a water soluble drug so fresh culture medium was used as control.
Dynamic SRM Quantification
Chromatins were extracted from the synchronized cells and digested with MNase as described in the previous section. Experiment was performed in triplet and proteins from three biological replicates were pooled together and used for the SRM experiment. Equal amount of protein was taken from each condition and in-gel digested. Tryptic peptides were quantified through SRM experiment by using a TSQ vantage triple stage quadrupole mass spectrometer coupled with EASY-nLC™ 1000 nanoflow UHPLC system (Thermo Scientific). The peptide candidates of the targeted proteins and their transitions used for SRM were selected from our existing human chromatome data sets by using in-house program according to the intensities of the peptide precursor and MS/MS fragments. The retention time of the peptides was determined from full scan SRM data of total 60min run time. Finally, the dynamic SRM analysis was performed for quantification of the targeted proteins. The Acclaim® PepMap RSLC C18 column (75 μm × 15 cm; nanoViper C18, 2 μm, 100Å) fitted with a Acclaim® PepMap100 tap column (75 μm × 2 cm; nanoViper C18, 3 μm, 100Å) (Thermo Scientific) was used for peptides separation. 1 μl of sample was injected each time and 0.1% formic acid in water (mobile phase A) and 0.1% formic acid in acetonitrile (mobile phase B) were used to construct the 60min gradient comprised of 45 min of 3%-30% B; followed by 9min of 30%-50% B and 1min of 50–60%; maintained at 60% B for 2 min; finally re-equilibrated at 3% B for 8 min for peptide separation. For SRM analysis machine parameters were set at optimum condition including electrospray voltage of 1500 V, capillary temperature of 250 °C, collision gas pressure of 1mTorr, mass window of 0.7FWHM (full width at half maximum), and scan time of 50 ms. Collision energy for each peptide was calculated by the equation: CE = (((m × 2/z)/100) × 3.6 - 4.0), where m/z represents mass to charge ratio of the precursor ion. All the experiments were performed in triplets. Data processing and quantitative analysis was performed by using Thermo Pinpoint 1.2.0 software (Thermo Scientific).
RESULTS AND DISCUSSION
Mass Spectrometric Identification and Quantification of the Chromatin Proteome
In order to determine the topology of the ‘chromatome’ chromatin-interacting proteins during cell cycle progression, we first cultured and synchronized human 293F cells in different phases of the cell cycle (G1, G1/S, and G2/M) using double thymidine block and thymidine-nocodazole blocking techniques (supplemental Fig. S1). Chromatin fractions were extracted from the synchronized cells and then partially digested with MNase to liberate euchromatin-associated proteins. Heterochromatin and matrix-associated chromatome proteins were retained in the undigested pellet fractions. Western blot analysis of these preparations confirmed that high levels of α-tubulin were present in the cytosolic fraction but not in the chromatin fraction (supplemental Fig. S2A), whereas histone H2A was present only in the chromatin fraction (supplemental Fig. S2A), indicating that chromatin was specifically enriched in the extracted cell fraction. Proteins were digested in-gel using trypsin and the component peptides were labeled with iTRAQ reagent. The peptides were then pooled, separated using ERLIC fractionation, and analyzed by QqTOF. The peptide spectra were identified and quantified using ProteinPilot 3 software in conjunction with the UniProtKB human protein database.
In this study, we acquired a total of ∼120,000 spectra from three technical replicates over a total of 84 LC-MS/MS runs. After the ProteinPilot searches, a total of 681 proteins were identified with high confidence with Unused score >2 (99% confidence) and FDR <1%, including 481 proteins that incorporated more than one unique peptide (95% confidence). All the proteins and peptides identified are listed in the supplemental material (Protein Summary - Cell Cycle Progression.xlsx and Peptide Summary - Cell Cycle Progression.xlsx). According to the Uniprot database, evidence of protein expression at protein level was available for 332 of the identified molecules, whereas the remainder had previous evidence of expression only at the genetic or transcript level (consistent with the current lack of available chromatome data). The identified proteins were classified according to their subcellular localization as reported in the Uniprot and Nextprot databases (supplemental Fig. S2B). Classification indicated that majority of the identified proteins (74%) were located inside the nucleus, whereas 7% had no specified subcellular localization. The remainders of the proteins were located in mitochondria (8%), endoplasmic reticulum (5%), cytoskeleton (4%), cytoplasm (1%), and extracellular regions (1%). Further classification of these proteins according to their biological functions (supplemental Fig. S2C) revealed that most were involved in mediating nuclear events including chromatin organization (14%), transcriptional regulation (10%), DNA replication and repair (6%), other chromatin-dependent functions (3%), nuclear transport (3%), mRNA processing (14%), and rRNA processing (7%). The proteins with assigned functions outside the nucleus were involved in ribosome organization (6%), cytoskeleton organization (5%), metabolism (9%), molecular chaperones (3%), cellular signaling (2%), protein biosynthesis (2%), cellular transport (2%), and other miscellaneous processes (6%). Only 8% of the identified proteins did not have any defined cellular function.
The supernatant of G1-synchronized cells was used as a denominator for relative quantification of the different samples, and proteins with a significant iTRAQ ratio for at least one condition were selected for further analysis (334 proteins in total, iTRAQ ratio p < 0.05(Supplementary, Protein Summary - Cell Cycle Progression.xlsx)). The quantitative proteomic data revealed that 219 proteins were increased (iTRAQ ratio >1.3) and 209 proteins were decreased (iTRAQ ratio <0.75) in chromatin digests from different phases of the cell cycle (Table I). Proteins were then grouped according to their relative abundance in the different chromatin digests. The hierarchical clustering of the quantified proteins was performed using Pearson-correlation and analysis showed differential release pattern of individual protein from different chromatins upon partial MNase digestion (supplemental Fig. S2D). DNA-protein and protein-protein interactions play a major role in the regulation of chromatin structure and critically regulate all DNA-dependent cellular events in viable host cells. Throughout interphase, higher-order chromatin structures are dynamic in nature and alternately form two distinct types of structure, loosely compacted euchromatin and highly condensed heterochromatin. Partial nuclease treatment efficiently digest the readily accessible euchromatin regions and rapidly release their associated proteins, whereas highly condensed regions of heterochromatin remain undigested and retain their associated proteins in the cell pellet fractions (39). Differential chromatin binding topology during different interphase stages could alter their release patterns upon MNase digestion and showed differential protein abundance in different chromatin digest. The heat map in the supplemental Fig. S2D represents the dynamic chromatin binding topology of interphase chromatome on a global scale. We determined the total chromatin binding level of each protein by combining the iTRAQ ratios of matching pellet and supernatant fractions and the dynamic chromatin association level of interphase chromatome on a global scale was represented in the supplemental Fig. S2E.
Table I. Data analysis of identified proteins in different interphase chromatin digests.
| Sample | Number of proteins with significant change in iTRAQ ratio (p value <0.05) |
Total number of unique proteina | ||||
|---|---|---|---|---|---|---|
| G1/S-S | G2/M-S | G1-P | G1/S-P | G2/M-P | ||
| iTRAQ ratio | 114:113 | 115:113 | 117:113 | 118:113 | 119:113 | |
| Total | 148 | 117 | 245 | 233 | 153 | 334 |
| Ratio>1.3 | 63 | 44 | 108 | 107 | 65 | 219 |
| Ratio<0.75 | 59 | 45 | 131 | 121 | 72 | 209 |
a The number of unique proteins with at least one ratio with p < 0.05.
iTRAQ quantitative results were further validated by an orthogonal SRM based quantitative proteomic approaches. For SRM quantification we selected several peptides for each of the 19 selective proteins and also selected 3–6 strongest specific transitions for each peptide as showed in the supplementary data (SRM validation of iTRAQ results.xlsx). SRM quantification of the 19 selected proteins (supplemental Fig. S3) showed similar chromatin binding topology to the iTRAQ results, indicating the reproducibility and reliability of our chromatome profiling strategy.
Interphase Progression and DNA Repair
DNA repair mechanisms maintain genomic integrity by correcting DNA lesions caused by endogenous and exogenous insults. Genomic instability can cause cell cycle delay or even arrest, hence several distinct repair mechanisms are engaged at different stages of the cell cycle in order to repair DNA damage and maintain normal cell cycle progression. A key DNA repair mechanism is the mismatch repair (MMR) system which comprises numerous proteins and protein complexes (including MutSα/MutSβ, MutLα, RPA, EXO1, RFC, HMGB1, PCNA, polymerase, and ligase I (41)) that act in concert to correct base mismatches during genome replication (42, 43). In the current report, we identified numerous DNA repair proteins that could be classified into four distinct groups by cluster analysis of their relative abundance in the chromatin digests (cluster A-D) (supplemental Fig. S4). Proteins in “cluster C” exhibited increased association with chromatin during early G1 phase, whereas proteins in “cluster B” and “cluster D” were maximally associated with chromatin during G1/S phase. Correction of DNA lesions that contain 8-oxoguanine depends on the MutSα heterodimer of subunits MSH2 and MSH6 (44), and our experimental data revealed that MSH2 and MSH6 were located in “cluster C” and were detected at elevated levels in the G1/S phase pellet fraction (Fig. 1A), indicating that these molecules are associated with G1/S transit. Indeed, a second MMR-associated protein, RFC4, was also enriched in the G1/S-P fraction (Fig. 3C), suggesting that MMR proteins are loaded into chromatin during G1/S transit.
Fig. 1.

Dynamic chromatin association of DNA damage repair proteins during interphase progression. A-C, iTRAQ ratio indicating the relative abundance of proteins obtained by partial MNase digestion of chromatin samples collected during G1,G1/S and G2/M phases of the cell cycle. D, Western blot showing the quantity of proteins Ku70, Ku80 and histone H4 detected in the same chromatin digests. E, Western blot showing the protein expression levels of Ku70, Ku80, histone H4 and actin during G1,G1/S and G2/M phases.
Fig. 3.

Release profiles of chromatin-associated transcriptional regulators and chromatin organization proteins upon partial MNase digestion. iTRAQ ratio indicating the relative abundance of proteins in the different chromatin fractions. Supernatant fractions G1-S, G1/S-S, and G2/M-S, and pellet fractions G1-P, G1/S-P, and G2/M-P were obtained by partial MNase digestion. Differential chromatin association patterns of “cluster a” proteins (A–B), “cluster b” proteins (C–D), and “cluster c” proteins (E–F).
DNA double-strand breaks (DSBs)1 occur frequently during cell cycle progression and are corrected either by non-homologous end joining (NHEJ) or homologous recombination (HR). DNA-dependent protein kinase (DNA-PK) plays a key role in NHEJ-mediated repair of DSBs, and is comprised of a DNA-binding heterodimer Ku70/Ku80 and a catalytic subunit (DNA-PKcs) that are necessary for the kinase activity of the enzyme (45). Euchromatin DSBs are repaired by NHEJ during G1 and G2 phase, whereas heterochromatin DSB repair is mediated by HR during G2 phase (46, 47), and perhaps also during S phase (48). Here we identified DSB repair proteins in “cluster B”, our iTRAQ-based proteomic data and Western blot analysis demonstrated that Ku70 and Ku80 were substantially down-regulated in the pellet fractions (Fig. 1B and 1D), indicating that these molecules are preferentially associated with regions of euchromatin. Western blot analysis of whole cell lysates indicated that Ku70 and Ku80 expression levels were decreased during G1/S transit (Fig. 1E). We therefore hypothesized that NHEJ proteins are loaded into chromatin throughout interphase and that both expression levels and chromatin loading are increased during early G1 and G2 because of phase-specific activation of DSB-repair pathways. “Cluster A” proteins were maximally associated with chromatin during G2/M phase, indicates that these molecules might involve in DNA repair during G2 phase progression. Accordingly, we detected relative enrichment of FEN1 endonuclease (an enzyme that removes 5′ overhanging regions of DNA during replication and repair (49, 50)) in both the supernatant and pellet fractions of G2/M phase samples (Fig. 1B). Because of the localization of FEN1 within the nuclease resistant telomere regions, this enzyme was not efficiently released by partial MNase treatment and was detected at increased concentrations in the pellet fractions. A further two DNA repair proteins (MPG and DDB1) were efficiently released by partial MNase treatment and were present with increased abundance in the supernatant fraction of G2/M phase samples (Fig. 1B), indicating that these molecules contribute to repair of euchromatin lesions in G2 phase.
Chromatin Organization and Transcriptional Regulation during Interphase Progression
Most chromatin-dependent biological events occur in interphase, hence the temporal associations of chromatin with nonhistone proteins during this period have potential to shed light on a wide range of host cell functions. In the present study, we identified 62 proteins that were involved in either chromatin organization or transcriptional regulation, and we conducted cluster analysis of these molecules to determine the extent of their association with the chromatin complex during interphase progression. The proteins were grouped by relative abundance into three distinct clusters (a-c) that each contained two separate subclusters (Fig. 2). Majority of the proteins in “cluster a” were directly involved in transcriptional regulation and maximally associated with chromatin during early G1 (Fig. 2) indicating that these proteins have their maximum transcriptional regulatory activity during early G1 phase. Similarly, “cluster b” proteins displayed increased abundance/chromatin association in G1/S-arrested cells, suggesting a regulatory role for these proteins during late G1 phase. The release patterns of these proteins are displayed in Fig. 3A–3F.
Fig. 2.
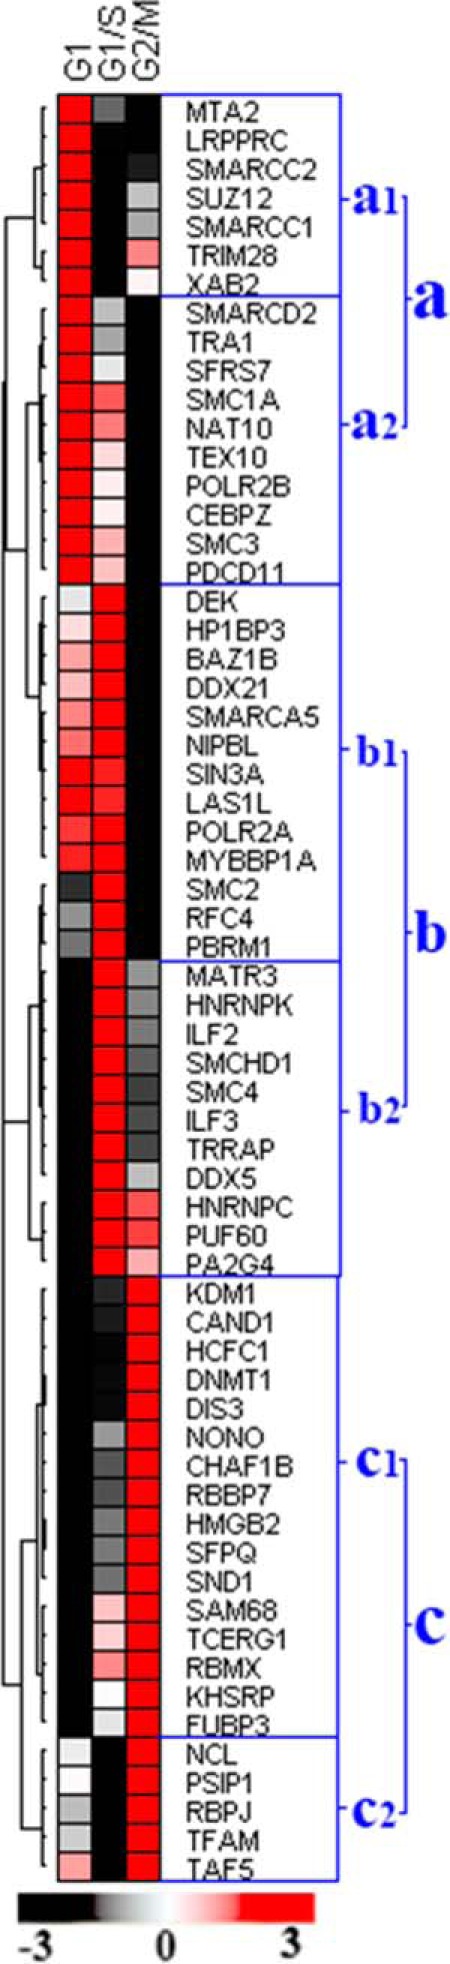
Dynamic chromatin association levels of the chromatin organization proteins and transcriptional regulators during interphase progression. Proteins were grouped by relative abundance into three distinct clusters (a–c) that each contained two separate subclusters (1 and 2). “Cluster a” proteins were maximally associated with chromatin in early G1 phase but also contained distinct subclusters that displayed differential association patterns in G1/S and G2/M. “Cluster b” proteins were maximally associated with chromatin in early G1/S phase and included subgroups of proteins with distinct association profiles in G1/M, G2/M and early G1. “Cluster c” proteins were enriched in early G2/M phase chromatin samples and incorporated subclusters with differential association characteristics in early G2/M, G1 and G1/S. The combined iTRAQ ratios of matching pellet and supernatant fractions were used for the clustered analysis and the color code reflect the relative binding levels of the proteins.
During G1-S transit, external growth factors are known to activate a huge number of genes essential for S phase progression because of direct or indirect involvement in DNA synthesis (51). Recent data suggests that transcription-regulatory proteins ILF2 and IFL3 are vital for cell growth, because their depletion inhibits DNA synthesis and reduces cellular growth (52). In the current study, we observed that the chromatin association levels of many transcription factors (including “cluster b2′ members ILF2, ILF3, PA2G4, PUF60, DDX5, and HNRNPK) were substantially increased in G1/S-arrested cells, and digestion assays confirmed that these proteins were present in increased quantities in supernatant fractions relative to pellet factions (Fig. 3D and supplemental Fig. S3). The association of these transcription factors with nuclease-susceptible regions of active euchromatin facilitated their efficient release by MNase treatment. Our proteomic data further suggested that the chromatin association level of transcriptional machinery proteins including POLR2A and POLR2B was increased during G1 and G1/S phases (Fig. 3B-C), which is characteristic of global transcriptional activation (53). In addition, cycline D1 expression regulates G1-S phase progression (54), and expression levels of this protein are modulated by the chromatin-modeling factor SNF2H and the CCAAT-binding protein C/EBP (55). Our quantitative data demonstrated that the chromatin association levels of CCAAT-binding protein CEBPZ and also SMARCA5 (an ATP-dependent chromatin remodeling complex protein) were increased during G1 phase. Digestion results identified higher concentrations of these proteins in the pellet fractions, and the chromatin association level of CEBPZ was decreased in G1/S relative to early G1 phase (Fig. 3B and supplemental Fig. S3). Our proteomic and nuclease digestion data suggested that CEBPZ is associated with chromatin during early G1 phase and might be involved in the repression of cycline D1 expression, but decreasing association of CEBPZ with chromatin during transit to S phase might withdraw its repression effect and increased cycline D1 expression which allows cycle progression to S phase (54). Moreover, the suppressive function of CEBPZ may confer binding activity that renders this protein resistant to MNase release.
The relative abundance of proteins SMARCA5, HP1BP3, NAT10, BAZ1B, TEX10, SIN3A, LAS1L, and MYBBP1A in “cluster b1′” was increased in G1 relative to G2/M phase. The chromatin association levels of these proteins were gradually increased during G1 progression and reached maximum levels during late G1 phase (G1/S) (Fig. 3C and supplemental Fig. S3). Emerging evidence suggests that chromatin binding of the transcriptional repressor MYBBP1A (detected in “cluster b1′”) is essential for heterochromatin integrity and transcriptional regulation (56). Accordingly, our data showed that “cluster b1′” proteins were not efficiently released by partial MNase digestion, (indicating a predominant association with regions of nuclease-resistant heterochromatin), and indicated that protein abundance was increased in early G1 and G1/S phase pellet fractions when compared with either the supernatant fractions or with the G2/M pellet (Fig. 3C). Our Western blot analysis further revealed that the chromatin association level of HP1BP3 was increased during both early G1 phase and G1/S transit relative to G2/M phase (Fig. 4A–4B), consistent with a putative role for this protein in chromatin organization (57). The proteomic data therefore suggested that “cluster b1′” proteins are likely to regulate gene transcription by maintaining heterochromatin integrity during G1–S progression (58).
Fig. 4.

Western blot of HP1BP3 protein in different chromatin fractions. A, Distinct chromatin association levels of HP1BP3 protein during G1,G1/S and G2/M phases. B, Relative association level of HP1BP3 with G1,G1/S and G2/M phase chromatin.
Proteins in ‘cluster c’ increased their association with chromatin during G2/M relative to early G1 and G1/S phase, thereby implicating these molecules in G2/M phase progression. Differential release patterns for these proteins (Fig. 3E–3F) revealed dynamic associations of these molecules with the chromatin complex during interphase progression. Previously reported data have suggested that HCF-1 and related proteins are involved in both the activation and suppression of cell cycle regulatory genes (59), and our iTRAQ-based proteomic data indicated that HCFC1 was more abundant in G2/M phase supernatant and pellet fractions compared with the other chromatin preparations (Fig. 3E). Together, these findings suggested that HCFC1 associates with both euchromatin and heterochromatin to modulate G2/M-specific transcriptional activity. Another “cluster c” member DNMT1 was enriched in the G2/M phase pellet fraction (Fig. 3E) indicating a likely role for this protein in maintaining the hyper-methylated structure of heterochromatin during G2/M (60). In contrast, the histone demethylase KDM1 and non-histone protein HMGB2 were primarily detected in the supernatant fraction of G2/M-arrested cells (Fig. 3E) reflecting a predominant localization to regions of euchromatin during G2/M phase. Lysine-specific histone demethylase KDM1 is a key enzyme responsible for histone demethylation at positions H3K4 and H3K9 during activation of gene transcription (61, 62). In order to better understand the cell cycle-specific role played by this enzyme, we inhibited KDM1 activity by addition of the monoamine oxidase inhibitor 2-PCPA and observed that progression of S/G2 transit was delayed in the presence of this compound (supplemental Fig. S5A–5C), thus confirming that KDM1-mediated histone demethylation (supplemental Fig. S6A–6C) is essential for the maintenance of chromatin integrity and normal gene expression during G2 phase. The chromatin association pattern of non-histone protein HMGN2 was similar to that of KDM1, suggesting that HMGN2 may also be involved in the regulation of G2-specific gene expression. The relative abundance of transcription factors and regulatory proteins in “cluster c2′” (including PSIP1, RBPJ, TAF5, TFAM, and NCL) was increased during G2/M phase (Fig. 2), and their release patterns indicated high concentrations in the supernatant fractions relative to the pellet fractions, consistent with their binding within the active sites (Fig. 3F). However, there was no significant difference in the protein levels detected between supernatant fractions, indicating that their euchromatin association topology is not significantly altered during interphase progression (Fig. 3F).
Taken together, our proteomic data provide novel insight into the topology of chromatin-associated proteins during cell cycle progression and may elucidate their roles in regulating this process. Strikingly, both the proteomic and Western blot analyses revealed that the chromatin-interacting protein HP1BP3 gradually increased its association with chromatin during G1-S progression and displayed dynamic interactions with heterochromatin during interphase progression. Further bioinformatic analysis revealed that the HP1BP3 protein is conserved in higher vertebrates and exhibits three “histone H1-like” domains (57). Although HP1BP3 has not yet been functionally characterized, further analysis of our discovery-phase proteomic data together with reports from other investigators (57), suggested that HP1BP3 may be involved in chromatin organization. We therefore hypothesized that HP1BP3 regulates chromatin structure in G1 phase by inter-converting euchromatin and heterochromatin to activate or silence specific genes, so we next sought to test this concept in a series of functional experiments.
HP1BP3 is a Novel Regulator of Heterochromatin Structure
A previous report indicated that HP1BP3 exhibits three “histone-H1-like” domains that confer DNA-binding characteristics and may allow direct interaction with both heterochromatin binding protein 1 (HP1) and linker DNA (57). Analysis of our proteomic data revealed that HP1BP3 was maximally abundant in undigested chromatin fractions, consistent with a heterochromatin-specific localization for this protein and in-line with the proposal that HP1BP3 directly interacts with HP1 (57). In order to study the effects of HP1BP3 depletion on chromatin structure, we used shRNA-knockdown approaches to reduce HP1BP3 protein expression in 293T cells and extracted chromatin for partial MNase digestion (supplemental Fig. S7). Compared with mock-depleted control cells, the HP1BP3-depleted chromatin samples were more susceptible to MNase digestion (Fig. 5A), suggesting that HP1BP3 depletion may convert nuclease-resistant heterochromatin into a MNase-digestible conformation. These experimental data indicated that HP1BP3 may be required for chromatin packing into heterochromatin, and that depletion of HP1BP3 disrupts heterochromatin structure caused by unfolding of chromatin (Fig. 5B).
Fig. 5.
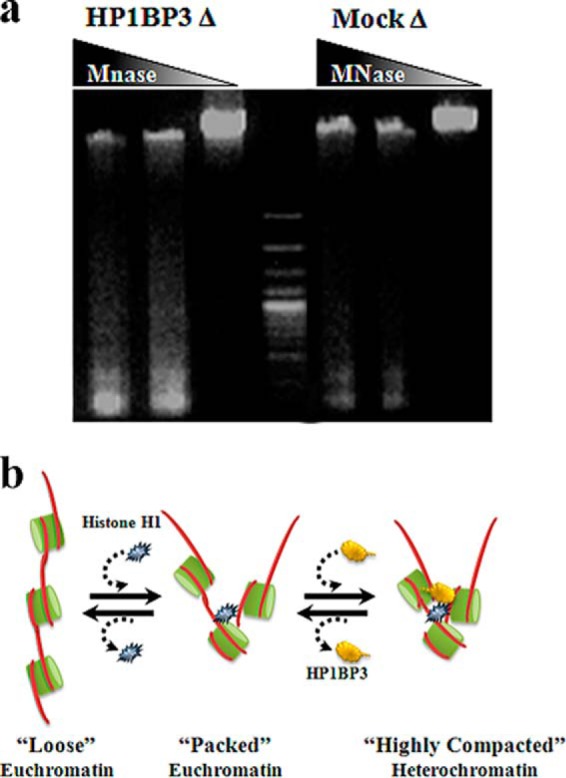
HP1BP3 depletion alters higher-order chromatin structure. A, MNase finger-printing of mock- and HP1BP3-depleted chromatin preparations. Chromatin samples were digested with different concentrations of MNase (0, 5, and 10 U) and separated using 1% agarose gels. B, Model of HP1BP3-mediated heterochromatin packing.
Our experimental data demonstrated that HP1BP3 plays a key role in the maintenance of high-order chromatin structure, which is a critical regulator of host cell transcriptional activity (63). We therefore assessed whether differences in gene transcription because of altered chromatin structure could be revealed by iTRAQ-based analysis of differentially expressed proteins in the HP1BP3-depleted cells. Our iTRAQ experiment identified a total of 1651 proteins at a high level of confidence with a FDR <1%, including 814 proteins that exhibited more than one unique peptide (all identified proteins/peptides are listed in Supplementary, Protein Summary - Mock versus HP1BP3 depleted.xlsx and Peptide Summary - Mock versus HP1BP3 depleted.xlsx). The physicochemical characteristics (pI versus MW) of the identified proteins were represented in Fig. 6A. We identified a total of 384 proteins that were differentially expressed in HP1BP3-depleted cells (iTRAQ ratio >1.2 or <0.8), comprising 176 up-regulated and 208 down-regulated proteins (Fig. 6B). The identified proteins were then classified according to their subcellular localization and assigned biological functions (Fig. 6C–6D). Our quantitative proteomic data suggested that depletion of HP1BP3 altered the protein expression levels in the resulting phenotype. Altered protein expression because of HP1BP3 depletion suggested that HP1BP3 not only involve in the maintenance of heterochromatin integrity but also involve in transcription regulation.
Fig. 6.

HP1BP3 depletion modulates host cell protein expression. A, Distribution of molecular weight (MW) and isoelectric point (pI) of the identified proteins. B, iTRAQ ratio indicating differential protein expression in HP1BP3-depleted cells. Protein differential expression was classified according to subcellular localization (C) and cellular function (D). E, Differential expression levels of proteasome subunits in HP1BP3-depleated cells as determined by iTRAQ quantitation of relative protein abundance.
HP1BP3 is a Novel Regulator of Cell Proliferation
Cell growth is influenced by numerous factors including nutrient availability, extracellular environmental conditions, gene expression profile and regulatory protein activity that require careful coordination to support normal cell division (64). Strikingly, our cell proliferation assays indicated that HP1BP3 depletion enhanced cell proliferation by an average of ∼39% (Fig. 7A) and increased clonogenicity by an average of ∼18% (Fig. 7B–7C). However, there was no significant difference between the mock- and HP1BP3-depleted 293Tcells with respect to cell cycle phase distribution, so we next assessed potential changes in phase length by synchronizing both the mock- and HP1BP3-depleted cells in G1/S prior to analysis. HP1BP3-depleted cells progressed through G1/S and S phase faster than did mock-depleted cells (Fig. 7D–7E), suggesting a likely role for HP1BP3 in the regulation of cell proliferation via effects on phase duration (65–67). Emerging evidences suggested like many other proteins, 20S proteasome catalytic subunits PSMB1 and PSMB5 regulate proliferation through regulating cyclin D1/CDK4 level and promotes G1/S transit (68, 69). Although our quantitative proteomic profiling showed that 26S proteasome components PSMA1, PSMA4, PSMB1, PSMB5, PSMC2, PSMC3, and PSMD6 were up-regulated upon HP1BP3 depletion (Fig. 6E) which could alter the cyclin/CDK laves and promote the G1/S transit. Together, these experimental data indicated that HP1BP3 contributes to transcriptional regulation by maintaining heterochromatin integrity, and that disruption of the cell cycle regulatory function can increase the rate of G1/S transit that leads to enhanced cell proliferation.
Fig. 7.

HP1BP3 regulates cell proliferation. A, MTT colorimetric assay showing viable cell numbers in mock- and HP1BP3-depleted samples. B, Clonogenic assay showing mock- and HP1BP3-depleted cell colony staining with crystal violet. C, Graph representing the number of colonies formed by mock- and HP1BP3-depleted cells together with the corresponding absorbance value of the crystal violet colony staining. D, Progression of cell cycle during 4–12h window after release from double thymidine block. E, Proportion of S phase cells detected in cultures harvested between 4–12 h (n = 3 experimental replicates).
Both mock- and HP1BP3-depleted A431cells exhibited identical size distribution profiles as assessed by FACS analysis (Fig. 8C), but nuclear diameter was substantially increased in HP1BP3-depleted cells when compared with mock-depleted A431cells (Fig. 8A–8B, and 8D). These data suggested that depletion of HP1BP3 leads to unpacking of heterochromatin in the shRNA-treated cells, leading to increased nuclear size. Previous reports have indicated that while chromatin condensation and modification of nuclear size occur in parallel, these are in fact independent processes (70, 71). Other published data suggest that increased nuclear import drives increases in nuclear size (72), and our proteomic data revealed that proteins involved in nuclear import (including IPO7, NUP210, IPO4, and KPNA2) were up-regulated in HP1BP3-depleted cells, whereas key nuclear export proteins (including CSE1L and RAN) were down-regulated in HP1BP3-depleted cells (Fig. 8E). Taken together, these data indicated that depletion of HP1BP3 leads to unpacking of heterochromatin and altered protein expression, including modulated expression of nuclear transport proteins that leads to increased net flux into the nucleus and thus increased nuclear size.
Fig. 8.

Nuclear size is increased by HP1BP3 depletion. A–B, Mock- and HP1BP3-depleted A431 cells were plated onto glass cover slips and stained with Alexa 594-conjugated WGA (red cell membrane staining) and with DAPI to identify nuclei (blue) prior to immunofluorescence imaging (scale bar = 10 μm). C, Comparison of mock- and HP1BP3-depleted A431 cell sizes by flow-cytometry. D, Distribution of nuclear diameter measurements in mock- and HP1BP3-depleted A431 cells. E, Differential expression levels of nuclear transport proteins in HP1BP3-depleted cells as determined by iTRAQ quantitation of relative abundance.
CONCLUSIONS
The current study provides the first detailed profile of the chromatin-associated proteome (chromatome) during cell cycle progression and identifies chromatome protein HP1BP3 as a novel regulator of cell proliferation. Cell cycle progression requires dynamic re-modeling of chromatin structure in order to facilitate key functions in preparation for mitosis. Because the structural integrity of chromatin is maintained by chromatin-protein interactions, a better understanding of the dynamic interactions between chromatome members and the chromatin complex will be the key to advancing our knowledge of host cell cycle regulation in both homeostatic and pathological conditions.
In the current study, we used partial MNase digestion together with iTRAQ-based high-throughput quantitative proteomic analyses for the identification and quantification of chromatin-associated proteome members during interphase progression. We identified 481 proteins at a high level of confidence, and the majority of these were involved in genome packaging, DNA repair, DNA replication, or regulation of gene transcription. The quantitative data generated here shed new light on the complex interactions of chromatome proteins with the chromatin complex in distinct phases of the normal cell cycle, and we further identified that HP1BP3 interactions with chromatin are highly dynamic during interphase. We therefore assessed HP1BP3 function using shRNA-mediated gene knockdown approaches combined with biochemical and proteomic analyses to identify that HP1BP3 depletion induces chromatin unpacking and increases both MNase susceptibility and nuclear size. These data suggest that HP1BP3 inter-converts euchromatin and heterochromatin to activate or silence specific genes. Consistent with this concept, we observed that HP1BP3 depletion accelerated G1/S transit and enhanced cell proliferation via the putative mechanism of activating previously silenced genes in regions of heterochromatin. Taken together, we propose that HP1BP3 regulates gene transcription by maintaining heterochromatin integrity and thus regulates the length of G1 phase to maintain cell cycle progression.
Supplementary Material
Acknowledgments
We thank Neil McCarthy for critically reviewed the manuscript.
Footnotes
Author contributions: S.S. and B.D. designed research; B.D., Y.R., E.C., and S.A. performed research; J.P.T. contributed new reagents or analytic tools; B.D., K.S., and S.S. analyzed data; B.D. and S.S. wrote the paper.
* This work is in part supported by the Singapore National Research Foundation under its CBRG (NMRC/CBRG/0004/2012) administered by the Singapore Ministry of Health's National Medical Research Council, the Singapore National Research Foundation under its CRP (NRF2011 NRF-CRP 001–109), and Singapore Ministry of Education (Tier 1: RGT15/13).
 This article contains supplemental Figs. S1 to S7.
1 The abbreviations used are:
- DSB
- DNA double strand break
- DTT
- dithiothreitol
- HR
- homologous recombination
- 2-PCPA
- (±)-trans-2-phenylcyclopropylamine hydrochloride
- DMEM
- Dulbecco's modified Eagle's medium
- DNA-PK
- DNA-dependent protein kinase
- EF
- error factor
- FDR
- false discovery rate
- HEPES
- (4-(2-hydroxyethyl)-1-piperazineethanesulfonic acid)
- HP1
- heterochromatin binding protein1
- HP1BP3
- heterochromatin binding protein1 binding protein3
- iTRAQ
- isobaric tag for relative and absolute quantification
- MMR
- mismatch repair
- MNase
- micrococcal nuclease
- NHEJ
- nonhomologous end-joining
- PAGE
- polyacrylamide gel electrophoresis
- TEAB
- triethylammonium bicarbonate.
REFERENCES
- 1. Pombo A. (2007) Advances in imaging the interphase nucleus using thin cryosections. Histochem.Cell Biol. 128, 97–104 [DOI] [PubMed] [Google Scholar]
- 2. Bailis J. M., Forsburg S. L. (2003) It's all in the timing: linking S phase to chromatin structure and chromosome dynamics. Cell cycle. 2, 303–306 [PubMed] [Google Scholar]
- 3. Probst A. V., Dunleavy E., Almouzni G. (2009) Epigenetic inheritance during the cell cycle. Nat. Rev. Mol. Cell Biol. 10, 192–206 [DOI] [PubMed] [Google Scholar]
- 4. Liu Q., Gong Z. (2011) The coupling of epigenome replication with DNA replication. Curr. Opin. Plant Biol. 14, 187–194 [DOI] [PubMed] [Google Scholar]
- 5. Gehring M., Huh J. H., Hsieh T. F., Penterman J., Choi Y., Harada J. J., Goldberg R. B., Fischer R. L. (2006) DEMETER DNA glycosylase establishes MEDEA polycomb gene self-imprinting by allele-specific demethylation. Cell 124, 495–506 [DOI] [PMC free article] [PubMed] [Google Scholar]
- 6. Zhang C., Su Z. Y., Khor T. O., Shu L., Kong A. N. (2013) Sulforaphane enhances Nrf2 expression in prostate cancer TRAMP C1 cells through epigenetic regulation. Biochem. Pharmacol. 85, 1398–1404 [DOI] [PMC free article] [PubMed] [Google Scholar]
- 7. Ng M. H., Wong I. H., Lo K. W. (1999) DNA methylation changes and multiple myeloma. Leuk. Lymphoma 34, 463–472 [DOI] [PubMed] [Google Scholar]
- 8. Halley-Stott R. P., Gurdon J. B. (2013) Epigenetic memory in the context of nuclear reprogramming and cancer. Brief Funct. Genomics. 12, 164–173 [DOI] [PMC free article] [PubMed] [Google Scholar]
- 9. Martin C., Zhang Y. (2007) Mechanisms of epigenetic inheritance. Curr. Opin. Cell Biol. 19, 266–272 [DOI] [PubMed] [Google Scholar]
- 10. Huang C., Zhang Z., Xu M., Li Y., Li Z., Ma Y., Cai T., Zhu B. (2013) H3.3-h4 tetramer splitting events feature cell-type specific enhancers. PLoS Genet. 9, e1003558. [DOI] [PMC free article] [PubMed] [Google Scholar]
- 11. Wysocka J., Swigut T., Milne T. A., Dou Y., Zhang X., Burlingame A. L., Roeder R. G., Brivanlou A. H., Allis C. D. (2005) WDR5 associates with histone H3 methylated at K4 and is essential for H3 K4 methylation and vertebrate development. Cell 121, 859–872 [DOI] [PubMed] [Google Scholar]
- 12. Ahmad K., Henikoff S. (2002) The histone variant H3.3 marks active chromatin by replication-independent nucleosome assembly. Mol. Cell 9, 1191–1200 [DOI] [PubMed] [Google Scholar]
- 13. Vermeulen M., Eberl H. C., Matarese F., Marks H., Denissov S., Butter F., Lee K. K., Olsen J. V., Hyman A. A., Stunnenberg H. G., Mann M. (2010) Quantitative interaction proteomics and genome-wide profiling of epigenetic histone marks and their readers. Cell 142, 967–980 [DOI] [PubMed] [Google Scholar]
- 14. Yong K. J., Milenic D. E., Baidoo K. E., Brechbiel M. W. (2012) (212)Pb-radioimmunotherapy induces G(2) cell-cycle arrest and delays DNA damage repair in tumor xenografts in a model for disseminated intraperitoneal disease. Mol. Cancer Ther. 11, 639–648 [DOI] [PMC free article] [PubMed] [Google Scholar]
- 15. Sinha M., Peterson C. L. (2009) Chromatin dynamics during repair of chromosomal DNA double-strand breaks. Epigenomics 1, 371–385 [DOI] [PMC free article] [PubMed] [Google Scholar]
- 16. Mosesso P., Palitti F., Pepe G., Pinero J., Bellacima R., Ahnstrom G., Natarajan A. T. (2010) Relationship between chromatin structure, DNA damage and repair following X-irradiation of human lymphocytes. Mutat. Res. 701, 86–91 [DOI] [PubMed] [Google Scholar]
- 17. Audit B., Zaghloul L., Vaillant C., Chevereau G., d'Aubenton-Carafa Y., Thermes C., Arneodo A. (2009) Open chromatin encoded in DNA sequence is the signature of ‘master’ replication origins in human cells. Nucleic Acids Res. 37, 6064–6075 [DOI] [PMC free article] [PubMed] [Google Scholar]
- 18. Mora-Bermudez F., Ellenberg J. (2007) Measuring structural dynamics of chromosomes in living cells by fluorescence microscopy. Methods 41, 158–167 [DOI] [PubMed] [Google Scholar]
- 19. Hartl P., Gottesfeld J., Forbes D. J. (1993) Mitotic repression of transcription in vitro. J. Cell Biol. 120, 613–624 [DOI] [PMC free article] [PubMed] [Google Scholar]
- 20. Zhang X., Yu Q., Olsen L., Bi X. (2012) Functions of protosilencers in the formation and maintenance of heterochromatin in Saccharomyces cerevisiae. PloS ONE 7, e37092. [DOI] [PMC free article] [PubMed] [Google Scholar]
- 21. Aird K. M., Zhang R. (2013) Detection of senescence-associated heterochromatin foci (SAHF). Methods Mol. Biol. 965, 185–196 [DOI] [PMC free article] [PubMed] [Google Scholar]
- 22. Tu Z., Aird K., Zhang R. (2013) Chromatin remodeling, BRCA1, SAHF, and cellular senescence. Cell cycle 12, 1653–1654 [DOI] [PMC free article] [PubMed] [Google Scholar]
- 23. Jespersen C., Soragni E., James Chou C., Arora P. S., Dervan P. B., Gottesfeld J. M. (2012) Chromatin structure determines accessibility of a hairpin polyamide-chlorambucil conjugate at histone H4 genes in pancreatic cancer cells. Bioorg. Med. Chem. Let. 22, 4068–4071 [DOI] [PMC free article] [PubMed] [Google Scholar]
- 24. Di Paola D., Rampakakis E., Chan M. K., Zannis-Hadjopoulos M. (2012) Differential chromatin structure encompassing replication origins in transformed and normal cells. Genes Cancer 3, 152–176 [DOI] [PMC free article] [PubMed] [Google Scholar]
- 25. Eberl H. C., Spruijt C. G., Kelstrup C. D., Vermeulen M., Mann M. (2013) A map of general and specialized chromatin readers in mouse tissues generated by label-free interaction proteomics. Mol. Cell 49, 368–378 [DOI] [PubMed] [Google Scholar]
- 26. Dulac C. (2010) Brain function and chromatin plasticity. Nature 465, 728–735 [DOI] [PMC free article] [PubMed] [Google Scholar]
- 27. Chadwick B. P., Willard H. F. (2002) Cell cycle-dependent localization of macroH2A in chromatin of the inactive X chromosome. J. Cell Biol. 157, 1113–1123 [DOI] [PMC free article] [PubMed] [Google Scholar]
- 28. Izuta H., Ikeno M., Suzuki N., Tomonaga T., Nozaki N., Obuse C., Kisu Y., Goshima N., Nomura F., Nomura N., Yoda K. (2006) Comprehensive analysis of the ICEN (Interphase Centromere Complex) components enriched in the CENP-A chromatin of human cells. Genes Cells 11, 673–684 [DOI] [PubMed] [Google Scholar]
- 29. Cherukuri S., Hock R., Ueda T., Catez F., Rochman M., Bustin M. (2008) Cell cycle-dependent binding of HMGN proteins to chromatin. Mol. Biol. Cell 19, 1816–1824 [DOI] [PMC free article] [PubMed] [Google Scholar]
- 30. Agostinho M., Rino J., Braga J., Ferreira F., Steffensen S., Ferreira J. (2004) Human topoisomerase IIalpha: targeting to subchromosomal sites of activity during interphase and mitosis. Mol. Biol. Cell 15, 2388–2400 [DOI] [PMC free article] [PubMed] [Google Scholar]
- 31. Iwasaki O., Noma K. (2012) Global genome organization mediated by RNA polymerase III-transcribed genes in fission yeast. Gene 493, 195–200 [DOI] [PMC free article] [PubMed] [Google Scholar]
- 32. Minc E., Courvalin J. C., Buendia B. (2000) HP1gamma associates with euchromatin and heterochromatin in mammalian nuclei and chromosomes. Cytogenet. Cell Genet. 90, 279–284 [DOI] [PubMed] [Google Scholar]
- 33. Hayakawa T., Haraguchi T., Masumoto H., Hiraoka Y. (2003) Cell cycle behavior of human HP1 subtypes: distinct molecular domains of HP1 are required for their centromeric localization during interphase and metaphase. J. Cell Sci. 116, 3327–3338 [DOI] [PubMed] [Google Scholar]
- 34. Chu D. S., Liu H., Nix P., Wu T. F., Ralston E. J., Yates J. R., 3rd, Meyer B. J. (2006) Sperm chromatin proteomics identifies evolutionarily conserved fertility factors. Nature 443, 101–105 [DOI] [PMC free article] [PubMed] [Google Scholar]
- 35. Kubota T., Stead D. A., Hiraga S., ten Have S., Donaldson A. D. (2012) Quantitative proteomic analysis of yeast DNA replication proteins. Methods 57, 196–202 [DOI] [PubMed] [Google Scholar]
- 36. Uchiyama S., Kobayashi S., Takata H., Ishihara T., Hori N., Higashi T., Hayashihara K., Sone T., Higo D., Nirasawa T., Takao T., Matsunaga S., Fukui K. (2005) Proteome analysis of human metaphase chromosomes. J. Biol. Chem. 280, 16994–17004 [DOI] [PubMed] [Google Scholar]
- 37. Choi S., Srivas R., Fu K. Y., Hood B. L., Dost B., Gibson G. A., Watkins S. C., Van Houten B., Bandeira N., Conrads T. P., Ideker T., Bakkenist C. J. (2012) Quantitative proteomics reveal ATM kinase-dependent exchange in DNA damage response complexes. J. Proteome Res. 11, 4983–4991 [DOI] [PMC free article] [PubMed] [Google Scholar]
- 38. Rousseaux S., Khochbin S. (2012) Combined proteomic and in silico approaches to decipher post-meiotic male genome reprogramming in mice. Syst. Biol. Reprod. Med. 58, 191–196 [DOI] [PubMed] [Google Scholar]
- 39. Dutta B., Adav S. S., Koh C. G., Lim S. K., Meshorer E., Sze S. K. (2012) Elucidating the temporal dynamics of chromatin-associated protein release upon DNA digestion by quantitative proteomic approach. J. Proteomics 75, 5493–5506 [DOI] [PubMed] [Google Scholar]
- 40. Hao P., Qian J., Ren Y., Sze S. K. (2011) Electrostatic repulsion-hydrophilic interaction chromatography (ERLIC) versus strong cation exchange (SCX) for fractionation of iTRAQ-labeled peptides. J. Proteome Res. 10, 5568–5574 [DOI] [PubMed] [Google Scholar]
- 41. Zhang Y., Yuan F., Presnell S. R., Tian K., Gao Y., Tomkinson A. E., Gu L., Li G. M. (2005) Reconstitution of 5′-directed human mismatch repair in a purified system. Cell 122, 693–705 [DOI] [PubMed] [Google Scholar]
- 42. Kunkel T. A., Erie D. A. (2005) DNA mismatch repair. Annu. Rev. Biochem. 74, 681–710 [DOI] [PubMed] [Google Scholar]
- 43. Pena-Diaz J., Jiricny J. (2012) Mammalian mismatch repair: error-free or error-prone? Trends Biochem. Sci. 37, 206–214 [DOI] [PubMed] [Google Scholar]
- 44. Larson E. D., Iams K., Drummond J. T. (2003) Strand-specific processing of 8-oxoguanine by the human mismatch repair pathway: inefficient removal of 8-oxoguanine paired with adenine or cytosine. DNA Repair 2, 1199–1210 [DOI] [PubMed] [Google Scholar]
- 45. Davis A. J., Lee K. J., Chen D. J. (2013) The N-terminal region of the DNA-dependent protein kinase catalytic subunit is required for its DNA double-stranded break-mediated activation. J. Biol. Chem. 288, 7037–7046 [DOI] [PMC free article] [PubMed] [Google Scholar]
- 46. Shibata A., Conrad S., Birraux J., Geuting V., Barton O., Ismail A., Kakarougkas A., Meek K., Taucher-Scholz G., Lobrich M., Jeggo P. A. (2011) Factors determining DNA double-strand break repair pathway choice in G2 phase. EMBO J. 30, 1079–1092 [DOI] [PMC free article] [PubMed] [Google Scholar]
- 47. Kongruttanachok N., Phuangphairoj C., Thongnak A., Ponyeam W., Rattanatanyong P., Pornthanakasem W., Mutirangura A. (2010) Replication independent DNA double-strand break retention may prevent genomic instability. Mol. Cancer 9, 70. [DOI] [PMC free article] [PubMed] [Google Scholar]
- 48. Kocher S., Rieckmann T., Rohaly G., Mansour W. Y., Dikomey E., Dornreiter I., Dahm-Daphi J. (2012) Radiation-induced double-strand breaks require ATM but not Artemis for homologous recombination during S-phase. Nucleic Acids Res. 40, 8336–8347 [DOI] [PMC free article] [PubMed] [Google Scholar]
- 49. Storici F., Henneke G., Ferrari E., Gordenin D. A., Hübscher U., Resnick M. A. (2002) The flexible loop of human FEN1 endonuclease is required for flap cleavage during DNA replication and repair. EMBO J. 21, 5930–5942 [DOI] [PMC free article] [PubMed] [Google Scholar]
- 50. Verdun R. E., Karlseder J. (2006) The DNA damage machinery and homologous recombination pathway act consecutively to protect human telomeres. Cell 127, 709–720 [DOI] [PubMed] [Google Scholar]
- 51. Stein G. S., van Wijnen A. J., Stein J. L., Lian J. B., Montecino M., Zaidi S. K., Braastad C. (2006) An architectural perspective of cell-cycle control at the G1/S phase cell-cycle transition. J. Cell. Physiol. 209, 706–710 [DOI] [PubMed] [Google Scholar]
- 52. Guan D., Altan-Bonnet N., Parrott A. M., Arrigo C. J., Li Q., Khaleduzzaman M., Li H., Lee C. G., Pe'ery T., Mathews M. B. (2008) Nuclear factor 45 (NF45) is a regulatory subunit of complexes with NF90/110 involved in mitotic control. Mol. Cell. Biol. 28, 4629–4641 [DOI] [PMC free article] [PubMed] [Google Scholar]
- 53. Winnicki K., Polit J. T., Maszewski J. (2013) Increased transcription in hydroxyurea-treated root meristem cells of Vicia faba. Protoplasma 250, 251–259 [DOI] [PMC free article] [PubMed] [Google Scholar]
- 54. Shimura T., Ochiai Y., Noma N., Oikawa T., Sano Y., Fukumoto M. (2013) Cyclin D1 overexpression perturbs DNA replication and induces replication-associated DNA double-strand breaks in acquired radioresistant cells. Cell Cycle 12, 773–782 [DOI] [PMC free article] [PubMed] [Google Scholar]
- 55. Steinberg X. P., Hepp M. I., Fernandez Garcia Y., Suganuma T., Swanson S. K., Washburn M., Workman J. L., Gutierrez J. L. (2012) Human CCAAT/enhancer-binding protein beta interacts with chromatin remodeling complexes of the imitation switch subfamily. Biochemistry 51, 952–962 [DOI] [PubMed] [Google Scholar]
- 56. Tan B. C., Yang C. C., Hsieh C. L., Chou Y. H., Zhong C. Z., Yung B. Y., Liu H. (2012) Epigeneitc silencing of ribosomal RNA genes by Mybbp1a. J. Biomed. Sci. 19, 57. [DOI] [PMC free article] [PubMed] [Google Scholar]
- 57. Hayashihara K., Uchiyama S., Shimamoto S., Kobayashi S., Tomschik M., Wakamatsu H., No D., Sugahara H., Hori N., Noda M., Ohkubo T., Zlatanova J., Matsunaga S., Fukui K. (2010) The middle region of an HP1-binding protein, HP1-BP74, associates with linker DNA at the entry/exit site of nucleosomal DNA. J. Biol. Chem. 285, 6498–6507 [DOI] [PMC free article] [PubMed] [Google Scholar]
- 58. Jerabek H., Heermann D. W. (2012) Expression-dependent folding of interphase chromatin. PloS ONE 7, e37525. [DOI] [PMC free article] [PubMed] [Google Scholar]
- 59. Piluso D., Bilan P., Capone J. P. (2002) Host cell factor-1 interacts with and antagonizes transactivation by the cell cycle regulatory factor Miz-1. J. Biol. Chem. 277, 46799–46808 [DOI] [PubMed] [Google Scholar]
- 60. Ma Y., Jacobs S. B., Jackson-Grusby L., Mastrangelo M. A., Torres-Betancourt J. A., Jaenisch R., Rasmussen T. P. (2005) DNA CpG hypomethylation induces heterochromatin reorganization involving the histone variant macroH2A. J. Cell Sci. 118, 1607–1616 [DOI] [PubMed] [Google Scholar]
- 61. Nair S. S., Nair B. C., Cortez V., Chakravarty D., Metzger E., Schule R., Brann D. W., Tekmal R. R., Vadlamudi R. K. (2010) PELP1 is a reader of histone H3 methylation that facilitates oestrogen receptor-alpha target gene activation by regulating lysine demethylase 1 specificity. EMBO Rep. 11, 438–444 [DOI] [PMC free article] [PubMed] [Google Scholar]
- 62. Sakane N., Kwon H. S., Pagans S., Kaehlcke K., Mizusawa Y., Kamada M., Lassen K. G., Chan J., Greene W. C., Schnoelzer M., Ott M. (2011) Activation of HIV transcription by the viral Tat protein requires a demethylation step mediated by lysine-specific demethylase 1 (LSD1/KDM1). PLoS Pathog. 7, e1002184. [DOI] [PMC free article] [PubMed] [Google Scholar]
- 63. Butchko R. A., Brown D. W., Busman M., Tudzynski B., Wiemann P. (2012) Lae1 regulates expression of multiple secondary metabolite gene clusters in Fusarium verticillioides. Fungal Genet. Biol. 49, 602–612 [DOI] [PubMed] [Google Scholar]
- 64. Yuan H. X., Xiong Y., Guan K. L. (2013) Nutrient sensing, metabolism, and cell growth control. Mol. Cell 49, 379–387 [DOI] [PMC free article] [PubMed] [Google Scholar]
- 65. Owa T., Yoshino H., Yoshimatsu K., Nagasu T. (2001) Cell cycle regulation in the G1 phase: a promising target for the development of new chemotherapeutic anticancer agents. Curr. Med. Chem. 8, 1487–1503 [DOI] [PubMed] [Google Scholar]
- 66. Huang Y., Wu G., Fan H., Ye J., Liu X. (2013) Electroacupuncture promotes chondrocyte proliferation via accelerated G1/S transition in the cell cycle. Int. J. Mol. Med. 31, 1443–1448 [DOI] [PubMed] [Google Scholar]
- 67. Uttam S., Bista R. K., Staton K., Alexandrov S., Choi S., Bakkenist C. J., Hartman D. J., Brand R. E., Liu Y. (2013) Investigation of depth-resolved nanoscale structural changes in regulated cell proliferation and chromatin decondensation. Biomed. Opt. Express 4, 596–613 [DOI] [PMC free article] [PubMed] [Google Scholar]
- 68. Lu L., Song H. F., Zhang W. G., Liu X. Q., Zhu Q., Cheng X. L., Yang G. J., Li A., Xiao Z. C. (2012) Potential role of 20S proteasome in maintaining stem cell integrity of human bone marrow stromal cells in prolonged culture expansion. Biochem. Biophys. Res. Commun. 422, 121–127 [DOI] [PubMed] [Google Scholar]
- 69. Lu L., Song H. F., Wei J. L., Liu X. Q., Song W. H., Yan B. Y., Yang G. J., Li A., Yang W. L. (2014) Ameliorating replicative senescence of human bone marrow stromal cells by PSMB5 overexpression. Biochem. Biophys. Res. Commun. S0006–291X [DOI] [PubMed] [Google Scholar]
- 70. Cohen-Fix O. (2010) Cell biology: Import and nuclear size. Nature 468, 513–516 [DOI] [PMC free article] [PubMed] [Google Scholar]
- 71. van Zanten M., Koini M. A., Geyer R., Liu Y., Brambilla V., Bartels D., Koornneef M., Fransz P., Soppe W. J. (2011) Seed maturation in Arabidopsis thaliana is characterized by nuclear size reduction and increased chromatin condensation. Proc. Natl. Acad. Sci. U.S.A. 108, 20219–20224 [DOI] [PMC free article] [PubMed] [Google Scholar]
- 72. Levy D. L., Heald R. (2010) Nuclear size is regulated by importin alpha and Ntf2 in Xenopus. Cell 143, 288–298 [DOI] [PMC free article] [PubMed] [Google Scholar]
Associated Data
This section collects any data citations, data availability statements, or supplementary materials included in this article.