

Abstract
Epithelial ovarian cancer is the fifth most common cause of cancer in women worldwide bearing the highest mortality rate among all gynecological cancers. Cell membrane glycans mediate various cellular processes such as cell signaling and become altered during carcinogenesis. The extent to which glycosylation changes are influenced by aberrant regulation of gene expression is nearly unknown for ovarian cancer and remains crucial in understanding the development and progression of this disease. To address this effect, we analyzed the membrane glycosylation of non-cancerous ovarian surface epithelial (HOSE 6.3 and HOSE 17.1) and serous ovarian cancer cell lines (SKOV 3, IGROV1, A2780, and OVCAR 3), the most common histotype among epithelial ovarian cancers. N-glycans were released from membrane glycoproteins by PNGase F and analyzed using nano-liquid chromatography on porous graphitized carbon and negative-ion electrospray ionization mass spectrometry (ESI-MS). Glycan structures were characterized based on their molecular masses and tandem MS fragmentation patterns. We identified characteristic glycan features that were unique to the ovarian cancer membrane proteins, namely the “bisecting N-acetyl-glucosamine” type N-glycans, increased levels of α 2–6 sialylated N-glycans and “N,N′-diacetyl-lactosamine” type N-glycans. These N-glycan changes were verified by examining gene transcript levels of the enzymes specific for their synthesis (MGAT3, ST6GAL1, and B4GALNT3) using qRT-PCR. We further evaluated the potential epigenetic influence on MGAT3 expression by treating the cell lines with 5-azacytidine, a DNA methylation inhibitor. For the first time, we provide evidence that MGAT3 expression may be epigenetically regulated by DNA hypomethylation, leading to the synthesis of the unique “bisecting GlcNAc” type N-glycans on the membrane proteins of ovarian cancer cells. Linking the observation of specific N-glycan substructures and their complex association with epigenetic programming of their associated synthetic enzymes in ovarian cancer could potentially be used for the development of novel anti-glycan drug targets and clinical diagnostic tools.
Ovarian cancer is the fifth most common cause of cancer in women worldwide with the highest mortality rate among all gynecological cancers (1). Most patients are often diagnosed when the disease has already metastasized to distant sites, resulting in a poor 5-year survival rate of 15–30% when diagnosed at the advanced FIGO stages III-IV (2, 3). This poor prognosis is primarily attributed to difficulties in detecting the disease at an early stage, lack of noticeable early symptoms and inadequate screening methods. The most widely used clinical tumor marker for the diagnosis and management of this disease is CA125, a membrane-associated glycoprotein. However, its limited sensitivity and specificity impede the detection of early stage ovarian cancers (4–6).
Cellular glycosylation is a highly organized process in which the addition and modification of sugar or glycan residues on proteins and lipids are regulated by a large network of glycosyltransferases and glycosidases that are present in all tissues and cell types (7). The field of glycomics (study of glycans and glycan modifications) holds considerable promise as studies have begun to unravel the role of glycosylation in cancer (8–10). Upon malignant transformation, some of the enzymes in the glycosylation pathways are altered in their expression or activity and are thought to be associated with critical aspects of tumor development and metastasis. For example, β 1–6-N-acetyl-glucosaminyltransferase (GnT-V), which is responsible for the expression of tri- or tetra-antennary β 1–6-GlcNAc-bearing N-glycans on the cell surface and secreted glycoproteins, is often overexpressed in various cancers and has been correlated with higher invasive potential (11), metastasis (12), vascular remodeling (13) and tumor growth (14).
Recent developments in mass spectrometric methodologies and ionization techniques have also significantly improved over the last decade, thereby facilitating the structural analysis of glycans (15, 16). Furthermore, the development of glyco-bioinformatics databases and tools such as UniCarb KB (17), GlycoMod (18), GlycoWorkBench (19), GlycReSoft (20), and Multiglycan (21) have accelerated the pace of glycan characterization. In ovarian cancer, the majority of studies investigating N-glycans have been performed using serum (22–25), in which significant cancer-associated changes such as increased levels of branching of the N-glycans attached to glycoproteins (24) and increased sialylation of N-glycopeptides (25) have been found. As 90% of ovarian cancers are of epithelial origin (26), an overview of the glycosylation landscape on cancer cell surface membrane glycoproteins is especially interesting as they have the potential to be used diagnostically, prognostically, and therapeutically (27).
In this study, we examined specific N-glycan changes on glycoproteins from non-cancerous ovarian surface epithelial and ovarian cancer cell lines based on their membrane N-glycomic profiles. In addition, we performed a gene expression analysis of relevant glycosyltransferases and evaluated the potential epigenetic influence on glycosyltransferase-encoding genes to better understand their complex association with cell surface glycosylation. The link between aberrant glycosylation and epigenetics in cancer is an emerging area of research that still remains poorly understood (28, 29). Unlike irreversible genetic changes that affect the activity of these enzymes, epigenetic modifications can potentially be reversed by therapies such as de-methylation, which may be able to target defective glycosylation pathways to prevent metastasis in cancer (30). Hence, the specific glycan structural and synthetic alterations reported here serve as a preface toward understanding the key steps involved in the development and progression of ovarian cancer via the regulation of specific glycosyltransferases and the expression of their corresponding glycan structural epitopes.
EXPERIMENTAL PROCEDURES
Materials
N-Glycosidase F (PNGase F, recombinant clone derived from Flavobacterium meningosepticum and expressed in Escherichia coli) and protease inhibitor mixture tablets were purchased from Roche Diagnostics (Basel, Switzerland). α 2–3 sialidase enzyme (Glyko® Sialidase S, recombinant derived from Streptococcus pneumonia and expressed in Escherichia coli) was purchased from Prozyme (Hayward, CA). Immobilin-P polyvinylidene fluoride (PVDF, 0.2 μm) was obtained from Millipore (Billerica, MA). Microtiter plates (Corning Costar® 96-well flat bottom) were purchased from Sigma Aldrich (St. Louis, MO). Cation exchange resin beads (AG50W-X8) was obtained from BioRad (Hercules, CA), and PerfectPure C18 Zip Tips were from Eppendorf (Hamburg, Germany). Mycoplasma detection kit VenorGeM® Mycoplasma Detection Kit was purchased from Minerva Biolabs GmbH (Berlin, Germany). RNA extraction NucleoSpin RNAII kit was obtained from Macherey & Nagel GmbH (Duren, Germany). Proteinase K was purchased from Finnzymes, ThermoFisher Scientific (Waltham, MA). EZ DNA Methylation-Gold™ Kit for bisulfite conversion was from Zymo Research (Irvine, CA). 5-aza-2′-deoxycytidine (5-Aza)1 and primers were purchased from Sigma Aldrich (St. Louis, MO). Tris-hydrochloride (Tris-HCl), sodium chloride (NaCl), potassium hydroxide (KOH), ethylenediaminetetraacetic acid (EDTA), Triton X-114, polyvinyl polypyrrolidone 40,000 (PVP40), and sodium borohydride (NaBH4) were obtained from Sigma Aldrich (St. Louis, MO). Other reagents and solvents such as methanol, ethanol, and acetonitrile were of HPLC or LC/MS grade.
Cell Culture Preparation
Serous ovarian cancer cell lines (SKOV 3, IGROV 1, A2780, and OVCAR 3) were obtained from ATCC (Manassas) and were cultured in RPMI 1640 medium, supplemented with 10% fetal bovine serum. Normal, non-cancerous ovarian surface epithelial cell lines (HOSE 6.3 and HOSE 17.1) were obtained from the Garvan Research Institute (Sydney, Australia) and maintained in MCDB 105: Medium 199 (1:1, v/v) containing 10% fetal bovine serum (31). All cells were grown to 70% confluency at 37 °C in 5% CO2. Detailed characteristics of the non-cancerous and cancerous cell lines used in this study are listed in supplemental Table S1. For extraction of genomic DNA and total RNA, cells were lysed directly after washing without harvesting by trypsinization. All cultures were free of mycoplasma, as determined by qualitative PCR using VenorGeM® Mycoplasma Detection Kit.
Cell Membrane Preparation and Triton X-114 Phase Partitioning of Membrane Proteins
Approximately 4 × 10⁷ cells were washed twice with PBS and pelleted through centrifugation at 2500 × g for 20 mins to remove excess culture media. Cell pellets were re-suspended with 2 ml of lysis buffer (50 mm Tris-HCl, 100 mm NaCl, 1 mm EDTA, and protease inhibitor at pH 7.4) and stored on ice for 20 mins. The cells were lysed using a Polytron homogenizer (Omni TH, Omni International Inc, Kennesaw, GA) for 15 mins. Cellular debris and unlysed cells were removed by centrifugation at 2000 × g for 20 mins at 4 °C. The supernatant was collected and diluted with 2 ml of Tris binding buffer (20 mm Tris-HCl, and 100 mm NaCl at pH 7.4) and sedimented by ultracentrifugation at 120,000 × g for 80 mins at 4 °C. The supernatant was discarded and 140 μl of Tris binding buffer was added into each sample to re-suspend the membrane pellet [modified from (32)]. A volume of 450 μl of Tris binding buffer containing 1% (v/v) Triton X-114 was added to the suspended mixture, homogenized by pipetting and chilled on ice for 10 mins. Samples were heated at 37 °C for 20 mins and further subjected to phase partitioning by centrifugation at 200 × g for 3 mins. The upper aqueous layer was carefully removed and stored at −20 °C until further analysis. The lower detergent layer containing the membrane proteins was mixed with 1 ml of ice-cold acetone and left overnight at −20 °C. Precipitated membrane proteins were pelleted by centrifugation at 1000 × g for 3 mins and solubilized in 10 μl of 8 m urea (32).
Enzymatic Release of N-glycans from Cell Membrane Proteins
N-glycans were prepared as previously described (33). Briefly, membrane proteins and glycoprotein standard (10 μg of fetuin) were spotted (2.5 μl × 4 times) onto a polyvinylidene difluoride (PVDF) membrane (Sequi Blot 0.2 μm, Millipore). The PVDF membrane was dried overnight at room temperature prior to staining and de-staining of the bound membrane proteins. The stained protein spots were cut and placed in separate wells of a 96-well microtiter plate and 100 μl of blocking buffer was added to each well. Upon removing the blocking buffer, the wells were then washed with MilliQ water and PNGase F enzyme (2 μl of 1 U/μl PNGase F and 8 μl of MilliQ water) was added to each well. A volume of 10 μl MilliQ water was added prior to an overnight incubation at 37 °C. The 96-well microtiter plate was sealed with parafilm to avoid sample evaporation. After sonication of the plate for 10 mins, ∼20 μl of N-glycans were recovered from each well and combined with washings (50 μl of MilliQ water, twice) from the sample wells. To ensure a complete regeneration of the reducing terminus of the released N-glycans, 20 μl of 100 mm ammonium acetate (pH 5.0) was added to each sample (∼120 μl) at room temperature for 1 h. After evaporation of the samples, the released N-glycans were reduced to alditols with 10 μl of 2 m NaBH4 in 50 mm KOH and 10 μl of 50 mm KOH at 50 °C for 2 h and the reduction was quenched using 2 μl of glacial acetic acid.
Purification of N-glycan Alditols Derived from Cell Membrane Proteins
The N-glycan alditols were desalted using cation exchange columns prepared in-house. Approximately 45 μl of cation exchange resin beads (AG50W-X8) were deposited onto reversed phase μ-C18 ZipTips (Perfect Pure, Millipore) placed in individual microfuge tubes. The tubes were then subjected to a brief spin followed by a series of individual prewashing steps as described previously (33). Approximately 20 μl of N-glycan alditols were applied to the column, eluted with MilliQ water (50 μl, twice) and dried. Residual borate was removed by drying the samples under vacuum after the addition of methanol (100 μl, thrice). The purified N-glycan alditols were re-suspended in 15 μl of MilliQ water prior to mass spectrometry analysis.
LC-ESI-MS/MS of Released N-glycan Alditols
N-glycans were analyzed by nanoLC-MS/MS using an ion-trap mass spectrometer (LC/MSD Trap XCT Plus Series 1100, Santa Clara, CA), which was connected to an ESI source (Agilent 6330). Samples were injected onto a Hypercarb porous graphitized carbon capillary column (5 μm Hypercarb KAPPA, 180 μm x 100 mm, Thermo Hypersil, Runcorn, UK) using an Agilent auto-sampler (Agilent 1100). The separation of N-glycans was carried out over a linear gradient of 0–45% (v/v) acetonitrile/10 mm ammonium bicarbonate for 85 mins followed by a 10 min wash-step using 90% (v/v) acetonitrile/10 mm ammonium bicarbonate at a flow rate of 2 μl/min. The sample injection volume was 7 μl and the MS spectra were obtained within the mass range of m/z 200-m/z 2200. The temperature of the transfer capillary was maintained at 300 °C and the capillary voltage was set at 3 kV. N-glycans were detected in the negative ionization mode as [M-H]− and [M-2H]2− ions. The MS data was analyzed and quantitated using Compass Data Analysis Version 4.0 software (Bruker Daltonics). Monosaccharide compositions of the measured monoisotopic masses were determined using the GlycoMod tool (18) available on the ExPASy server (http://au.expasy.org/tools/glycomod) with a mass tolerance of ±0.5 Da). The proposed glycan structures were manually assigned and interpreted from the tandem MS fragmentation spectra and further characterized with the GlycoWorkBench software tool (19). In addition, the web-based LC-MS/MS database, UniCarb KB (17), was also utilized to confirm fragmentation and retention time of N-glycans based on previously reported glycan structures that were available in the online library (34–37). The assignment of sialic acid linkages on the N-glycan structures were carried out through specific exoglycosidase treatment described below. Furthermore, N-glycans from fetuin were also used to confirm these linkages as previously described (38). Other structural features such as the “bisecting GlcNAc” structures were characterized from diagnostic fragment ions previously described in negative ion mode fragmentation of N-glycans (39–41).
Data Processing and Statistical Analysis of N-glycans
The MS ion intensity of each N-glycan composition was relatively quantified based on the peak areas of their extracted ion chromatogram (EIC) and expressed as a percentage of summed ion intensities for total N-glycans within each cell line. The glycan structures were classified into four major categories [high mannose/oligomannose, hybrid, complex (neutral and sialylated), and core fucosylated] based on the nomenclature proposed by Stanley et al. (2009) (42). Following normalization to 100%, the MS ion intensities were averaged for three replicates of each cell line and subjected to one-way analysis of variance (ANOVA) using SPSS Version 19.0 to assess their statistical significance at p < 0.05.
Specific α 2–3 Sialidase Digestion of N-glycan Samples
To verify the sialic acid linkages, 5 μl N-glycans (∼30 μg of membrane proteins) were digested with 2 μl of α 2–3 sialidase S (2 mU) in 2 μl of 5X reaction buffer and made up to 10 μl with water. The reaction mixture was vortexed and incubated at 37 °C overnight prior to LC-ESI-MS analysis. A matched untreated glycan sample (3 μl) was made up to 10 μl with water and used as a control for comparison.
Compositional Monosaccharide Analysis
Compositional analysis of monosaccharides was performed to verify the presence of the monosaccharide residue, N-acetyl-galactosamine, on the released N-glycans of the non-cancerous and cancerous cell lines. For neutral amino monosaccharides, 20 μl of released N-glycan alditols were hydrolyzed by treatment with 4 m HCl (100 μl of 8 m HCl in 80 μl MilliQ water) at 100 °C for 6 h. Hydrolyzed samples were evaporated to dryness and reconstituted in 50 μl of internal standard (0.1 m 2-deoxy-d-glucose). Monosaccharide content was determined using a high-performance anion-exchange chromatography with pulsed amperometric detection (HPAEC-PAD) system that comprised of the Bio-LC (Dionex, Thermo Scientific, Sunnyvale, CA) equipped with gradient pumps (GS50, Dionex) and a pulsed amperometric detector (ED50A, Dionex). 20 μl of amino monosaccharides were injected for each sample in duplicate and separated isocratically on a Dionex CarboPac™ PA-10 column (2 × 250 mm, Thermo Scientific) at a flow rate of 1.0 ml/min using 12 mm NaOH. Data was collected and analyzed using Chromeleon software (SP5 Build 1914, Dionex Version 6.70, Dionex Corporation).
Total RNA and Genomic DNA Extraction
In order to examine the potential gene expression of associated glycosyltransferases (n = 17) and reference genes (n = 3), non-cancerous ovarian surface epithelial and ovarian cancer cells were grown in 6-well plates (NUNC, Thermo Fisher Scientific, Roskilde, Denmark). Prior to cell lysis, cells were washed twice with PBS, and the cellular contents of two wells of a 6-well plate were combined. Total RNA extraction was performed using the NucleoSpin RNAII kit (Macherey-Nagel, Germany) according to the manufacturer's instructions. RNA was eluted in 50 μl of RNase free water. Total RNA was measured at A260/230 nm and A260/280 nm using the NanoDrop ND-1000 spectrophotometer (Thermo Fisher Scientific, Denmark). RNA integrity was confirmed via an electropherogram (Agilent Bioanalyzer RNA 6000 Nano).
For genomic DNA extraction, the cellular contents of two wells of a 6-well plate were combined. Cells were lysed using 250 μl of lysis buffer (20 mm Tris-HCl, 4 mm Na2EDTA, and 100 mm NaCl) followed by the addition of 25 μl of 10% (w/v) SDS. The lysed cell suspensions were vortexed vigorously and subsequent Proteinase K digestion (2.5 μl) was performed for a minimum of 2 h at 55 °C. Residual undigested proteins were precipitated using 200 μl of 5.3 m NaCl followed by 13,000 × g centrifugation for 30 min at 4 °C. Supernatant was transferred to a new microfuge tube and an equal volume of ice-cold isopropanol was added. DNA was precipitated by inverting tubes several times. Precipitated DNA was washed with 70% ethanol and dissolved in 10 mm of Tris-HCl at pH 8.5. DNA concentration was measured using spectrophotometry as described above for RNA.
Reverse Transcription (RT) and Quantitative PCR (qPCR)
Total RNA (1 μg) was reverse-transcribed using the iScript Reverse Transcription Supermix for RT-qPCR (Bio-Rad Laboratories, Australia) in a total volume of 20 μl according to the manufacturer's instructions. The complementary DNA (cDNA) was stored at −20 °C until further use. RT-qPCR was performed in concordance to MIQE guidelines (43). Reference genes were selected as previously described (44) and listed in Table II. Target gene primers were designed by QuantPrime (45). Primer sequences were cross-checked using the web-based tool in-silico PCR (http://genome.ucsc.edu/cgi-bin/hgPcr) on the human genome browser at UCSC (46) against gene and genomic targets. RT-qPCR was performed on the Applied Biosystems 7500 Fast Real Time PCR system (Applied Biosystems, Switzerland) in 96-well microtitre plates for all six cell lines (SKOV 3, IGROV 1, A2780, OVCAR 3, HOSE 6.3 and HOSE 17.1). Optimal reaction conditions were obtained using 1× SensiFast™ SYBR with low ROX as the reference dye (Bioline, Biolabo, Switzerland), 400 nm specific sense, 400 nm specific antisense primer, RNase/DNase-free water, and cDNA template in a final reaction volume of 10 μl. Amplifications were performed starting with a 30 s enzyme activation at 95 °C, followed by 40 cycles of denaturation at 95 °C for 5 s, and then annealing/extension at 60 °C for 30 s. At the end of each run, a melting curve analysis was performed between 65–95 °C. All samples and negative controls were amplified in triplicates and the mean value obtained was then used for further analysis.
Table II. Established target gene primers and reference genes. Comprehensive list of primers used for quantitative RT-qPCR and parameters providing efficiency (E) and correlation coefficient (R2) for each primer pair on target and reference genes applied in this study. Reference genes were established by Jacob et al. (2013) (44).
| Symbol | Gene name | Accession number | Chromosomal location | Forward primer 5′-3′ | Reverse primer 5′-3′ | E in % | R2 |
|---|---|---|---|---|---|---|---|
| MGAT3 | mannosyl (β-1,4-)-glycoprotein β-1,4-N-acetylglucosaminyl transferase | NM_002409.4 | 22q13.1 | GGGATGAAGATGAGACGCTACAAG | AGGACAGGGTCTTGAAGAAGTGC | 114.3 | 0.985 |
| ST6GAL1 | β-galactosamide α-2,6-sialyltransferase 1 | NM_173217.2 | 3q27-q28b | CCATCCTCTGGGATGCTTGGTATC | ACGTCAGTCTTGCGCTTGGATG | 102.9 | 0.991 |
| ST3GAL1 | β-galactoside α-2,3-sialyltransferase 1 | NM_173344.2 | 8q24.22 | AGTCACGACTTTGTCCTCAGGATG | TGGTCTTGGTCCCAACATCAGC | 83.3 | 0.981 |
| ST3GAL2 | β-galactoside α-2,3-sialyltransferase 2 | NM_006927.3 | 16q22.1 | GCATGTGTGTGATGAGGTGAACG | TTCTCCCAGTAGTGGTGCCAGTTG | 102.6 | 0.999 |
| ST3GAL3 | β-galactoside α-2,3-sialyltransferase 3 | NM_174963 | 1p34.1 | AGTGGCAGGACTTTAAGTGGTTG | AGAAGCCATCCGATGCACTCAC | 91.4 | 0.963 |
| ST3GAL4 | β-galactoside α-2,3-sialyltransferase 4 | NM_006278.2 | 11q24.2 | CAGCCACGGAAGATTAAGCAGAAG | GCAATGTGCACCAAGTCACAGAG | 111.8 | 0.999 |
| ST3GAL5 | β-galactoside α-2,3-sialyltransferase 5 | NM_001042437.1 | 2p11.2 | TGTGGACCCTGACCATGTAAAGAG | TGGCAAACTTGGGACGACATTCC | 103.6 | 0.995 |
| FUT2 | α1–2 fucosyltransferase 2 | NM_000511.5 | 19q13.3 | TCACCGATGCTGGAAGGGTTTC | AACGACCAGCATGGCTTCTCTC | 118.2 | 0.992 |
| FUT3 | α1–3/4 fucosyltransferase 3 | NM_001097640.1 | 19p13.3 | TCAGACAGGTCCAAGTTCAAGCC | TTACAGTCGATCCCACCTGTACCC | 107.8 | 0.997 |
| FUT4 | α1–3 fucosyltransferase 4 | NM_002033.3 | 11q21 | TTTACCGAGGAAGGAGCCAAGG | GCTGGTTCTGCCACTGCTATTG | 100.0 | 0.999 |
| FUT5 | α1–3 fucosyltransferase 5 | NM_002034.2 | 19p13.3 | TGCATCACTATGGGTGTGACCTC | TGAGGCATCGCAACACATCCAC | 120.5 | 0.952 |
| FUT8 | α1–6 fucosyltransferase 8 | NM_178155 | 14q24.3 | GGCCTGTAAGTGAGACATGCAC | TTTGTCCTTCACTTCACCTGACC | 89.4 | 0.998 |
| FUT9 | α1–3 fucosyltransferase 9 | NM_006581.3 | 6q16 | TGGCCTCATTAGCCACCTTCAG | TGGACAAGGATGGCATCTTCAGG | 93.1 | 0.987 |
| B4GALNT1 | beta-1,4-N-acetyl-galactosaminyl transferase 1 | NM_001478.3 | 12q13.3 | GAGCCTTCAGGCAGCTTCT | CCTAGGGAGGCAGTCAGGTT | 98.1 | 0.910 |
| B4GALNT3 | beta-1,4-N-acetyl-galactosaminyl transferase 3 | NM_173593.3 | 12p13.33 | TGGCATAGACCTCGTGAAGGAC | ACAGTGCTTCCGAATGGCATC | 100.4 | 0.998 |
| B3GALNT1 | beta-1,3-N-acetyl-galactosaminyltransferase 1 | NM_003781.3 | 3q25 | TGCTCTATCACGTGGTGCTCTC | ACGCGAGCCGAAGGTTCTTTAC | 116.8 | 0.997 |
| B3GALNT2 | beta-1,3-N-acetyl-galactosaminyltransferase 2 | NM_152490.2 | 1q42.3 | TGCCTTACTGAAGGAGGAAAGCAG | AGCTCGTTGTTTCCACAGTCCATC | 106.3 | 0.986 |
| HSPCB | Heat shock protein 90 kDa alpha (cytosolic) | NM_007355 | 6p12 | TCTGGGTATCGGAAAGCAAGCC | GTGCACTTCCTCAGGCATCTTG | 103.1 | 0.998 |
| YWHAZ | Tyrosine 3-monooxygenase/tryptophan 5-monooxygenase activation protein, zeta polypeptide | NM_003406 | 8q23.1 | ACTTTTGGTACATTGTGGCTTCAA | CCGCCAGGACAAACCAGTAT | 101.2 | 0.998 |
| SDHA | Succinate dehydrogenase complex, subunit A | NM_004168 | 5p15 | TGGGAACAAGAGGGCATCTG | CCACCACTGCATCAAATTCATG | 105.6 | 0.994 |
To compare the RNA transcript levels of six cell lines for 17 targeted genes, cycle of quantification (Cq) values were generated directly at a specific threshold. The fluorescence signals obtained at a defined RNA concentration were plotted and linear regression was performed to identify the best linear relationship representing the standard curve. The slope of the linear equation was applied to calculate the efficiency according to the equation, E = (10[−1/slope]-1) × 100. Raw data, including the melting and amplification curves, generated by the ABI 7500 software Version 2.0.6. (Applied Biosystems, Switzerland) were analyzed. Raw data were extracted and further data analysis was performed using the R statistical programming language Version 2.15.1 (http://CRAN.R-project.org).
5-aza-2′-deoxycytidine Treatment
To investigate the potential influence of DNA methylation on MGAT3 and ST6GAL1 expression, the DNA methyltransferase inhibitor 5-aza-2′-deoxycytidine (5-Aza) was applied to all cell lines as follows: 105 cells were seeded in 6-well plates (NUNC, Thermo Fisher Scientific, Roskilde, Denmark) and incubated at 37 °C for 24 h. Culture medium was removed every 24 h and replaced by new medium containing 2.5 μm 5-Aza in 50% (v/v) acetic acid. Samples were harvested after 24 h, 48 h and 72 h of treatment. Total RNA was extracted as described above. Mock control cells were treated with 50% (v/v) acetic acid at a dilution identical to that of 5-Aza treated cells. The histone deacetylase inhibitor trichostatin A (TSA) was used as additional control (to exclude involvement of histone methylation) in which cells were treated with 5.0 μm TSA.
RESULTS
To identify specific membrane N-glycan changes in serous ovarian cancer cell lines (SKOV 3, IGROV 1, A2780, and OVCAR 3) and non-cancerous ovarian surface epithelial cell lines (HOSE 6.3 and HOSE 17.1), global glycosylation profiles of the glycans released from total membrane proteins by PNGase F were acquired using mass spectrometry. The glycan structures were assigned based on manual interpretation of the tandem MS fragment spectra.
Relative Quantitation of N-glycans of Membrane Proteins from Non-cancerous and Cancerous Cell Lines
The LC-ESI-MS/MS glycomic profiles were compared between the two non-cancerous and four cancerous cell lines to identify specific N-glycan alterations in terms of compositional and structural features. The major difference in structures between the N-glycans on membrane proteins from non-cancerous and cancerous cell lines are indicated in the representative glycomic profiles of one non-cancerous (HOSE 6.3) and one ovarian cancer (SKOV 3) cell line (Fig. 1).
Fig. 1.

Representative glycomic profiles of N-glycans released from membrane proteins of HOSE 6.3 and SKOV 3 cell lines. An overview of the representative average MS N-glycan profiles in the range of m/z 600–1400 of the non-cancerous human ovarian surface epithelial (HOSE 6.3) and ovarian cancer cell line (SKOV 3) membrane glycoproteins (LC elution time: 30 to 70 mins). The N-glycan structures were identified by tandem MS and are represented mainly by the doubly charged species ion, m/z [M-2H]2−. Singly charged [M-H]− ions with m/z 1235.0 and m/z 1397.5 are also shown in the figure. Number of isomers corresponding to structurally resolved mass ions is indicated in parentheses (). N-glycan masses that were not structurally resolved and determined to consist of two or more isomer(s) are indicated with asterisks (*).
In total, 53 individual N-glycan masses (including structural and compositional isomers) were detected across all six cell lines of which 33 N-glycan masses were present in all the non-cancerous and cancerous cell lines (Table I). In order to determine if there were quantitative differences between these glycans in the membrane proteins of the non-cancerous and cancerous cell lines, the common N-glycans present in both non-cancerous and cancerous cell lines were statistically analyzed based on their N-glycan classes [high mannose, hybrid, complex (neutral and sialylated) and core fucosylated]. As shown in Fig. 2, we observed significantly higher (p < 0.05) levels of high mannose N-glycans in the cancerous cell lines as compared with the non-cancerous cell lines with correspondingly lower levels of complex neutral (p < 0.0001) and complex sialylated N-glycans (p < 0.05) observed in ovarian cancer when compared with non-cancerous cell lines. Similarly, core fucosylated N-glycans were also found to be significantly lower (p < 0.01) in ovarian cancer cell lines as compared with the non-cancerous cell lines. No significant differences were observed in the overall expression of N-glycans in the total hybrid N-glycan subgroup. O-glycosylation was also investigated by reductive beta-elimination release from the membrane proteins of all the mentioned cell lines (non- cancer and cancerous) followed by PGC LC MS/MS. Less than five structures consisting of Core 1 and Core 2 O-glycans were found and there were no significant changes in the relative intensities of these structures between the non-cancer and cancer cell lines. Hence, the regulation of O-glycosylation was not further investigated.
Table I. Proposed N-glycan structures detected on the membrane proteins of non-cancerous and ovarian cancer cells. N-glycan structures released from non-cancerous and ovarian cancer cell membrane proteins were separated by PGC-LC-ESI and their structures were assigned based on MS/MS fragmentation (where possible), retention time differences and biological pathway constraints. Structures were depicted according to the CFG (Consortium of Functional Glycomics) notation with linkage placement to indicate linkages for sialic acid and fucose residues. Specific linkages corresponding to Gal-GlcNAc (Type 1/Type 2) lactosamine linkages were not distinguished. N-glycan masses that were not structurally resolved and determined to consist of two or more isomer(s) are indicated with asterisks (*). Values represent mean ± S.D. of three separate experimental replicates.


Fig. 2.
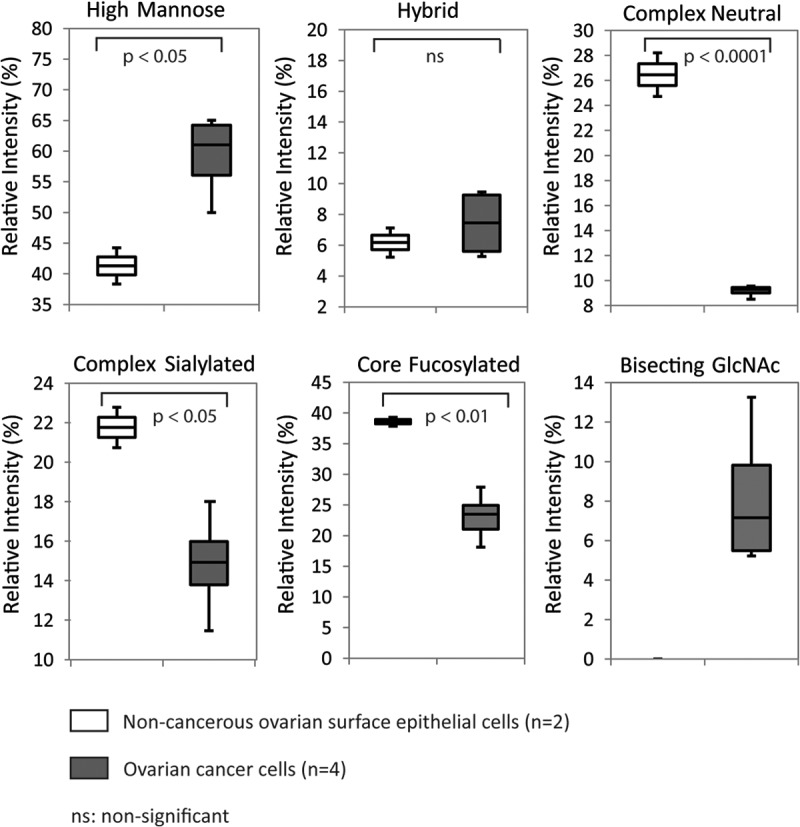
Quantitation of relative abundances based on structural N-glycan type (as shown in Table I). Box plots indicating changes in the relative ion intensities of 33 common N-glycans (high mannose, hybrid, complex neutral, complex sialylated, and core fucosylated) expressed in two non-cancerous human ovarian surface epithelial cells and four ovarian cancer cell lines. Levels of significant differences are indicated by respective p values for all categories except for bisecting GlcNAc. Data represents the mean of three technical replicates.
α 2–6 Sialylation
Upon performing a one-way ANOVA analysis to determine quantitative differences between the non-cancerous and cancerous cell lines, each N-glycan subgroup was examined for qualitative differences arising because of the presence of specific structural isomers. Porous graphitized carbon (PGC) LC-ESI-MS enables the separation of isomers of differently linked sialylated N-glycans based on their corresponding retention times (Fig. 3). Both the complex and hybrid sialylated N-glycan subgroups were found to contain isomeric glycan structures pertaining to differences in α 2–6 or α 2–3 linked sialylation.
Fig. 3.

Representative extracted ion chromatograms (EIC) of monosialylated N-glycans. A, PGC- LC allows for the separation of α 2–6 and α 2–3 sialylated N-glycans based on retention time. The EICs obtained from the ovarian cancer cell line, IGROV 1 depict two major monosialylated N-glycans (with and without fucose), m/z [965.9]2− [(Neu5Ac)1(Hex)2(HexNAc)2+(Man)3(GlcNAc)2] and m/z [1038.9]2− [(Neu5Ac)1(Hex)2(HexNAc)2(dHex)1 +(Man)3(GlcNAc)2], which display α 2–3 and α 2–6 sialylated isomers at separate retention times (i). To orthogonally confirm the identity of the isomers containing α 2–6 linked sialic acids, released N-glycans from the membrane proteins of IGROV1 cells were treated with α 2–3-linked sialidase. The lower panel depicts the loss of the α 2–3 sialylated isomers for both N-glycans (ii). B, The EICs of three monosialylated hybrid N-glycans with m/z [864.3]2−, m/z [945.3]2− and m/z [937.3]2 are represented and the separate retention times for isomers with α 2–6-linked and α 2–3-linked sialic acid are illustrated in (1) the non-cancerous epithelial cells (HOSE 6.3) and (2) ovarian cancer cell line (SKOV 3).
For example, the monosialylated biantennary complex N-glycan with m/z [1038.9]2− detected in the cancer cell line, IGROV 1 [Fig. 3A(i)] consists of the monosaccharide composition (Neu5Ac)1(Hex)2 (HexNAc)2(dHex)1 +(Man)3(GlcNAc)2 and comprises of two isomers; namely a sialylated, core fucosylated biantennary N-glycan with the Neu5Ac (sialic acid) linked either by a α 2–6 or α 2–3 linkage to the terminal Gal residue located on either arm. Sialylated isomers can be distinguished based on retention time differences as previously described (38, 40, 47) with the α 2–3 linked isomers having a stronger affinity to PGC and thereby eluting later as compared with the α 2–6 linked sialylated glycans. For the above N-glycan isomers, the α 2–6 linked sialic acid glycan isomers were shown to elute from the porous graphitized carbon column ∼7–8 min earlier than the α 2–3 linked glycan isomers. The linkages were orthogonally verified using α 2–3 sialidase that resulted in the loss of the late eluting N-glycan peaks bearing the α 2–3-linked sialic acid [Fig. 3A(ii)]. This α 2–6 monosialylated fucosylated biantennary complex N-glycan (m/z [1038.9]2−) and the corresponding monosialylated, non-fucosylated structure of m/z [965.9]2− [(Neu5Ac)1(Hex)2 (HexNAc)2 +(Man)3(GlcNAc)2] was observed only in the ovarian cancer cells (supplemental Fig. S1A and S1B). The disialylated biantennary complex N-glycan with m/z [1184.5]2− [(Neu5Ac)2(Hex)2(HexNAc)2 (dHex)1+(Man)3(GlcNAc)2] (supplemental Fig. S1C) was also present with additional isomers in the ovarian cancer cells. As represented in Fig. 3B(i) and (ii), the extracted ion chromatograms (EIC) of N-glycans in the hybrid category also revealed the presence of additional isomers of the α 2–6 monosialylated N-glycan isomers with m/z [864.3]2−[(Neu5Ac)1(Hex)2 (HexNAc)1 +(Man)3(GlcNAc)2], m/z [945.3]2− [(Neu5Ac)1(Hex)3 (HexNAc)1 +(Man)3 (GlcNAc)2] and m/z [937.3]2 [(Neu5Ac)1 (Hex)2 (HexNAc)1(dHex)1+(Man)3(GlcNAc)2] in all ovarian cancer cell lines but not in the non-cancerous cells.
Bisecting GlcNAc
Apart from the 33 N-glycans common to all analyzed cell lines, we identified six unique N-glycans (m/z [840.8]2−, m/z [913.9]2, m/z [921.9]2−, m/z [994.9]2−, m/z [1177.5]2−, and m/z [1140.5]2−), which were present on the cell membrane proteins of all four cancerous cell lines, but not on the non-cancerous cell lines (Table I; supplemental Fig. 2). These N-glycans, representing ∼5%-13% of total relative ion intensities of all four ovarian cancer cell lines (Fig. 2) consisted of bi- and tri-antennary N-glycans that was found to have a bisecting GlcNAc (N-acetyl glucosamine) residue attached in a β 1–4 linkage to the innermost mannose of the N-glycan core. This linkage is catalyzed by the action of a specific enzyme, β 1–4-N-acetyl-glucosaminyltransferase III (GnT-III) encoded by the gene MGAT3. The structural assignment of the bisecting-type N-glycans was carried out based on the MS/MS fragmentation described by Harvey (48). In negative mode fragmentation spectra of N-glycans, the D ion arises from the loss of the chitobiose core and the substituents forming the 3-antennae; thus the D ion mass corresponds to the composition of the 6-arm antenna as well as the two remaining branching core mannose residues. However, in bisecting type N-glycans, there is an additional loss of the β1–4 linked GlcNAc, which results in the formation of the d-221 ion that is diagnostic for the presence of these structures. As observed in Fig. 4 (inset), the extracted ion chromatogram (EIC) of neutral bisecting GlcNAc N-glycan with m/z [994.9]2−[(Hex)2(HexNAc)3(dHex)1+(Man)3(GlcNAc)2] is seen only in the ovarian cancer cell lines (Fig. 4C–4F). When this parent ion mass was fragmented, the d-221 fragment ion mass at m/z [670.3]1−, which corresponds to the composition, Gal-GlcNAc-Man-Man - loss of H2O was observed in the MS/MS spectra of all five bisecting type N-glycan structures as shown in Supplemental Fig. S3A–S3E. An example of another the diagnostic d-221 fragment ion at m/z [508.3]1− corresponding to GlcNAc-Man-Man - loss of H2O, was also observed in the MS/MS spectrum for the N-glycan with m/z [913.9]2−(supplemental Fig. S3F).
Fig. 4.

Example of a MS2 fragment ion spectra depicting the diagnostic ions of bisecting GlcNAc type N-glycans in ovarian cancer cells. In N-glycans, the d-221 ion is formed when the bisecting GlcNAc attached to the innermost Man residue is cleaved from the 6-antenna comprising of Gal-GlcNAc-bisecting GlcNAc-Man-Man. The fragment ion resulting from this specific cleavage of the bisecting bi-antennary N-glycan shown appears at m/z [670.3]−. The insert to the right represents the extracted ion chromatogram (EIC) of neutral bisecting GlcNAc N-glycan with m/z [994.9]2− [(Hex)2(HexNAc)3 (dHex)1 +(Man)3(GlcNAc)2] in noncancerous and ovarian cancer cell lines.
LacdiNAc-type N-glycans
Several N-glycans specific to only the cell membrane proteins of SKOV 3 and IGROV 1 cell lines were also detected at low intensities, in which their monosaccharide compositions were predicted to contain a mixture of fucosylated, di-fucosylated and sialylated LacdiNAc motifs (Table I). We identified 4 N-glycans (m/z [913.9]2−, m/z [934.4]2−, m/z [1059.4]2−, and m/z [1205.0]2−) that were present in both the cell lines (supplemental Fig. S4) whereas the remaining six N-glycans (m/z [905.9]2−, m/z [986.9]2, m/z [1007.4]2−, m/z [1059.9]2−, m/z [1080.5]2−, and m/z [1132.4]2−), consisted of mono and di- fucosylated LacdiNAc motifs that were present only in the IGROV 1 cell line (supplemental Fig. S5). The representative MS/MS fragmentation ion spectra of LacdiNAc-type N-glycan (m/z [934.4]2−) as well as the fucosylated (m/z [1080.5]2−) and sialylated (m/z [1205.0]2−) LacdiNAc derivatives are shown in Fig. 5. The MS/MS fragmentation spectra, although at low intensities, contained adequate fragment ions corresponding to both glycosidic and cross ring cleavages to facilitate the identification of the LacdiNAc antennae on these N-glycans. As observed in Fig. 5A, the fragmentation spectra of the parent ion at m/z [934.4]2−[(HexNAc)4 (dHex)1+(Man)3(GlcNAc)2] contained a prominent cross ring cleavage ion arising from the non-reducing terminal end of the N-glycan structure. This 1,3A cross-ring cleavage ion at m/z [465.2]1−, also termed as F ion, has a composition of GalNAc - GlcNAc-O-CH = CH-O- (GalNAc + GlcNAc + 59−) that comprises the LacdiNAc disaccharide and two carbon atoms of the branching Man residue. Another pair of diagnostic ions that occurred as glycosidic cleavages at the non-reducing end was also observed as B/Y ions (m/z [405.2]1− and m/z [1463.6]1−), clearly providing a definitive identification of the LacdiNAc antennae. Similarly, other derivatives of the LacdiNAc motif such as the fucosylated LacdiNAc (GalNAc-(Fuc)GlcNAc) and sialylated LacdiNAc (Neu5Ac-GalNAc-GlcNAc) trisaccharides were also found to contain the B ion at m/z [551.2]1− and m/z [696.3]1− for the parent ion with m/z [1080.5]2− [(HexNAc)4 (dHex)3+(Man)3(GlcNAc)2] and m/z [1205.0]2−[(Neu5Ac)2(Hex)1(HexNAc)3(dHex)1+(Man)3(GlcNAc)2] respectively (Fig. 5B and 5C). The presence of the monosaccharide residue, N-acetyl-galactosamine (GalNAc) in the PNGase F released N-glycans was also verified through compositional monosaccharide analysis, which revealed trace amounts of GalNAc in the IGROV 1 cell line that was not detected in the other non-cancerous and cancerous cell lines (supplemental Table 2).
Fig. 5.

Representative MS2 fragment ion spectra depicting the diagnostic ions for LacdiNAc type N-glycans in ovarian cancer cells. A, Diagnostic ions characteristic for the identification of the HexNAc-HexNAc disaccharide, m/z [405.2]− and m/z [465.2]−, are illustrated for the neutral bi-antennary core fucosylated N-glycan with m/z [934.4]2− [(HexNAc)4 (dHex)1+(Man)3(GlcNAc)2]. Diagnostic ions, which are characteristic for terminal fucosylated LacdiNAc (m/z [551.2]−) and sialylated LacdiNAc ([696.3]−), are illustrated for N-glycans with m/z [1080.4]2− [(HexNAc)4 (dHex)3+(Man)3(GlcNAc)2] B, and [1205.0]2− [(Neu5Ac)2(Hex)1(HexNAc)3(dHex)1+ (Man)3 (GlcNAc)2], respectively C.
Gene Expression of Specific Glycosyltransferases in Ovarian Cancer Cell Lines
The detection of α 2–6 sialylation and bisecting GlcNAc in the N-glycans of all of the four ovarian cancer cell lines as compared with the non-cancerous cell lines may be attributed to the regulation of specific enzymes within the glycosylation pathway, specifically the α 2–6 sialylatransferase (ST6GAL 1 gene) and the bisecting GlcNAc transferase (MGAT 3 gene). Similarly, the identification of the LacdiNAc-type N-glycans, despite their low intensities, in two of the four ovarian cancer cell lines also warranted the investigation of specific gene expression of the various β 1–3/4 N-acetyl-galactosaminyltransferases (B3GALNT and B4GALNT genes). To determine this, the relative transcript abundance of these genes was investigated in the two non-cancerous and four cancerous cell lines. In addition, we also profiled five ST3Gal sialyltransferases (ST3GAL 1–5) to determine the corresponding expression of enzymes responsible for the N-glycans bearing α 2–3 linked sialic acid residues, and six α 1–2/3/4/6 fucosyltransferases (FUT2–5,8,9) that corresponded to N-glycans bearing either core and/or terminal fucosylation. According to MIQE guidelines, RNA integrity was based on the RNA integrity number (RIN) of which obtained values of A260/280 (2.08–2.10), A260/230 (1.95–2.21), and ratio 28s/18s (2.0–2.3) indicated purified and intact total RNA extracts. Each glycosyltransferase encoding gene (n = 17) and three reference genes (HSPCB, SDHA, and YWHAZ) were examined for qPCR assay performance on at least three 10-fold dilutions, ranging from a minimum of 50 pg to a maximum of 100 ng of initial total RNA. PCR efficiency was detected as being the lowest in ST3GAL1 (83.3%) and the highest in FUT5 (120.5%). The coefficient of determination (R2) was always ≥ 0.910 (Table II). The remaining candidate genes for this study, namely the α 1–3 fucosyltransferase 6 (FUT6), α 1–3 fucosyltransferase 7 (FUT7), and β 1–4 N-acetyl-galactosaminyltransferase 4 (B4GALNT4) did not reveal reliable qPCR performance because of non-detectable expression of mRNA transcripts in all investigated cell lines (n = 6) and were therefore excluded from this study.
The ΔCq of each “glyco-gene” (normalized against the logarithmic mean of reference genes) was applied by visualizing and clustering “glyco-gene” expression among the tested cell lines (Fig. 6A). The expression of ST6GAL1 (p < 0.001), MGAT3 (p < 0.001), and B4GALNT3 (p = 0.015) were significantly decreased in the non-cancerous cell lines as compared with the high expression observed in the ovarian cancer cell lines. In contrast, the non-cancerous cell lines showed significantly increased expression of ST3GAL5 compared with all ovarian cancer cell lines (p = 0.026). ST3GAL4 was abundantly expressed in both non-cancerous and ovarian cancer cell lines as compared with ST3GAL3 that had varying transcript levels. The investigation of fucosyltransferase encoding genes did not reveal any differential gene expression for core fucosylation (FUT8) and terminal fucosylation (FUT2, 4, and 5) between the non-cancerous and ovarian cancer cell lines, although a significant increase in gene expression for FUT3 and FUT9 was observed specifically in the OVCAR 3 cell line as compared with the other cell lines.
Fig. 6.

Quantitative RT-PCR of mRNA transcripts of glycosyltransferase genes and scatterplot analysis of glyco-gene expression (MGAT3 and ST6GAL1) with corresponding N-glycan structures. Gene expression levels of glycosyltransferase mRNA transcripts (n = 17) analyzed in two non-cancerous human ovarian surface epithelial cells (HOSE 6.3 and HOSE 17.1) and four ovarian cancer cell lines (SKOV 3, OVCAR 3, A2780, and IGROV 1). A, Normalized (ΔCq) and clustered “glyco gene” expression (row) among tested cell lines (column) visualized as heatmap. Dendrogram (row) shows clusters of correlating expression. Key at the right side indicates level of expression of transcripts from high (black) to low (white). Level of significant differences in transcript levels are indicated by asterisk (• p < 0.1; * p < 0.05; ** p < 0.001). Gene expression profiles of MGAT3, ST6GAL1 and ST3GAL5 show positive correlation with resulting glycan phenotype as illustrated by B, scatterplots of MGAT3, ST6GAL1, and ST3GAL5 “glyco gene” expression (abscissa) and their corresponding relative MS ion intensities of bisecting GlcNAc, α 2–6 and α 2–3 sialylated N-glycan structures (ordinate). Scatterplot data points circled in dashes represent two non-cancerous human ovarian surface epithelial cells and data points circled in dots represent four ovarian cancer cell lines used in this study. Data represents the mean of three technical replicates.
We used both the data on the N-glycan structures containing bisecting GlcNAc and α 2–6/α 2–3 sialylation as detected by LC-ESI-MS and the corresponding gene expression of the selected glycosyltransferases (MGAT3, ST6GAL1, and ST3GAL5) to investigate their potential correlation (Fig. 6B). This was achieved by calculating the total relative ion intensities for the bisecting GlcNAc N-glycans (n = 6 structures) and α 2–6/α 2–3 sialylated N-glycans (n = 11 structures) respectively, expressing them as a percentage of the total relative ion intensities of all N-glycans from each cell line and plotting these percentage values against the ΔCq of the corresponding glycosyltransferases. The linear dependence (R2) obtained revealed a strong correlation between bisecting GlcNAc and MGAT3 expression (r = 0.79) and between α 2–6 sialylation and ST6GAL1 expression (r = 0.76), whereas moderately linear association was observed between α 2–3 sialylation and ST3GAL5 expression (r = 0.66). These correlations emphasize that the specific changes in N-glycan structures seen between non-cancerous and cancerous cells can be directly attributable to the expression of the genes responsible for their synthesis. In particular, the bisecting GlcNAcylation and α 2–6 sialylation of the glycan structures expressed on the membrane proteins of ovarian cancer cells are directly correlated with the increased expression of the genes, MGAT3 and ST6GAL1.
DNA Hypermethylation and MGAT3 Expression
The exclusive presence of bisecting GlcNAc on N-glycans from all tested ovarian cancer cell lines highly correlated with MGAT3 expression, whereas the absence of bisecting GlcNAc in both non-cancerous cell lines was in full concordance with the reduced expression of MGAT3. In an attempt to understand the molecular mechanism underlying the decreased MGAT3 transcription in the non-cancerous cells, we investigated whether epigenetic dysregulation by hypermethylation might be responsible for silencing the MGAT3 gene in the non-cancerous cells. We treated the non-cancerous and ovarian cancer cell lines with 5-aza-2′-deoxycytidine (5-Aza), an inhibitor of DNA methyltransferase, and tested for MGAT3 expression. In addition, cells were treated with Trichostatin A (TSA), a selective inhibitor of class I and II histone deacetylases to exclude the potential alteration of MGAT3 expression by histone epigenetic involvement. Within a 2 day-treatment period with 5-Aza, we observed a significant increase (p < 0.05) of MGAT3 transcripts in non-cancerous cell lines as indicated by a relative MGAT3 expression of up to 324-fold and 83-fold for HOSE 6.3 and HOSE 17.1, respectively (Fig. 7A). The reconstituted MGAT3 gene PCR product for both non-cancerous cell lines was also visualized by agarose gel electrophoresis (Fig. 7B). No or slightly increased MGAT3 transcript levels were observed in the serous ovarian cancer cell lines with 5-Aza treatment except for IGROV1 cells that showed a 6.3-fold increase. TSA treatment revealed similar MGAT3 expression in HOSE 17.1, OVCAR3, A2780, and IGROV1 cell lines with only minor variations in HOSE 6–3 and SKOV3. These data suggest that inhibition of DNA methyltransferases by 5-Aza subsequently lead to DNA hypomethylation, thereby increasing MGAT3 expression in the two non-cancerous cell lines.
Fig. 7.

Evidence of MGAT3 gene silencing by DNA hypermethylation in non-cancerous human ovarian surface epithelial cells. To determine if MGAT3 gene expression is regulated epigenetically by DNA methylation, all cell lines were treated with 5-Aza, a DNA methylation inhibitor, and tested for MGAT3 expression. A, Heatmap illustration of MGAT3 gene expression (ΔCq) normalized for all cell lines (abscissa) under different treatment conditions: no treatment (mock), Azacytidine (5-Aza), and Trichostatin A (TSA). In both non-cancerous cell lines, MGAT3 gene expression was significantly increased after treatment with 5-Aza. Level of significant difference in transcript levels is indicated by asterisk (* p < 0.05). Transcription levels are based on 72 h treatment period. Key at the lower right side indicates level of MGAT3 expression from high (black) to low (white). B, Reconstituted MGAT3 (by 5-Aza and mock treatment) and reference gene (YWHAZ) expression in normal ovarian surface epithelial cell lines are visualized by agarose gel electrophoresis.
DISCUSSION
Post-translational modifications on proteins, such as glycosylation, offer researchers the possibility of exploring new potential biomarkers for early ovarian cancer detection and novel treatment options or therapies for this disease. The acquisition of structural information pertaining to membrane N-glycans is therefore important as it exposes new cell surface membrane glycan targets or modifications that represent key enzymatic changes that occur in cancer within the glycosylation machinery. It is becoming apparent that these glycan alterations are not necessarily the consequence of mutations and deletions at the DNA level of the respective glycosyltransferases, but may rather be caused by epigenetic modifications to the DNA such as hyper- or hypomethylation that regulate variable gene expression (49). In this study, we identify specific N-glycan alterations on the cell surface membrane proteins of serous ovarian cancer cell lines that correlate with differential gene expression of the corresponding glycosyltransferase-encoded genes. We also show that the primary glycosyltransferase alteration is epigenetically regulated via DNA methylation.
A defining N-glycan structural feature unique to the ovarian cancer cell lines analyzed in this study was the presence of bisecting N-acetylglucosamine on several complex N-glycans, representing 5%–13% of the total N-glycans across four ovarian cancer cell lines. To our knowledge, no study has investigated bisecting GlcNAc structures on membrane proteins of serous ovarian cancer and normal human ovarian epithelial cells using nanoESI-LC-MS/MS to directly identify the presence of this determinant without the use of monoclonal antibodies or lectins. In a previous study by Wong et al. (2003), mono-fucosylated, bisecting GlcNAc N-glycans were identified on CA125, which was isolated by gel filtration from the conditioned media of the serous ovarian cancer cell line, OVCAR 3 (50). The authors confirmed the presence of bisecting GlcNAc using gas chromatography mass spectrometry (GC-MS) linkage analysis that identified a 3,4,6-linked Man residue of the N-glycan core, implying the presence of the 4-linked bisecting GlcNAc. For the first time, we have demonstrated that the expression of bisecting GlcNAc on N-linked glycoproteins is correlated with the expression of the MGAT3 gene that expresses the enzyme that adds this monosaccharide in a β 1–4 linkage to the core of the N-glycans. This is consistent with a previous study using mouse models (n = 9) and human fresh frozen tissue samples (n = 5), in which there was elevated mRNA expression of MGAT3 in endometrioid ovarian cancer in both species types as compared with normal ovaries (51). The authors used the lectin, phytohemeagglutinin E (E-PHA), which has specificity toward binding to bisecting-type N-glycan determinants on glycoproteins. Positive staining for E-PHA was detected in normal controls and more than 2-fold increase of bisecting GlcNAc was detected in the ovarian cancer tissue samples (51). In our study, however, bisecting GlcNAc was completely absent in both non-cancerous cell lines and comprised up to 13% of the N-glycans in the cancer cells. The quantitative difference in observation could be caused by nonspecific cross reactive binding of the lectin or the variation in glycosylation of proteins between cell lines and tissues.
Importantly, this study provides strong evidence that the bisecting GlcNAc N-linked structures on the membrane proteins of serous ovarian cancer cells are a consequence of DNA hypomethylation. The suppression of MGAT3 in non-cancerous cell lines was shown to be, at least partly, because of epigenetic silencing by DNA hypermethylation as evidenced by the reconstitution of the MGAT3 gene expression after 5-Aza treatment. The enzyme, GnT-III, encoded by the MGAT3 gene, is thus responsible for producing bisecting-type N-glycans on the proteins of epithelial ovarian cancer cell lines. Bisecting GlcNAc addition has been thought to suppress metastasis by preventing the addition of branched-type complex N-glycans (52–54). This correlates strongly with our finding of an increased proportion of complex type N-glycans in the non-cancerous cells as compared with the serous ovarian cancer cells. A recent study demonstrated that MGAT3 mediated E-cadherin N-glycosylation is involved in epithelial-mesenchymal transitions and their findings point to an involvement of DNA methylation as a regulatory mechanism of MGAT3 (55). This supports our finding that the expression of bisecting GlcNAc on the entire N-glycoproteome is indeed a result of DNA hypomethylation of MGAT3 transcriptional regulatory elements in serous ovarian cancer cells. However, the precise DNA region of the MGAT3 gene that is affected by the hypomethylation is still under investigation as our preliminary method optimization has been hampered by the high amount of CpG islands surrounding the gene. It is possible that there are other factors besides DNA hypomethylation of MGAT3 that can also stimulate the expression of MGAT3 in all four serous ovarian cancer cells, although histone methylation does not appear to be significantly involved. Apart from DNA methylation, nucleosome occupancy is another regulatory element, in which nucleosome positioning could potentially influence the gene activation of MGAT3 and thus regulate MGAT3 expression. Studies have shown that both these epigenetic mechanisms form a combinatorial epigenetic profile of a genomic locus and are becoming increasingly associated with cancer (56, 57).
The other difference in the glycosylation of the N-linked glycans on the ovarian cancer cell glycoproteins was the exclusive expression of α 2–6 linked sialic acids. Sialylation of N-glycans is an important modification in cellular glycosylation and alterations in sialyltransferase expression have been implicated in tumor progression and metastasis (58). The sialylation of N-glycans is determined by the concerted action of sialyltransferases, which are classified into four families based on the specific linkage of the sialic acid residue transferred to the glycan substrate (59). The enzyme investigated in this study, ST6GAL1, terminally sialylates Galβ1–4GlcNAcβ motifs on N-glycans and the correlated overexpression of this gene in the serous ovarian cancer cells as compared with the non-cancerous cells is consistent with other findings reported for colorectal (60), breast (61), cervical (62), liver (63), and ovarian cancers (58). The presence of hybrid and complex N-glycans bearing α 2–6 sialylation in ovarian cancer cell lines is also in good agreement with another mass spectrometric-based analysis on the total serum glycome that revealed that α 2–6 sialylation of acute-phase glycoproteins in ovarian cancer patients' serum increased proportionally as compared with α 2–3 sialylation (64). The functional role of ST6GAL1-mediated sialylation of membrane proteins is yet to be fully understood although it has been shown that α 2–6 sialylation of membrane-associated β1 integrins in ovarian epithelial cells induces increased adhesion and invasive potential (65).
The contrasting prevalence of α 2–3 sialylation on membrane N-glycans in non-cancerous compared with ovarian cancer cells could be attributed to the overlapping enzyme specificities of the ST3GAL sialyltransferase family (66). Three of the five ST3GAL sialyltransferases (ST3GAL3, ST3GAL4, and ST3GAL5) profiled in this study are known to sialylate the Galβ1–3/4GlcNAcβ motif on glycoproteins and glycolipids (67–69). The preferential expression of ST3GAL4 over ST3GAL3 in all six tested cell lines in this study is consistent with results from the previously mentioned study using normal and serous ovarian cancer tissues (58). It is also interesting to note that the expression of ST3GAL5, was significantly reduced in all four ovarian cancer cell lines. The enzyme has also been reported to act exclusively on Galβ1–4Glc-Cer motifs on glycolipids, giving rise to the synthesis of the α 2–3 sialylated ganglioside, GM3 (70). Because our study was limited to the changes on the membrane N-glycoproteins, it will be worthwhile extending the scope of our analysis in the future to also investigate the differential expression of glycolipids in ovarian cancer.
Another exciting feature of this study is the presence of the “N,N′-diacetyl-lactosamine” (LacdiNAc) motif observed in some of the N-glycans of the ovarian cancer cell lines. This terminal modification, which also has been reported to occur as α 1–3-fucosylated (71, 72), 4-O-sulfated (73), or sialylated (74) derivatives, is less well understood as compared with the N-acetyl-lactosamine type antennae (LacNAc; Gal-GlcNAc). LacdiNAc-type N-glycans have been found on various mammalian glycoproteins such as the pituitary luteinizing hormone (75), glycodelin (76), and tenascin-R (77) as well as in other non-mammalian hosts such as the human parasite, Schistosoma mansoni (72). This disaccharide (GalNAcβ1–4GlcNAc) is synthesized by the action of specific β4- GalNAc transferases, β4GalNAcT3 and β4GalNAcT4, which are differently expressed in various organs of the human body such as the stomach, colon, testes, and ovaries (78, 79). Studies have shown that this motif is also present in some N-glycans of tumor-associated glycoproteins such as secreted tissue plasminogen activator from Bowes melanoma cells (80) and secreted ribonuclease I from pancreatic tumor cells (81). Interestingly, this motif has been previously described in ovarian cancer in which LacdiNAc-type N-glycans were identified in SKOV 3- derived recombinant human EPO and endogenous glycoproteins of SKOV 3 cell lines using positive mode MALDI-TOF-TOF mass spectrometry (82). In addition to the identification of LacdiNAc, as well as sialylated LacdiNAc motifs, on membrane proteins using negative mode mass spectrometry in our study, the exclusive presence of fucosylated LacdiNAc-type N-glycans and the corresponding increase in gene expression of B4GALNT3 in the IGROV 1 cell line appear to be of significant interest. This is particularly because of the mixed histological classification of the tumor (endometrioid and serous) from which this IGROV 1 cell line is derived as compared with the rest of the ovarian cancer cell lines, which are mainly derived from serous type tumors. This observation, together with the recent findings of fucosylated as well as sulfated LacdiNAcs in a clear cell ovarian cancer cell line, RMG-1 (73), further substantiates the need to explore the significance of this motif, not only as a possible biomarker but also to aid in the differentiation between various histological subtypes of ovarian cancer.
The high mannose structures observed to comprise a greater proportion of the protein N-glycans in all four ovarian cancer cell lines were the most abundant structures as compared with the other N-glycan subgroups. A similar study involving cytosolic glycoproteins from breast cancer cell lines also showed that high mannose N-glycans were significantly elevated in invasive and noninvasive breast cancer cells as compared with the normal breast epithelial cells (83). Although it remains unclear whether high mannose glycans are a common feature of most cultured cell lines, the presence of high mannose structures reported here correlates with the study by Jacob et al. (2012) who showed that naturally occurring anti-glycan antibodies such as anti-Man, present in ovarian cancer patients' plasma exhibited specific binding of high mannose structures using a printed glycan-array technology (23). A recently developed monoclonal antibody, TM10, has also been shown to have specificity toward high mannose N-glycans on glycoproteins derived from human cancer cell lines, ranging from melanoma, prostate, breast, and ovarian cancer cell lines including SKOV 3 (84). One particular study indicated that cancer cells derived from A431 human squamous carcinoma cell line displayed high-mannose EGFR precursors on their cell surface because of their incomplete processing in the Golgi apparatus (85). Hence, it is possible that the synthetic processing of the N-glycans by the addition of other sugar residues to form complex structures on the cell surface membrane glycoproteins appears to be inhibited in cancer cells and this, together with the presence of bisecting GlcNAc, may explain the relatively low proportion of complex neutral and sialylated N-glycans observed in our study for the ovarian cancer cells.
At present, ovarian cancer treatment options are limited to only cytoreductive surgery and platinum-based chemotherapy of which more than 80% of patients undergo relapse caused by chemotherapy resistance (42). Attempts aimed at prolonging the remission of this disease and improving survival rates must be intensified through the development of novel biomarkers or molecular drug targets (86). The cell lines selected for this study, particularly the non-cancerous human ovarian surface epithelial cells, are representative of the cell line models currently used for studying ovarian cancer (31). Despite their potential utility, factors such as cell culture conditions and established choice of media may contribute to underlying cellular differences that must be taken into consideration in any in vitro- based studies. The determination of specific structural and isomeric changes specific to ovarian cancer-associated membrane-derived N-glycans described in this study provides evidence for the potential of glycan candidates to detect and potentially treat ovarian cancer malignancy that must be further investigated in vivo. Furthermore, we highlight the importance of epigenetic modifications, such as DNA methylation, in ovarian cancer that is now shown to be pivotal in understanding the complex interplay between cellular glycosylation and glycosyltransferase expression.
Supplementary Material
Footnotes
Author contributions: M.A., F.J., V.H., and N.H.P. designed research; M.A. and F.J. performed research; S.N., A.V.E., and V.H. contributed new reagents or analytic tools; M.A., F.J., and A.V.E. analyzed data; M.A., F.J., and N.H.P. wrote the paper.
* This work was supported by the Macquarie University Postgraduate Research Scholarship and Northern Translational Cancer Research Grant No: 1470100 by NSW Cancer Institute, Australia (M.A.), NSW Cancer Institute Grant No: 09CRF202 (V.H.S.), Krebsliga Beider Basel (V.H.S), William Maxwell Trust (V.H.S.), Mary Elizabeth Courier Scholarship (V.H.S.), and Swiss National Foundation (F.J.).
 This article contains supplemental Figs. S1 to S5 and Tables S1 and S2.
1 The abbreviations used are:
- 5-Aza
- 5-aza-2′-deoxycytidine
- Gal
- galactosamine
- Man
- mannose
- Glc
- glucose
- Fuc
- fucose
- GlcNAc
- N-acetyl-glucosamine
- LacdiNAc
- N,N′-diacetyl-lactosamine
- GalNAc
- N-acetyl-galactosamine
- Neu5Ac
- N-acetyl-neuraminic acid
- LC
- liquid chromatography
- ESI
- electrospray ionization
- BPC
- base peak chromatogram
- EIC
- extracted ion chromatogram
- PGC
- porous graphitized carbon
- FIGO
- International Federation of Gynaecology and Obstetrics
- MIQE
- Minimum Information for Publication of Quantitative Real-Time PCR Experiments.
REFERENCES
- 1. Jemal A., Siegel R., Xu J., Ward E. (2010) Cancer statistics, 2010. CA Cancer J. Clin. 60, 277–300 [DOI] [PubMed] [Google Scholar]
- 2. Vathipadiekal V., Saxena D., Mok S. C., Hauschka P. V., Ozbun L., Birrer M. J. (2012) Identification of a potential ovarian cancer stem cell gene expression profile from advanced stage papillary serous ovarian cancer. PLoS One 7, e29079. [DOI] [PMC free article] [PubMed] [Google Scholar]
- 3. Berkenblit A., Cannistra S. A. (2005) Advances in the management of epithelial ovarian cancer. J. Reprod. Med. 50, 426–438 [PubMed] [Google Scholar]
- 4. Sasaroli D., Coukos G., Scholler N. (2009) Beyond CA125: the coming of age of ovarian cancer biomarkers. Are we there yet? Biomark. Med. 3, 275–288 [DOI] [PMC free article] [PubMed] [Google Scholar]
- 5. Meyer T., Rustin G. J. (2000) Role of tumour markers in monitoring epithelial ovarian cancer. Br. J. Cancer 82, 1535–1538 [DOI] [PMC free article] [PubMed] [Google Scholar]
- 6. Jacob F., Meier M., Caduff R., Goldstein D., Pochechueva T., Hacker N., Fink D., Heinzelmann-Schwarz V. (2011) No benefit from combining HE4 and CA125 as ovarian tumor markers in a clinical setting. Gynecol. Oncol. 121, 487–491 [DOI] [PubMed] [Google Scholar]
- 7. Paulson J. C., Colley K. J. (1989) Glycosyltransferases. Structure, localization, and control of cell type-specific glycosylation. J. Biol. Chem. 264, 17615–17618 [PubMed] [Google Scholar]
- 8. Taylor A. D., Hancock W. S., Hincapie M., Taniguchi N., Hanash S. M. (2009) Towards an integrated proteomic and glycomic approach to finding cancer biomarkers. Genome Med. 1, 57. [DOI] [PMC free article] [PubMed] [Google Scholar]
- 9. Dube D. H., Bertozzi C. R. (2005) Glycans in cancer and inflammation–potential for therapeutics and diagnostics. Nat. Rev. Drug Discov. 4, 477–488 [DOI] [PubMed] [Google Scholar]
- 10. Hakomori S. (1996) Tumor malignancy defined by aberrant glycosylation and sphingo(glyco)lipid metabolism. Cancer Res. 56, 5309–5318 [PubMed] [Google Scholar]
- 11. Yamamoto H., Swoger J., Greene S., Saito T., Hurh J., Sweeley C., Leestma J., Mkrdichian E., Cerullo L., Nishikawa A., Ihara Y., Taniguchi N., Moskal J. R. (2000) Beta1,6-N-acetylglucosamine-bearing N-glycans in human gliomas: implications for a role in regulating invasivity. Cancer Res. 60, 134–142 [PubMed] [Google Scholar]
- 12. Couldrey C., Green J. E. (2000) Metastases: the glycan connection. Breast Cancer Res. 2, 321–323 [DOI] [PMC free article] [PubMed] [Google Scholar]
- 13. Taniguchi N., Ihara S., Saito T., Miyoshi E., Ikeda Y., Honke K. (2001) Implication of GnT-V in cancer metastasis: a glycomic approach for identification of a target protein and its unique function as an angiogenic cofactor. Glycoconj. J. 18, 859–865 [DOI] [PubMed] [Google Scholar]
- 14. Demetriou M., Nabi I. R., Coppolino M., Dedhar S., Dennis J. W. (1995) Reduced contact-inhibition and substratum adhesion in epithelial cells expressing GlcNAc-transferase V. J. Cell Biol. 130, 383–392 [DOI] [PMC free article] [PubMed] [Google Scholar]
- 15. Mechref Y., Hu Y., Garcia A., Zhou S., Desantos-Garcia J. L., Hussein A. (2012) Defining putative glycan cancer biomarkers by MS. Bioanalysis 4, 2457–2469 [DOI] [PMC free article] [PubMed] [Google Scholar]
- 16. Harvey D. J. (2000) Collision-induced fragmentation of underivatized N-linked carbohydrates ionized by electrospray. J. Mass Spectrom. 35, 1178–1190 [DOI] [PubMed] [Google Scholar]
- 17. Hayes C. A., Karlsson N. G., Struwe W. B., Lisacek F., Rudd P. M., Packer N. H., Campbell M. P. (2011) UniCarb-DB: a database resource for glycomic discovery. Bioinformatics 27, 1343–1344 [DOI] [PubMed] [Google Scholar]
- 18. Cooper C. A., Gasteiger E., Packer N. H. (2001) GlycoMod–a software tool for determining glycosylation compositions from mass spectrometric data. Proteomics 1, 340–349 [DOI] [PubMed] [Google Scholar]
- 19. Ceroni A., Maass K., Geyer H., Geyer R., Dell A., Haslam S. M. (2008) GlycoWorkbench: a tool for the computer-assisted annotation of mass spectra of glycans. J. Proteome Res. 7, 1650–1659 [DOI] [PubMed] [Google Scholar]
- 20. Maxwell E., Tan Y., Tan Y., Hu H., Benson G., Aizikov K., Conley S., Staples G. O., Slysz G. W., Smith R. D., Zaia J. (2012) GlycReSoft: a software package for automated recognition of glycans from LC/MS data. PLoS One 7, e45474. [DOI] [PMC free article] [PubMed] [Google Scholar]
- 21. Yu C. Y., Mayampurath A., Hu Y., Zhou S., Mechref Y., Tang H. (2013) Automated annotation and quantification of glycans using liquid chromatography-mass spectrometry. Bioinformatics 29, 1706–1707 [DOI] [PMC free article] [PubMed] [Google Scholar]
- 22. Abbott K. L., Lim J. M., Wells L., Benigno B. B., McDonald J. F., Pierce M. (2010) Identification of candidate biomarkers with cancer-specific glycosylation in the tissue and serum of endometrioid ovarian cancer patients by glycoproteomic analysis. Proteomics 10, 470–481 [DOI] [PMC free article] [PubMed] [Google Scholar]
- 23. Jacob F., Goldstein D. R., Bovin N. V., Pochechueva T., Spengler M., Caduff R., Fink D., Vuskovic M. I., Huflejt M. E., Heinzelmann-Schwarz V. (2012) Serum antiglycan antibody detection of nonmucinous ovarian cancers by using a printed glycan array. Int. J. Cancer 130, 138–146 [DOI] [PMC free article] [PubMed] [Google Scholar]
- 24. Alley W. R., Jr., Vasseur J. A., Goetz J. A., Svoboda M., Mann B. F., Matei D. E., Menning N., Hussein A., Mechref Y., Novotny M. V. (2012) N-linked glycan structures and their expressions change in the blood sera of ovarian cancer patients. J. Proteome Res. 11, 2282–2300 [DOI] [PMC free article] [PubMed] [Google Scholar]
- 25. Shetty V., Hafner J., Shah P., Nickens Z., Philip R. (2012) Investigation of ovarian cancer associated sialylation changes in N-linked glycopeptides by quantitative proteomics. Clin. Proteomics 9, 10. [DOI] [PMC free article] [PubMed] [Google Scholar]
- 26. Colombo N., Peiretti M., Parma G., Lapresa M., Mancari R., Carinelli S., Sessa C., Castiglione M., Group E. G. W. (2010) Newly diagnosed and relapsed epithelial ovarian carcinoma: ESMO Clinical Practice Guidelines for diagnosis, treatment and follow-up. Ann. Oncol. 5, v23–30 [DOI] [PubMed] [Google Scholar]
- 27. Schiess R., Wollscheid B., Aebersold R. (2009) Targeted proteomic strategy for clinical biomarker discovery. Mol. Oncol. 3, 33–44 [DOI] [PMC free article] [PubMed] [Google Scholar]
- 28. Kim Y. S., Deng G. (2008) Aberrant expression of carbohydrate antigens in cancer: the role of genetic and epigenetic regulation. Gastroenterology 135, 305–309 [DOI] [PubMed] [Google Scholar]
- 29. Zoldos V., Horvat T., Novokmet M., Cuenin C., Muzinic A., Pucic M., Huffman J. E., Gornik O., Polasek O., Campbell H., Hayward C., Wright A. F., Rudan I., Owen K., McCarthy M. I., Herceg Z., Lauc G. (2012) Epigenetic silencing of HNF1A associates with changes in the composition of the human plasma N-glycome. Epigenetics 7, 164–172 [DOI] [PMC free article] [PubMed] [Google Scholar]
- 30. Saldova R., Dempsey E., Perez-Garay M., Marino K., Watson J. A., Blanco-Fernandez A., Struwe W. B., Harvey D. J., Madden S. F., Peracaula R., McCann A., Rudd P. M. (2011) 5-AZA-2′-deoxycytidine induced demethylation influences N-glycosylation of secreted glycoproteins in ovarian cancer. Epigenetics 6, 1362–1372 [DOI] [PubMed] [Google Scholar]
- 31. Tsao S. W., Mok S. C., Fey E. G., Fletcher J. A., Wan T. S., Chew E. C., Muto M. G., Knapp R. C., Berkowitz R. S. (1995) Characterization of human ovarian surface epithelial cells immortalized by human papilloma viral oncogenes (HPV-E6E7 ORFs). Exp. Cell Res. 218, 499–507 [DOI] [PubMed] [Google Scholar]
- 32. Lee A., Kolarich D., Haynes P. A., Jensen P. H., Baker M. S., Packer N. H. (2009) Rat liver membrane glycoproteome: enrichment by phase partitioning and glycoprotein capture. J. Proteome Res. 8, 770–781 [DOI] [PubMed] [Google Scholar]
- 33. Jensen P. H., Karlsson N. G., Kolarich D., Packer N. H. (2012) Structural analysis of N- and O-glycans released from glycoproteins. Nat. Protoc. 7, 1299–1310 [DOI] [PubMed] [Google Scholar]
- 34. Estrella R. P., Whitelock J. M., Packer N. H., Karlsson N. G. (2010) The glycosylation of human synovial lubricin: implications for its role in inflammation. Biochem. J. 429, 359–367 [DOI] [PubMed] [Google Scholar]
- 35. Issa S., Moran A. P., Ustinov S. N., Lin J. H., Ligtenberg A. J., Karlsson N. G. (2010) O-linked oligosaccharides from salivary agglutinin: Helicobacter pylori binding sialyl-Lewis x and Lewis b are terminating moieties on hyperfucosylated oligo-N-acetyllactosamine. Glycobiology 20, 1046–1057 [DOI] [PubMed] [Google Scholar]
- 36. Karlsson N. G., Thomsson K. A. (2009) Salivary MUC7 is a major carrier of blood group I type O-linked oligosaccharides serving as the scaffold for sialyl Lewis x. Glycobiology 19, 288–300 [DOI] [PubMed] [Google Scholar]
- 37. Everest-Dass A. V., Jin D., Thaysen-Andersen M., Nevalainen H., Kolarich D., Packer N. H. (2012) Comparative structural analysis of the glycosylation of salivary and buccal cell proteins: innate protection against infection by C. albicans. Glycobiology [DOI] [PubMed] [Google Scholar]
- 38. Nakano M., Saldanha R., Gobel A., Kavallaris M., Packer N. H. (2011) Identification of glycan structure alterations on cell membrane proteins in desoxyepothilone B resistant leukemia cells. Mol. Cell. Proteomics 10, M111 009001 [DOI] [PMC free article] [PubMed] [Google Scholar]
- 39. Everest-Dass A. V., Kolarich D., Campbell M. P., Packer N. H. (2013) Tandem mass spectra of glycan substructures enable the multistage mass spectrometric identification of determinants on oligosaccharides. Rapid Commun. Mass. Spectrom. 27, 931–939 [DOI] [PubMed] [Google Scholar]
- 40. Everest-Dass A. V., Abrahams J. L., Kolarich D., Packer N. H., Campbell M. P. (2013) Structural feature ions for distinguishing N- and O-linked glycan isomers by LC-ESI-IT MS/MS. J. Am. Soc. Mass Spectrom 24, 895–906 [DOI] [PubMed] [Google Scholar]
- 41. Harvey D. J. (2005) Fragmentation of negative ions from carbohydrates: part 3. fragmentation of hybrid and complex N-linked glycans. J. Am. Soc. Mass. Spectrom 16, 647–659 [DOI] [PubMed] [Google Scholar]
- 42. Stanley P., Schachter H., Taniguchi N. (2009) N-Glycans. In: Varki A., Cummings R. D., Esko J. D., Freeze H. H., Stanley P., Bertozzi C. R., Hart G. W., Etzler M. E., eds. Essentials of Glycobiology, 2nd Ed., Cold Spring Harbor (NY) [PubMed] [Google Scholar]
- 43. Bustin S. A., Benes V., Garson J. A., Hellemans J., Huggett J., Kubista M., Mueller R., Nolan T., Pfaffl M. W., Shipley G. L., Vandesompele J., Wittwer C. T. (2009) The MIQE guidelines: minimum information for publication of quantitative real-time PCR experiments. Clin. Chem. 55, 611–622 [DOI] [PubMed] [Google Scholar]
- 44. Jacob F., Guertler R., Naim S., Nixdorf S., Fedier A., Hacker N. F., Heinzelmann-Schwarz V. (2013) Careful selection of reference genes is required for reliable performance of RT-qPCR in human normal and cancer cell lines. PLoS One 8, e59180. [DOI] [PMC free article] [PubMed] [Google Scholar]
- 45. Arvidsson S., Kwasniewski M., Riano-Pachon D. M., Mueller-Roeber B. (2008) QuantPrime–a flexible tool for reliable high-throughput primer design for quantitative PCR. BMC Bioinformatics 9, 465. [DOI] [PMC free article] [PubMed] [Google Scholar]
- 46. Kent W. J., Sugnet C. W., Furey T. S., Roskin K. M., Pringle T. H., Zahler A. M., Haussler D. (2002) The human genome browser at UCSC. Genome Res. 12, 996–1006 [DOI] [PMC free article] [PubMed] [Google Scholar]
- 47. Pabst M., Bondili J. S., Stadlmann J., Mach L., Altmann F. (2007) Mass + retention time = structure: a strategy for the analysis of N-glycans by carbon LC-ESI-MS and its application to fibrin N-glycans. Anal. Chem. 79, 5051–5057 [DOI] [PubMed] [Google Scholar]
- 48. Harvey D. J., Crispin M., Scanlan C., Singer B. B., Lucka L., Chang V. T., Radcliffe C. M., Thobhani S., Yuen C. T., Rudd P. M. (2008) Differentiation between isomeric triantennary N-linked glycans by negative ion tandem mass spectrometry and confirmation of glycans containing galactose attached to the bisecting (beta1–4-GlcNAc) residue in N-glycans from IgG. Rapid Commun. Mass. Spectrom. 22, 1047–1052 [DOI] [PubMed] [Google Scholar]
- 49. Rodriguez-Paredes M., Esteller M. (2011) Cancer epigenetics reaches mainstream oncology. Nat. Med. 17, 330–339 [DOI] [PubMed] [Google Scholar]
- 50. Kui Wong N., Easton R. L., Panico M., Sutton-Smith M., Morrison J. C., Lattanzio F. A., Morris H. R., Clark G. F., Dell A., Patankar M. S. (2003) Characterization of the oligosaccharides associated with the human ovarian tumor marker CA125. J. Biol. Chem. 278, 28619–28634 [DOI] [PubMed] [Google Scholar]
- 51. Abbott K. L., Nairn A. V., Hall E. M., Horton M. B., McDonald J. F., Moremen K. W., Dinulescu D. M., Pierce M. (2008) Focused glycomic analysis of the N-linked glycan biosynthetic pathway in ovarian cancer. Proteomics 8, 3210–3220 [DOI] [PMC free article] [PubMed] [Google Scholar]
- 52. Schachter H. (1986) Biosynthetic controls that determine the branching and microheterogeneity of protein-bound oligosaccharides. Adv. Exp. Med. Biol. 205, 53–85 [DOI] [PubMed] [Google Scholar]
- 53. Takahashi M., Kuroki Y., Ohtsubo K., Taniguchi N. (2009) Core fucose and bisecting GlcNAc, the direct modifiers of the N-glycan core: their functions and target proteins. Carbohydr. Res. 344, 1387–1390 [DOI] [PubMed] [Google Scholar]
- 54. Lau K. S., Partridge E. A., Grigorian A., Silvescu C. I., Reinhold V. N., Demetriou M., Dennis J. W. (2007) Complex N-glycan number and degree of branching cooperate to regulate cell proliferation and differentiation. Cell 129, 123–134 [DOI] [PubMed] [Google Scholar]
- 55. Pinho S. S., Oliveira P., Cabral J., Carvalho S., Huntsman D., Gartner F., Seruca R., Reis C. A., Oliveira C. (2012) Loss and recovery of Mgat3 and GnT-III Mediated E-cadherin N-glycosylation is a mechanism involved in epithelial-mesenchymal-epithelial transitions. PLoS One 7, e33191. [DOI] [PMC free article] [PubMed] [Google Scholar]
- 56. Wilson B. G., Roberts C. W. (2011) SWI/SNF nucleosome remodellers and cancer. Nat. Rev. Cancer 11, 481–492 [DOI] [PubMed] [Google Scholar]
- 57. Kelly T. K., Liu Y., Lay F. D., Liang G., Berman B. P., Jones P. A. (2012) Genome-wide mapping of nucleosome positioning and DNA methylation within individual DNA molecules. Genome Res. 22, 2497–2506 [DOI] [PMC free article] [PubMed] [Google Scholar]
- 58. Fwu P. T., Wang P. H., Tung C. K., Dong C. Y. (2005) Effects of index-mismatch-induced spherical aberration in pump–probe microscopic image formation. Appl. Opt 44, 4220–4227 [DOI] [PubMed] [Google Scholar]
- 59. Tsuji S. (1996) Molecular cloning and functional analysis of sialyltransferases. J. Biochem. 120, 1–13 [DOI] [PubMed] [Google Scholar]
- 60. Dall'Olio F., Chiricolo M., Lau J. T. (1999) Differential expression of the hepatic transcript of beta-galactoside alpha2,6-sialyltransferase in human colon cancer cell lines. Int. J. Cancer 81, 243–247 [DOI] [PubMed] [Google Scholar]
- 61. Recchi M. A., Hebbar M., Hornez L., Harduin-Lepers A., Peyrat J. P., Delannoy P. (1998) Multiplex reverse transcription polymerase chain reaction assessment of sialyltransferase expression in human breast cancer. Cancer Res. 58, 4066–4070 [PubMed] [Google Scholar]
- 62. Wang P. H., Lee W. L., Lee Y. R., Juang C. M., Chen Y. J., Chao H. T., Tsai Y. C., Yuan C. C. (2003) Enhanced expression of alpha 2,6-sialyltransferase ST6Gal I in cervical squamous cell carcinoma. Gynecol. Oncol. 89, 395–401 [DOI] [PubMed] [Google Scholar]
- 63. Pousset D., Piller V., Bureaud N., Monsigny M., Piller F. (1997) Increased alpha2,6 sialylation of N-glycans in a transgenic mouse model of hepatocellular carcinoma. Cancer Res. 57, 4249–4256 [PubMed] [Google Scholar]
- 64. Saldova R., Royle L., Radcliffe C. M., Abd Hamid U. M., Evans R., Arnold J. N., Banks R. E., Hutson R., Harvey D. J., Antrobus R., Petrescu S. M., Dwek R. A., Rudd P. M. (2007) Ovarian cancer is associated with changes in glycosylation in both acute-phase proteins and IgG. Glycobiology 17, 1344–1356 [DOI] [PubMed] [Google Scholar]
- 65. Christie D. R., Shaikh F. M., Lucas J. A. t., Lucas J. A., 3rd, Bellis S. L. (2008) ST6Gal-I expression in ovarian cancer cells promotes an invasive phenotype by altering integrin glycosylation and function. J. Ovarian Res. 1, 3. [DOI] [PMC free article] [PubMed] [Google Scholar]
- 66. Harduin-Lepers A., Recchi M. A., Delannoy P. (1995) 1994, the year of sialyltransferases. Glycobiology 5, 741–758 [DOI] [PubMed] [Google Scholar]
- 67. Kitagawa H., Paulson J. C. (1993) Cloning and expression of human Gal beta 1,3(4)GlcNAc alpha 2,3-sialyltransferase. Biochem. Biophys. Res. Commun. 194, 375–382 [DOI] [PubMed] [Google Scholar]
- 68. Kitagawa H., Paulson J. C. (1994) Cloning of a novel alpha 2,3-sialyltransferase that sialylates glycoprotein and glycolipid carbohydrate groups. J. Biol. Chem. 269, 1394–1401 [PubMed] [Google Scholar]
- 69. Ishii A., Ohta M., Watanabe Y., Matsuda K., Ishiyama K., Sakoe K., Nakamura M., Inokuchi J., Sanai Y., Saito M. (1998) Expression cloning and functional characterization of human cDNA for ganglioside GM3 synthase. J. Biol. Chem. 273, 31652–31655 [DOI] [PubMed] [Google Scholar]
- 70. Harduin-Lepers A., Mollicone R., Delannoy P., Oriol R. (2005) The animal sialyltransferases and sialyltransferase-related genes: a phylogenetic approach. Glycobiology 15, 805–817 [DOI] [PubMed] [Google Scholar]
- 71. Kawar Z. S., Haslam S. M., Morris H. R., Dell A., Cummings R. D. (2005) Novel poly-GalNAcbeta1–4GlcNAc (LacdiNAc) and fucosylated poly-LacdiNAc N-glycans from mammalian cells expressing beta1,4-N-acetylgalactosaminyltransferase and alpha1,3-fucosyltransferase. J. Biol. Chem. 280, 12810–12819 [DOI] [PubMed] [Google Scholar]
- 72. Wuhrer M., Koeleman C. A., Deelder A. M., Hokke C. H. (2006) Repeats of LacdiNAc and fucosylated LacdiNAc on N-glycans of the human parasite Schistosoma mansoni. FEBS J. 273, 347–361 [DOI] [PubMed] [Google Scholar]
- 73. Yu S. Y., Chang L. Y., Cheng C. W., Chou C. C., Fukuda M. N., Khoo K. H. (2013) Priming mass spectrometry-based sulfoglycomic mapping for identification of terminal sulfated lacdiNAc glycotope. Glycoconj. J. 30, 183–194 [DOI] [PubMed] [Google Scholar]
- 74. Saarinen J., Welgus H. G., Flizar C. A., Kalkkinen N., Helin J. (1999) N-glycan structures of matrix metalloproteinase-1 derived from human fibroblasts and from HT-1080 fibrosarcoma cells. Eur. J. Biochem. 259, 829–840 [DOI] [PubMed] [Google Scholar]
- 75. Smith P. L., Baenziger J. U. (1992) Molecular basis of recognition by the glycoprotein hormone-specific N-acetylgalactosamine-transferase. Proc. Natl. Acad. Sci. U.S.A. 89, 329–333 [DOI] [PMC free article] [PubMed] [Google Scholar]
- 76. Dell A., Morris H. R., Easton R. L., Panico M., Patankar M., Oehniger S., Koistinen R., Koistinen H., Seppala M., Clark G. F. (1995) Structural analysis of the oligosaccharides derived from glycodelin, a human glycoprotein with potent immunosuppressive and contraceptive activities. J. Biol. Chem. 270, 24116–24126 [DOI] [PubMed] [Google Scholar]
- 77. Woodworth A., Fiete D., Baenziger J. U. (2002) Spatial and temporal regulation of tenascin-R glycosylation in the cerebellum. J. Biol. Chem. 277, 50941–50947 [DOI] [PubMed] [Google Scholar]
- 78. Sato T., Gotoh M., Kiyohara K., Kameyama A., Kubota T., Kikuchi N., Ishizuka Y., Iwasaki H., Togayachi A., Kudo T., Ohkura T., Nakanishi H., Narimatsu H. (2003) Molecular cloning and characterization of a novel human beta 1,4-N-acetylgalactosaminyltransferase, beta 4GalNAc-T3, responsible for the synthesis of N,N′-diacetyllactosediamine, galNAc beta 1–4GlcNAc. J. Biol. Chem. 278, 47534–47544 [DOI] [PubMed] [Google Scholar]
- 79. Gotoh M., Sato T., Kiyohara K., Kameyama A., Kikuchi N., Kwon Y. D., Ishizuka Y., Iwai T., Nakanishi H., Narimatsu H. (2004) Molecular cloning and characterization of beta1,4-N-acetylgalactosaminyltransferases IV synthesizing N,N′-diacetyllactosediamine. FEBS Lett. 562, 134–140 [DOI] [PubMed] [Google Scholar]
- 80. Chan A. L., Morris H. R., Panico M., Etienne A. T., Rogers M. E., Gaffney P., Creighton-Kempsford L., Dell A. (1991) A novel sialylated N-acetylgalactosamine-containing oligosaccharide is the major complex-type structure present in Bowes melanoma tissue plasminogen activator. Glycobiology 1, 173–185 [DOI] [PubMed] [Google Scholar]
- 81. Peracaula R., Royle L., Tabares G., Mallorqui-Fernandez G., Barrabes S., Harvey D. J., Dwek R. A., Rudd P. M., de Llorens R. (2003) Glycosylation of human pancreatic ribonuclease: differences between normal and tumor states. Glycobiology 13, 227–244 [DOI] [PubMed] [Google Scholar]
- 82. Machado E., Kandzia S., Carilho R., Altevogt P., Conradt H. S., Costa J. (2011) N-Glycosylation of total cellular glycoproteins from the human ovarian carcinoma SKOV3 cell line and of recombinantly expressed human erythropoietin. Glycobiology 21, 376–386 [DOI] [PubMed] [Google Scholar]
- 83. Goetz J. A., Mechref Y., Kang P., Jeng M. H., Novotny M. V. (2009) Glycomic profiling of invasive and non-invasive breast cancer cells. Glycoconj. J. 26, 117–131 [DOI] [PubMed] [Google Scholar]
- 84. Newsom-Davis T. E., Wang D., Steinman L., Chen P. F., Wang L. X., Simon A. K., Screaton G. R. (2009) Enhanced immune recognition of cryptic glycan markers in human tumors. Cancer Res. 69, 2018–2025 [DOI] [PMC free article] [PubMed] [Google Scholar]
- 85. Johns T. G., Mellman I., Cartwright G. A., Ritter G., Old L. J., Burgess A. W., Scott A. M. (2005) The antitumor monoclonal antibody 806 recognizes a high-mannose form of the EGF receptor that reaches the cell surface when cells over-express the receptor. FASEB J. 19, 780–782 [DOI] [PubMed] [Google Scholar]
- 86. Yap T. A., Carden C. P., Kaye S. B. (2009) Beyond chemotherapy: targeted therapies in ovarian cancer. Nat. Rev. Cancer 9, 167–181 [DOI] [PubMed] [Google Scholar]
Associated Data
This section collects any data citations, data availability statements, or supplementary materials included in this article.