

Abstract
The colonic epithelium is a highly dynamic system important for the regulation of ion and water homeostasis via absorption and secretion and for the maintenance of a protective barrier between the outer milieu and the inside of the body. These processes are known to gradually change along the length of the colon, although a complete characterization at the protein level is lacking. We therefore analyzed the membrane proteome of isolated human (n = 4) colonic epithelial cells from biopsies obtained via routine colonoscopy for four segments along the large intestine: ascending, transverse, descending, and sigmoid colon. Label-free quantitative proteomic analyses using high-resolution mass spectrometry were performed on enriched membrane proteins. The results showed a stable level for the majority of membrane proteins but a distinct decrease in proteins associated with bacterial sensing, cation transport, and O-glycosylation in the proximal to distal regions. In contrast, proteins involved in microbial defense and anion transport showed an opposing gradient and increased toward the distal end. The gradient of ion-transporter proteins could be directly related to previously observed ion transport activities. All individual glycosyltransferases required for the O-glycosylation of the major colonic mucin MUC2 were observed and correlated with the known glycosylation variation along the colon axis. This is the first comprehensive quantitative dataset of membrane protein abundance along the human colon and will add to the knowledge of the physiological function of the different regions of the colonic mucosa. Mass spectrometry data have been deposited to the ProteomeXchange with the identifier PXD000987.
The physiology and architecture of the human gastrointestinal tract differ along its axis, where the stomach and small intestine are responsible for digestion followed by nutrient absorption. The colon forms the last part of the digestive tract and is required for the reabsorption of the large volumes of fluid and ions from material that has passed through the small intestine. In addition, it also functions as a large anaerobic bioreactor in which the gut microbiota degrade host-indigestible polysaccharides and glycans into short-chain fatty acids that are used as an energy source (1). The human gut hosts 1013 to 1014 commensal bacteria, of which the majority are found in the colon (2). In this symbiotic system, direct interaction between bacteria and epithelium is prevented by the continuous secretion of a dense mucus layer. The organization and composition of this mucus layer vary along the digestive tract (3). The colon has a two-layered protective barrier system that can be up to 500 μm in thickness, of which only the outer layer is permeable to bacteria (4, 5). Bacteria are suggested to be able to control mucus secretion and thereby balance the symbiotic relation between bacterial load and mucus production (6). The core protein of the colonic mucus is the MUC2 mucin, which has a net-like structural organization and dense complex O-glycosylation allowing it to withstand the harsh environment of the intestinal lumen (3). When O-glycans are lacking or truncated as, for example, in mice lacking the core-1 glycosyltransferase, the MUC2 protein loses part of its protective function, and the commensal flora will reach the epithelium and cause colitis (7). The O-glycosylation of MUC2 varies along the axis of the digestive tract (8, 9). Terminal glycan epitopes are suggested to be responsible for the selection of our commensal microflora, resulting in distinct communities depending on the glycosyltransferases expressed (10).
The human colon can be divided anatomically from the ileocecal valve into a proximal part covering the cecum, ascending colon, and transverse colon and a distal region that includes the descending colon, sigmoid colon, and rectum. Although the overall function and architecture are considered similar throughout the whole colon, regional variation exists, as highlighted by the favored development of ulcerative colitis and colorectal cancer in the distal part. The origin of ulcerative colitis always involves the distal colon and progresses toward the proximal colon (11). In colorectal cancer, distinct variation exists between the molecular pathways underlying the development of tumors in the proximal and distal colon (12). One explanation for these regional variations might be the different embryological origins of the proximal and distal colon. The proximal colon originates from the embryonic midgut and is supplied by the superior mesenteric artery, and the distal colon originates from the hindgut and is supplied by the inferior mesenteric artery (13). Gene expression data do not support such a sharp border and suggest a gradual change in gene expression along the human colon (14, 15). Little is known about the global proximal–distal variation in protein levels, and this has not been studied via proteomics approaches. Targeted studies at the protein level have shown that several transporters are differentially expressed, such as monocarboxylic acid transporter 1 and Na+/H+ exchanger 3 (NHE3)1 (16, 17). Monocarboxylic acid transporter 1 is required for butyrate transport, and butyrate is found at the highest concentration in the proximal colon. NHE3 is also more highly expressed in the proximal colon, where most of the fluid reabsorption takes place (18). These results indicate that there is a direct correlation between colonic physiology and protein levels.
Most of the proteomics studies performed on human colon so far have focused on colorectal cancer (19, 20). However, these studies have used cell lines or been limited to one colonic segment, frequently the distal colon, as a representation for the complete organ, neglecting regional variation. In this study, we used non-cancerous colonic tissue to demonstrate the variable levels of membrane proteins along the length of the normal human colon. The main focus was on plasma membrane proteins because of their role in maintaining important colon functions such as ion and water homeostasis and epithelial barrier functions (21, 22), although the enriched membrane fraction analyzed contained most membrane proteins after the removal of nuclei and mitochondria. Mass spectrometry analyses were performed on ascending, transverse, descending, and sigmoid colon for both characterization of the protein composition and quantification using a label-free approach. We show that various biological processes were found to differ between the distal and proximal colon, such as metabolism, antigen presentation, protein O-glycosylation, and ion transport. This extensive dataset emphasizes that the colon is a more dynamic organ than often assumed.
MATERIALS AND METHODS
Isolation of Epithelial Cells from Human Colonic Biopsies
Macroscopically normal biopsies from ascending, descending, transverse, and sigmoid colon (two biopsies from each colon region) were obtained from four patients referred for routine colonoscopy for diagnostic purposes (∼3-mm diameter). Biopsies were frozen in liquid nitrogen and stored at −80 °C until use. Approval was granted by the Human Research Ethical Committee, Gothenburg University, and written informed consent was obtained from all study subjects. Epithelial cells were isolated as described in Ref. 23, with slight modifications. Briefly, tissues were washed in PBS for 5 min and then incubated in PBS containing 3 mm EDTA and 1 mm DTT at 4 °C for 60 min while gently shaken. The solution was replaced with fresh PBS, and epithelial cells were dissociated from the tissue by vigorous shaking for 30 s. The remaining tissue was removed from the solution using a forceps, and cells were pelleted via centrifugation at 500 rpm (5415R, Eppendorf, Hamburg, Germany).
Membrane Protein Extraction, Digestion, and Peptide Fractionation
Pelleted cells were resolved in 500 μl of 2 m NaCl, 1 mm EDTA in 10 mm HEPES, pH 7.4, containing complete protease inhibitor mixture (Roche) and lysed by means of tip-probe sonication (T-8, Turrax, IKA, Staufen, Germany). Membrane proteins were extracted as described in Ref. 24. Briefly, proteins were pelleted via centrifugation at 130,000 × g for 20 min in a tabletop ultracentrifuge (Optima MAX, Beckman Coulter, Fullerton, CA) and dissolved once in 0.1 m Na2CO3, twice in 1 mm EDTA, pH 11.3, and finally in 5 m urea, 100 mm NaCl, 10 mm HEPES, pH 7.4, with pelleting via ultracentrifugation between each step. The final pellet was washed twice with 1 ml of 0.1 m Tris/HCl, pH 7.6, and centrifuged for 10 min at 20,000 × g. Proteins were solubilized in 0.1 m DTT, 4% SDS, 0.1 m Tris/HCl, pH 7.6, added on 30,000-kDa cutoff filters (NanoSep, Pall, Ann Arbor, MI), and digested according to the filter-aided sample preparation method (25) using two-step digestion with endoproteinase Lys-C (Wako, Richmond, VA) overnight followed by trypsin (Promega, Madison, WI) for 4 h, both at room temperature. The concentration of eluted peptides was determined by means of Qubit fluorescent measurement (Invitrogen). 10 μg of each sample was fractionated on a ZIC-HILIC column (3.5 μm, SeQuant, Umeå, Sweden) packed in a fused silica capillary (150 mm × 0.32 mm inner diameter) connected to an Ettan LC (Amersham Biosciences). The following buffers were used: A, 5 mm ammonium acetate in 0.5% formic acid, 95% acetonitrile; and B, 5 mm ammonium acetate. Peptides were eluted using a gradient of 5% to 50% B, and the absorbance was monitored at 280 nm. Six fractions were collected, dried under vacuum, and reconstituted in 15 μl of 0.1% TFA.
Mass Spectrometry Analysis
Sample injection and nano-liquid chromatography were performed using an HTC-PAL autosampler (CTC Analytics, Zwingen, Switzerland) equipped with a Cheminert valve (0.25-mm bore, C2V-1006D-CTC, Valco Instruments, Schenkon, Switzerland) connected to an Agilent 1100 Series degasser and capillary pump (Agilent, Palo Alto, CA). Five microliters of the protein digest mixture was trapped on a fritted pre-column (4 cm × 100 μm inner diameter) packed with 2 cm of 5-μm Reprosil-Pur C18-AQ particles (Dr. Maisch, Ammerbuch, Germany) connected between two MicroTee connectors (Upchurch, Oak Harbor, WA) in a valve switching configuration. The analytical column consisted of a fused silica capillary (15 cm × 75 μm inner diameter, 10 μm tip, New Objective, Woburn, MA) packed with the 3-μm Reprosil-Pur C18-AQ particles (Dr. Maisch). After sample loading in buffer A (0.2% formic acid), the peptides were separated using a piece-linear gradient (10% to 40% B over 60 min and 40% to 70% B over 15 min) with mobile phase B (80% acetonitrile in 0.2% formic acid) at a flow rate of ∼300 nl/min. Mass spectrometry analysis was performed on an LTQ-Orbitrap XL (Thermo) operated in a data-dependent mode automatically switching between scan modes, performing MS/MS on the six most intense ions per precursor scan. MS scans in the mass range of m/z 350–1600 were obtained in the Orbitrap at a resolution of 60,000 measured at 400 m/z, using the lock-mass feature for internal calibration (m/z 371.101). MS/MS fragmentation scans were obtained in the ion trap using collision-induced dissociation of 30% followed by a 60-s exclusion time.
Data Analysis
Raw spectral data were converted using MaxQuant version 1.3.0.5 (26), identified by the integrated database search engine Andromeda (27), and searched against the human Swiss-Prot protein database (release 2013 3, 21,324 entries) combined with a database of common contaminates concatenated with the same sequence database in reversed order for false discovery rate estimation. The following parameters were used for searches: (i) two missed cleavages, trypsin; (ii) precursor tolerance of 20 ppm in the first search used for recalibration, followed by 7 ppm for the main search and 0.5 Da for fragment ions; (iii) carbamidomethyl cysteine (fixed), oxidized methionine, and acetylated protein N-terminal (variable); (iv) a maximum of four modifications per peptide allowed; and (v) match between runs of 2 min. Relative protein quantification was performed based on the extracted ion chromatograms over the elution time window of each identified peptide. Peptide signals were combined for all identified charge states and variable modifications. The match-between-runs feature was used to determine whether peptides also occurred in the same retention time window in adjacent fractions, and the total sum was used for quantification. Identifications and quantifications were combined using the “identify” module in MaxQuant, applying a false discovery rate for both peptide and protein identifications of 1% based on the reversed peptide identifications (cutoff score > 50.83); protein identification was based on a minimum of one unique peptide, and proteins were grouped when based on the same set of peptides. Annotated spectra for all protein identifications based on a single peptide used for quantification are provided as supplemental Fig. S1. Non-unique peptides were strictly used for the quantification of the protein with the most identified peptides (26). The intensity data were converted so that the sum of each protein over the four segments was 1, allowing for comparison between patient datasets. Additional available protein information was retrieved through the mapping feature of UniProt, and functional analyses were performed using the Database for Annotation, Visualization, and Integrated Discovery (DAVID) (28). Membrane proteins were predicted using TMHMM 2.0 (29). Protein abundance factors were calculated by dividing the summed peptide intensities for each protein by the number of theoretically observable peptides of all fully tryptic peptides between 700 and 2500 Da; missed cleavages were neglected, and only carbamidomethylation of cysteine was considered as a fixed modification (30). A paired t test was performed to determine statistical significance between the segments with a false discovery rate value of 0.05. Further data analysis and statistical analysis were performed using the R language and environment for statistical computing. The mass spectrometry data have been deposited to the ProteomeXchange Consortium (http://proteomecentral.proteomexchange.org) with the dataset identifier PXD000987.
Immunohistochemistry
For each collected sample, one reference biopsy per segment was fixed overnight using methanol-Carnoy (31), paraffin embedded, and sectioned at 4 μm. After tissue rehydration and antigen retrieval, sections were incubated overnight with rabbit anti-GCNT3 (1:200; HPA011154, Atlas Antibodies, Stockholm, Sweden) or rabbit anti-B4GALNT2 (1:200; HPA015721, Atlas Antibodies). Secondary Alexa-555-conjugated antibodies were used for detection with anti-mouse anti-rabbit (1:1000; Invitrogen), Hoechst 33258 nuclear counterstained, and imaged using an LSM 700 Axio Examiner Z.1 confocal imaging system with identical settings for all sections.
RESULTS AND DISCUSSION
Characterization of the Colon Membrane Proteome
We aimed to characterize the epithelial cell membrane protein composition and segmental protein levels along the length of the normal human colon to gain insight into the dynamic and distinct regional protein level differences. The proteins were isolated from two 1-mm-sized routine biopsies of ascending, transverse, descending, and sigmoid colon segments, covering the full length of the colon. These biopsies were collected from four different patients without any known colon diseases and with macroscopically normal mucosa. The epithelial cells were isolated, and membrane proteins were isolated and digested using the filter-aided sample preparation method and offline prefractionated using ZIC-HILIC chromatography prior to mass spectrometry analysis. An overview of the sample preparation method is presented in Fig. 1. The mass spectrometry analysis identified between 2598 and 2682 proteins per patient based on the combined identifications of the four segments with a false discovery rate of 1% at both protein and peptide levels. Of the total identifications, 87% were based on at least two unique peptides (peptide spectra matches) with an average of seven unique peptides per protein (median = 4). When we focused only on proteins identified in all patients, a total of 2508 unique proteins were selected for further data analysis (Fig. 2A, supplemental Table S1). 1729 proteins were identified in all patients and in all four segments. Only a small variation in identified proteins was observed, suggesting notable homogeneity in human colon membrane proteins. This group of proteins was for 96% of the proteins based on two or more unique peptides (median = 7) and showed strong correlation among the four segments. This group of proteins was used to quantify the membrane proteins (supplemental Table S2). To address the similarity among the different patients and segment samples, we performed hierarchical clustering of the protein intensities for all shared identified proteins. The sigmoid and ascending samples were both separately grouped with all four samples together, and the two central segments were mixed with a higher correlation toward the sigmoid colon (Fig. 2B).
Fig. 1.
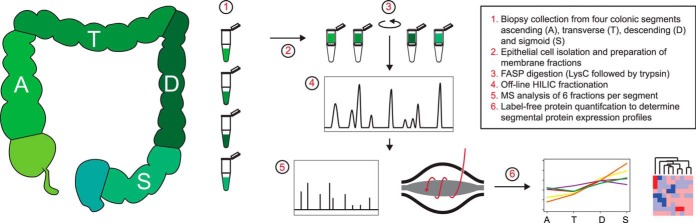
Overview of the experimental procedure to study variable protein levels via label-free mass spectrometry over four different human colon segments.
Fig. 2.

Proteomics analysis of colonic epithelium. A, the combined analyses of the four segments identified 2508 proteins, of which 1729 were shared among all patients. B, hierarchical clustering of the normalized intensities of proteins identified in all segments for each patient (n = 4) grouping all ascending and sigmoid samples together. C, the relative abundance of each protein was estimated by dividing the summed peptide intensities by the number of theoretical observable tryptic peptides. The data are presented as the mean ± S.E. (n = 4), and the approximate abundance range spans over 5 orders of magnitude. D, the 25 most abundant proteins from the abundance estimation curve. The most abundant were mainly mitochondrial proteins involved in ATP synthesis, of which 15 contained transmembrane-spanning domains. E, the 25 least abundant proteins included isoforms and soluble cytoplasmic proteins.
To assess the dynamic range of the analysis, we estimated the relative abundance of each protein based on the sum of peptide ion intensities per protein divided by the number of theoretical tryptic peptides (700–2500 Da) to normalize for varying protein length (30). The proteins were ranked depending on their estimated abundance and spanned over 5 orders of magnitude between the highest and lowest abundant protein, showing the depth of our analysis (Fig. 2C). A majority of the 25 most abundant proteins originated from the mitochondria comprising parts of the ATP synthesis and cytochrome C oxidase complexes (Fig. 2D). The abundance of proteins belonging to the mitochondrial respiratory chain suggests that the highly biological active colonic cells require vast amounts of energy. The bottom part of the abundance plot consists mainly of soluble proteins, as the applied sample preparation method favors hydrophobic proteins (Fig. 2E). The relative abundance estimation can therefore be used only for hydrophobic and transmembrane-spanning proteins.
Enrichment of Membrane Proteins from Colon Epithelium
In standard proteomics workflows, membrane proteins are often underrepresented because of their amphiphilic properties. Various methods for enriching membrane proteins have been developed, and here we used an established method based on sodium carbonate washes at high pH combined with ultracentrifugation (32, 33). We identified a total of 2508 proteins from the four colon segments, of which 1098 (44%) were predicted to contain transmembrane-spanning domains based on the TMHMM model (29), exceeding the 20% to 30% membrane proteins predicted in the human genome (34). The effectiveness of the membrane protein extraction was further evaluated by comparing the hydrophobicity of the identified proteins to a reference colon proteome extracted from the Human Protein Atlas (35). The proteins selected from the database had staining that was annotated as moderate or strong in colonic glandular cells (v. 12, 2013; 10,088 entries). The overall distribution of the identified proteins showed a general increase in hydrophobicity relative to this reference proteome (Fig. 3A). The percentage of identified proteins increased along the hydrophobic scale, which is consistent with the greater number of membrane proteins expected in this region. Increased amounts of membrane proteins were also observed when the number of identified proteins was compared with proteins predicted to contain transmembrane-spanning domains (Fig. 3B). On average we identified 54% of the proteins containing transmembrane-spanning domains in the reference proteome, compared with only 20% of the proteins without predicted transmembrane-spanning domains. Fifteen out of the 25 most abundant proteins contained transmembrane-spanning domains, whereas only 5 out the 25 least abundant ones did (Figs. 2D, 2E). These numbers are likely an underestimation, as they do not take into account membrane-coupled and peripheral membrane proteins. For example, the most abundant protein identified was ATP5H, which is part of the complex responsible for proton transport over the mitochondrial membrane. Overall, the high levels of identified proteins with high hydrophobicity indicate that the enrichment methodology was efficient, resulting in the identification of 1098 membrane proteins.
Fig. 3.
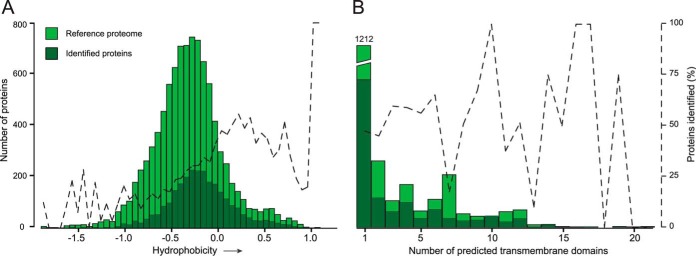
Enrichment of transmembrane-spanning proteins. A, a reference proteome was obtained from the Human Protein Atlas containing all proteins expressed in the colonic epithelium (glandular cells) that had an antibody staining of moderate or strong intensity. The hydrophobicity of all proteins was calculated based on the grand average of hydropathy. Dark green bars represent the proteins identified via mass spectrometry, and those in light green represent the reference proteome. The secondary axis shows the percentage of proteins identified. B, transmembrane-spanning helixes for all proteins were predicted using the TMHMM algorithm. All proteins containing 1 to 20 helixes were compared between the identified and control datasets.
Differences in Biological Processes from Ascending to Sigmoid Colon
To obtain a general overview of which biological processes are gradually changed along the colon and in which direction, we functionally classified significantly regulated proteins according to PANTHER (36). Significance was determined by performing a paired t test comparing the normalized intensities of the ascending and sigmoid segments. A total of 261 proteins (p < 0.1) were selected for functional enrichment analysis in which the entries for ascending and transverse were compared with those for descending and sigmoid (supplemental Table S2). The significance threshold was chosen to give sufficient input to reach significance in the enrichment analysis. A majority of the identified regulated processes were related to metabolism, protein synthesis, transport, and immunity (Fig. 4A). In the ascending and transverse colon segments, the majority of the processes were involved in metabolism, which could be assumed to rapidly decrease toward the distal colon as exemplified in Fig. 4B. Digestion and absorption of nutrients largely take place in the small intestine, whereas colon is supposed to reabsorb fluid and ferment indigestible carbohydrates from the food and host. Our results suggest that the absorption of nutrients is not restricted to the small intestine and that the proximal colon is also active in the final stages of digestion (Fig. 4B). The proteins involved in lipid metabolism are most abundant in the ascending colon and decrease gradually toward the sigmoid colon. Apolipoprotein B-100, required for the formation of chylomicrons by enterocytes (37), is a good example, as it decreased 1.6-fold toward the distal colon.
Fig. 4.

Protein level changes categorized by biological functional group. A, protein groups with a significant change (p < 0.1) between the ascending and sigmoid segment were selected and mapped to Panther protein classes for enrichment analysis. The eight most significant enriched biological processes are presented here, sorted according to the p value after Bonferonni correction for ascending (a) and transverse (t) combined and descending (d) and sigmoid (s) combined. Numbers in brackets indicate proteins per category identified in each dataset. Differentially expressed individual proteins enriched in the first two segments involved in (B) lipid-fatty acid-steroid metabolism, other metabolism, and (C) MHCI-mediated immunity. Profile of protein amounts involved in protein O-glycosylation enriched in the last two segments (D). The profiles are based on the average normalized amounts (n = 4).
We also observed a rapid decline in proteins involved in MHC class I presentation of antigens (Fig. 4C). The trend of this had a similar direction for 85% of all identified HLA proteins (14 entries) and included MHC class II proteins as well, suggesting that the ascending colon has a more active role in antigen presentation than the distal colon (supplemental Table S3). In germ-free mice, the MHC class proteins have been shown to be reduced, indicating a relation between MHC and the gut microbiota (38). The high abundance of these antigen-presenting molecules in proximal colon could also suggest more contact between the luminal content and the epithelial surface, something that could be related to the more permeable mucus in the proximal part of the colon (39). Additionally, glycosyltransferases involved in initiating protein O-glycosylation are increased toward the distal colon, potentially resulting in a more dense glycosylation pattern on the proteins expressed in the distal colon (Fig. 4D).
Membrane Proteins with Greatest Segmental Variation in Amount
The majority of proteins identified in all segments were found in similar amounts along the length of the colon. The distribution of ratios between ascending and sigmoid colon was normal, confirming this conclusion (Fig. 5A). Only a small group of proteins were present in significantly different amounts between contiguous segments (see column AC–AE in supplemental Table S2), and we therefore chose to compare the two extremes, the ascending and the sigmoid colon This selection gave 144 proteins that were significantly different between the two segments (p < 0.05). We performed hierarchical clustering analysis on the 105 proteins that were predicted to have transmembrane domains using TMHMM or that were annotated as membrane proteins according to UniProt annotation (29, 40). Two distinct clusters were observed, one group containing 19 proteins with the highest levels in the sigmoid colon and one group of 86 proteins that were more abundant in the ascending colon (Fig. 5B). The direction of the heat map gradient suggests that most proteins were gradually changing along the length of the colon, with the majority of the proteins showing decreased levels toward the sigmoid colon.
Fig. 5.
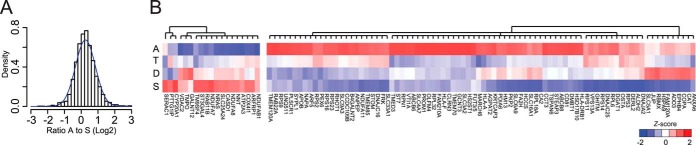
Significant regulated proteins between the ascending and sigmoid colon. A, the overall distribution of protein ratios between the ascending and sigmoid colon in bins with the theoretical normal distribution in blue. B, cluster of the 105 significantly (p < 0.05) regulated membrane proteins between the ascending and sigmoid colon. The color code is based on the z-score of the averaged normalized intensity.
Transport Proteins along the Length of the Colon
In ascending colon, a large subset of significantly regulated proteins belonged to the solute carrier (SLC) transporter protein family involved in the transport of various molecules over the membranes (Fig. 5B). The amount of transporter SLC16A1, involved in butyrate transport, was found to be 2.5 times greater in the ascending colon than in the sigmoid colon, something that correlates with previous studies of mRNA expression levels (14). Transporters involved in the absorption of amino acids (SLC3A2 and SLC6A7) and glucose (Na+/glucose co-transporter SLC5A1) showed a similar protein pattern. The amount of SLC5A1 was 2.4-fold greater in the ascending colon than in the sigmoid colon, which also correlates with mRNA expression (41). We also found that the transport of bile acids via basolateral organic solute transporter subunit alpha (SLC51A) was increased 4.2-fold in the ascending colon (42).
Ion transport is known to differ along the length of the colon, but how this relates to differences in protein levels of the involved transporters is not fully understood. Our dataset allowed us to analyze the segmental levels of transporters involved in cation transport mechanisms. Colonic ion absorption takes place via electroneutral or electrogenic uptake mechanisms. Electroneutral absorption operates via exchangers, such as the apical Na+/H+ exchangers (NHE3 (SLC9A3) and NHE2 (SLC9A2)) coupled to the Cl−/HCO3− exchanger (DRA, SLC26A3) resulting in apical uptake of NaCl. Absorbed Na+ ions exit the cell via the basolateral transporters Na+/K+-ATPase and NHE1 (SLC9A1), and the Cl− ions exit the cell via the Cl−/HCO3− exchanger AE1 (SLC4A1). Our results show that NHE3 levels were highest in the ascending colon and gradually decreased (5.8-fold) toward the sigmoid colon (Table I). In contrast, all other transporters (NHE1, NHE2, DRA, and Na+/K+-ATPase) showed constant protein levels along the length of the colon. That the NHE3 and DRA levels did not follow each other suggests that coupling of these exchangers is not obligatory and that additional factors are involved in regulating NaCl absorption. One of the rate-limiting factors for DRA activity is the intracellular concentration of HCO3−. Studies have shown that DRA activity depends on the intracellular production of HCO3− through carbonic anhydrase 2, which converts H2O and CO2 to HCO3− (43). The pattern of carbonic anhydrase 2 followed that of NHE3, with the highest levels in the ascending colon (1.8-fold increase), suggesting that despite similar amounts of DRA along the colon, the transport activity might be higher in the ascending colon than in the sigmoid colon because of the greater intracellular production of HCO3−.
Table I. Identified proteins responsible for ion transport over the epithelium.
| Gene | Protein accession | Protein name | Unique peptides | Ratio A/S (Log2) |
|---|---|---|---|---|
| Apical ion transport | ||||
| NHE3 | P48764 | Sodium/hydrogen exchanger 3 | 12 | 2.54a |
| DRA | P40879 | Chloride anion exchanger | 23 | −0.15 |
| CFTR | P13569 | Cystic fibrosis transmembrane conductance regulator | 8 | 0.33 |
| KCNN4 | O15554 | Intermediate conductance calcium-activated potassium channel protein 4 | 3 | 1.59 |
| NHE2 | Q9UBY0 | Sodium/hydrogen exchanger 2 | 5 | −0.25 |
| Basolateral ion transport | ||||
| ATP1A1 | P05023 | Sodium/potassium-transporting ATPase subunit α-1 | 39 | −0.22 |
| NKCC1 | P55011 | Solute carrier family 12 member 2 | 29 | 0.64 |
| NBCN1 | Q9Y6M7 | Sodium bicarbonate cotransporter 3 | 2 | 1.19a |
| NBCE1 | Q9Y6R1 | Electrogenic sodium bicarbonate cotransporter 1 | 12 | 0.08 |
| AE1 | P02730 | Band 3 anion transport protein | 12 | 0.04 |
| KCNN4 | O15554 | Intermediate conductance calcium-activated potassium channel protein 4 | 3 | 0.67 |
| NHE1 | P19634 | Sodium/hydrogen exchanger 1 | 6 | 0.26 |
a Significantly regulated (p < 0.05).
Anion secretion (chloride and bicarbonate) creates the driving force for fluid secretion. Our analyses of the transporters involved in chloride secretion showed constant levels of both the apical CFTR chloride channel and the basolateral Na/K/Cl co-transporter NKCC1 that mediates uptake of Cl− along the length of the colon. In contrast, the Ca2+-dependent K+ channel KCNN4, whose activity is necessary for maintenance of the negative intracellular electrochemical gradient in favor of anion secretion, showed higher levels in the ascending colon. This suggests a stronger driving force for chloride secretion in this segment, as has been shown in functional studies (44, 45). We also identified two members of the Anoctamin family (ANO9 and ANO10), a family that has been suggested to consist of Ca2+-activated chloride channels (46). ANO10 has been shown to form a functional channel, whereas the ion channel status of ANO9 is unknown (47, 48). ANO9 showed greater amounts in the ascending colon, whereas ANO10 showed constant levels along the length of the colon.
Colonic bicarbonate secretion involves basolateral uptake of HCO3− via Na+/HCO3− co-transport (NBCe1, SLC4A4) and apical exits via the CFTR channel or via DRA. Our results showed constant amounts along the length of the colon for CFTR, DRA, and the basolateral NBCe1 (Table I). As for chloride, bicarbonate secretion requires activation of the K+ channel KCNN4, suggesting that bicarbonate secretion might also be higher in the ascending colon than in the sigmoid colon (49). Bicarbonate secretion mediated via CFTR, DRA, and NBCe1 is specific to the enterocytes (17), but the goblet cells have specific bicarbonate transport systems mediated via the electroneutral Na+/HCO3− co-transporter NBCn1 (SLC4A7) that have been suggested to be important for mucus formation. Our results showed higher levels of NBCn1 in the ascending colon, suggesting that goblet-cell-mediated bicarbonate transport is increased in the ascending colon relative to the sigmoid colon (Table I). The increased levels of the small GTPase RAB11B toward the sigmoid colon responsible for the recycling of ion channels expressed at the apical membrane can also influence ion transport (Fig. 5B) (50).
Glycosyltransferases along the Length of the Colon
In general we found a proximal-to-distal increase in amounts of enzymes involved in O-glycosylation (Fig. 4D). These enzymes take part in the biosynthesis of all colonic glycoproteins; however, by far the most abundant highly glycosylated protein is the MUC2 mucin (51). This mucin is produced by the goblet cells and is required for the formation of the protective mucus layer. The proteins' central region is composed of two serine, proline, and threonine repeats (∼2600 amino acids) that upon O-glycosylation contribute to 80% of the proteins' molecular mass. Glycomic studies have shown that the glycan structures on the MUC2 mucin in the colon are complex but are relatively homogeneous within one segment (9, 52). Complex mucin type O-glycosylation involves a broad range of glycosyltransferases, which can be found throughout the Golgi apparatus. As glycosyltransferases have a transmembrane domain, the membrane enrichment method used allowed relative quantification of the different transferases along the four segments, providing indirect support for the O-glycan composition on the MUC2 mucin (Fig. 6). The relative abundance of each glycosyltransferase was estimated based on the total peptide signal obtained for each protein normalized to the number of theoretically observable tryptic peptides (Fig. 7A).
Fig. 6.

Identified glycotransferases involved in O-glycosylation and associated biosynthetic pathway. A, identified glycotransferases were quantified in all four colon segments based on the z-score transformed summed protein intensities for ascending (a), transverse (t), descending (d), and sigmoid (s) colon (n = 4). The O-glycans of the MUC2 mucin as determined previously have shown that human colon has only core 3– and core 4–based O-glycan structures. The biosynthetic pathways of the glycans observed were confirmed by the core glycotransferases identified. The lower highlighted area shows the extension of core 4 glycans, which can terminate in various structures. The highlighted region in the top left shows the identified sulfotransferases acting on both core 3 and core 4 structures. Proteins highlighted by an asterisk (*) were significantly (p < 0.05) regulated between ascending and sigmoid colon.
Fig. 7.
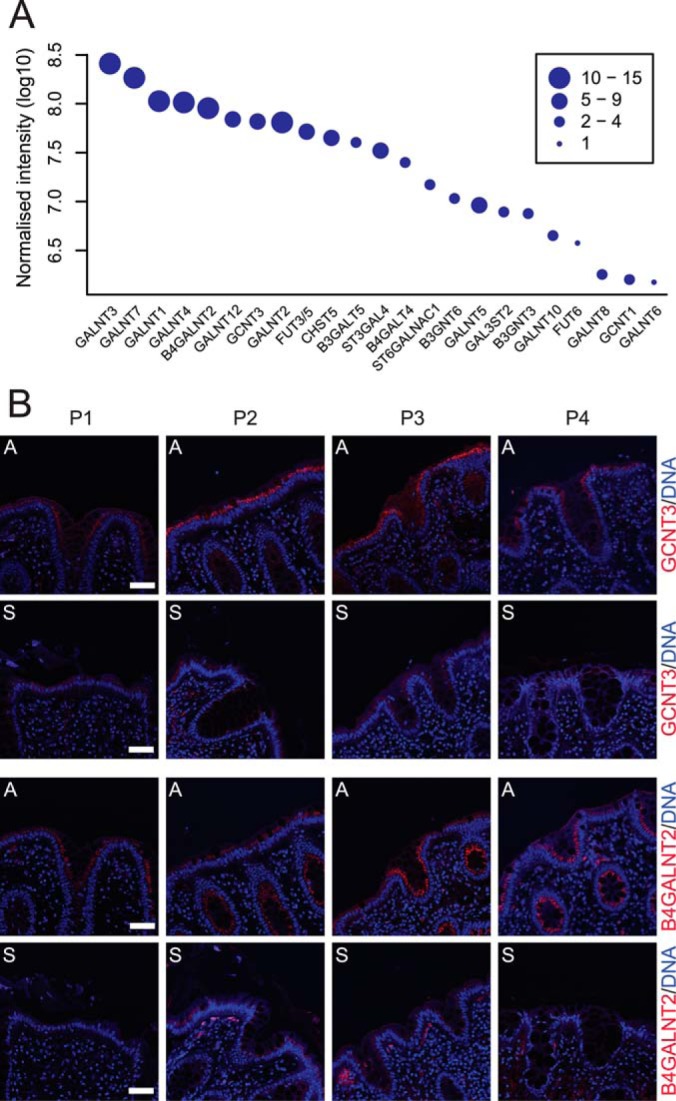
Relative abundance and immunohistochemistry of the identified glycotransferases involved in O-glycosylation. A, relative abundance of the identified glycosyltransferases combined for all colon segments showing a 100-fold difference between the most and least abundant transferase. The size of the points indicates the number of uniquely identified peptides assigned to each glycosyltransferase. B, immunostaining (red) of the glycosyltransferases B4GALNT2 and GCNT3 in tissue sections from ascendant (a) and sigmoid colon (s) of the four patients included in this study (P1–P4). Nuclei were stained with Hoechst (blue). Bar = 50 μm.
The family of peptidyl GalNAc-transferases required for initiating the O-glycosylation contains 20 members (53). In the colon we identified eight members of this family (Fig. 6), of which two are active only on glycopeptides (T7 and T12). The other ppGalNAc-transferases all have distinct specificities. The two most dominant ppGalNAc transferases identified were numbers 3 and 7, which we previously showed to be the most efficient in glycosylating MUC2-derived peptides (54). ppGalNAc-transferases 2, 3, 4, 5, and 7 all increased toward the sigmoid colon, which could reflect the fast turnover of MUC2 in the distal colon (55). The same set of ppGalNAc-transferases was previously found to be more abundant in relation to other glycosyltransferases in a study of colon tissue in relation to adenocarcinoma (56).
The glycosyltransferases B3GNT6 and GCNT3 are responsible for the extension of the attached GalNAc (Tn antigen) into the core 3 (GlcNAcβ1–3GalNAc) and core 4 (GlcNAcβ1–3(GlcNAcβ1–6)GalNAc) structures. These are the major core structures found in human colon MUC2, with core 3 and core 4 as the most predominant forms in the ascending segment (9). We also identified GCNT1, responsible for core 2 synthesis. However, as the formation of core 2 requires initial extension of core 1, an enzyme that was absent, there was no substrate for this enzyme. Further elongation of the core structures is achieved by the addition of the GlcNAc and Gal, for which we identified B3GNT3, B3GALT5, and B4GALT4 transferases, with B3GALT5 adding Gal on the 3-branch and B4GALT4 on the 6-branch.
The greatest variation in protein levels was observed for the glycosyltransferases required for adding terminating residues. The fucosyltransferases FUT3, -5, and -6 required for the incorporation of Fuc on GlcNAc (Fuc1–3,4GalNAc) showed a distinct reduction in levels from the ascending toward the sigmoid colon, which is reflected in the low level of fucosylation in the sigmoid colon (52). The signal for FUT3/5 was combined as a result of high sequence homology. Still, FUT3/5 was 14-fold more abundant than FUT6 (Fig. 7A), giving a clear indication that FUT3 and FUT5 are major contributors to colon fucosylation.
The sialyltranferases ST6GALN1 and ST3GAL4 and the sulfotransferase CHST5 responsible for sulfating GlcNAc increased toward the sigmoid colon. This is in line with the previously observed high acidity of the O-glycan structures in the distal colon (9). The Sda/Cad epitope (NeuAc2–3(GalNAc1–4)Gal), typical for the human colon, was most abundant in the distal colon (9). This epitope is synthesized by ST3GAL4 adding NeuAc followed by B4GALNT2 adding GalNAc and absolutely requires NeuAc on its substrate. ST3GAL4 showed increased levels in the distal direction and was thus responsible for the distal gradient of the Sda/Cad epitope. That B4GALNT2 was most abundant in the proximal colon might seem counterintuitive, but there was obviously sufficient enzyme in distal parts also, as this enzyme was relatively abundant throughout the length (Fig. 7A).
Immunohistochemistry of sections from ascending and sigmoid colon for two of the significantly regulated glycosyltransferases B4GALNT3 and GCNT3 confirmed our proteomic observations. A reduction in staining intensity was observed between the ascending and sigmoid colon sections for all four patients, indicating reduced amounts of proteins in the distal segment (Fig. 7B).
These results are the first global overview of the glycosyltransferases responsible for O-glycosylation in the human colon and their variation along the colonic axis. The identified glycosyltransferases are directly correlated with the O-glycan structures previously determined, and the estimated relative abundance of each identified transferase explains which enzyme is responsible for each step. If the glycan structures had not been determined as in this case, this type of information could be used to predict the oligosaccharide structures produced.
CONCLUSIONS
Our focus in this study was on the membrane proteins of colonic epithelial cells. Major cellular events are membrane associated, such as, for example, ion homeostasis and epithelial barrier function. The complexity of the biological samples and unfavorable properties of membrane proteins limit the in-depth analysis of these proteins unless specific enrichment strategies are used. We successfully used a simple enrichment method compatible with the small amounts of starting material available from millimeter-sized human colonic biopsies. More laborious membrane-enrichment protocols are not compatible with such small amounts of starting material. The presented results show that simple preparation methods combined with today's sensitive mass spectrometers are sufficient to provide in-depth knowledge of low abundant proteins such as, for example, ion channels and glycosyltransferases.
To the best of our knowledge, this is the first comprehensive profile of membrane protein levels along the length of the healthy human colon emphasizing regional heterogeneity. This information can be used to obtain a better understanding of how various biological processes of the colonic epithelium vary along the proximal–distal axis. Additionally, the dataset can be used for comparisons between healthy and diseased tissue specimens, such as samples from patients with inflammatory bowel disease or colon cancer. We further confirmed the presence of proteins responsible for phenomena previously only recorded via electrophysiology as ion transport activities or end products of glycosyltransferase activities.
Supplementary Material
Acknowledgments
We are grateful to Dr. Jin Chunsheng and Dr. Jenny Gustafsson for expert input on glycosyltransferases and ion transport.
Footnotes
Author contributions: S. vd P. and G.C.H. designed research; S. vd P. performed research; S. vd P. and G.C.H. analyzed data; S. vd P. and G.C.H. wrote the paper.
* This work was supported by the Swedish Research Council (Grant Nos. 7461 and 21027), Swedish Cancer Foundation, Knut and Alice Wallenberg Foundation, IngaBritt and Arne Lundberg Foundation, Sahlgren's University Hospital (LUA-ALF), Wilhelm and Martina Lundgren Foundation, Torsten and Ragnar Söderberg Foundation, Adlerbert Research Foundation, Sahlgrenska Academy, National Institute of Allergy and Infectious Diseases (U01AI095473), and Swedish Foundation for Strategic Research - Mucus, Bacteria, Colitis Center (MBC, Innate Immunity Program).
 This article contains supplemental material.
1 The abbreviations used are:
- NHE
- Na+/H+ exchanger
- MHC
- major histocompatibility complex.
REFERENCES
- 1. de Graaf A. A., Maathuis A., de Waard P., Deutz N. E. P., Dijkema C., De Vos W. M., Venema K. (2010) Profiling human gut bacterial metabolism and its kinetics using [U-13C]glucose and NMR. NMR Biomed. 23, 2–12 [DOI] [PubMed] [Google Scholar]
- 2. Luckey T. D. (1972) Introduction to intestinal microecology. Am. J. Clin. Nutrition 25, 1292–1294 [DOI] [PubMed] [Google Scholar]
- 3. Hansson G. C. (2011) Role of mucus layers in gut infection and inflammation. Curr. Opin. Microbiol. 15, 57–62 [DOI] [PMC free article] [PubMed] [Google Scholar]
- 4. Gustafsson J. K., Ermund A., Johansson M. E. V., Schütte A., Hansson G. C., Sjövall H. (2012) An ex vivo method for studying mucus formation, properties, and thickness in human colonic biopsies and mouse small and large intestinal explants. AJP Gastrointest. Liver Physiol. 302, G430–G438 [DOI] [PMC free article] [PubMed] [Google Scholar]
- 5. Johansson M. E. V., Phillipson M., Petersson J., Velcich A., Holm L., Hansson G. C. (2008) The inner of the two Muc2 mucin-dependent mucus layers in colon is devoid of bacteria. Proc. Natl. Acad. Sci. U.S.A. 105, 15064–15069 [DOI] [PMC free article] [PubMed] [Google Scholar]
- 6. Petersson J., Schreiber O., Hansson G. C., Gendler S. J., Velcich A., Lundberg J. O., Roos S., Holm L., Phillipson M. (2011) Importance and regulation of the colonic mucus barrier in a mouse model of colitis. AJP Gastrointest. Liver Physiol. 300, G327–G333 [DOI] [PMC free article] [PubMed] [Google Scholar]
- 7. Fu J., Wei B., Wen T., Johansson M. E. V., Liu X., Bradford E., Thomsson K. A., Mcgee S., Mansour L., Tong M., Mcdaniel J. M., Sferra T. J., Turner J. R., Chen H., Hansson G. C., Braun J., Xia L. (2011) Loss of intestinal core 1–derived O-glycans causes spontaneous colitis in mice. J. Clin. Invest. 121, 1657–1666 [DOI] [PMC free article] [PubMed] [Google Scholar]
- 8. Robbe C., Capon C., Maes E., Rousset M., Zweibaum A., Zanetta J., Michalski J. (2003) Evidence of regio-specific glycosylation in human intestinal mucins. J. Biol. Chem. 278, 46337. [DOI] [PubMed] [Google Scholar]
- 9. Robbe C., Capon C., Coddeville B., Michalski J.-C. (2004) Structural diversity and specific distribution of O-glycans in normal human mucins along the intestinal tract. Biochem. J. 384, 307. [DOI] [PMC free article] [PubMed] [Google Scholar]
- 10. Staubach F., Künzel S., Baines A. C., Yee A., McGee B. M., Bäckhed F., Baines J. F., Johnsen J. M. (2012) Expression of the blood-group-related glycosyltransferase B4galnt2 influences the intestinal microbiota in mice. ISME J. 6, 1345–1355 [DOI] [PMC free article] [PubMed] [Google Scholar]
- 11. Magro F., Rodrigues A., Vieira A. I., Portela F., Cremers I., Cotter J., Correia L., Duarte M. A., Tavares M. L., Lago P. (2012) Review of the disease course among adult ulcerative colitis population-based longitudinal cohorts. Inflamm. Bowel Dis. 18, 573–583 [DOI] [PubMed] [Google Scholar]
- 12. Iacopetta B. (2002) Are there two sides to colorectal cancer? Int. J. Cancer 101, 403–408 [DOI] [PubMed] [Google Scholar]
- 13. Barrett K. E., Ghishan F. K., Merchant J. L., Said H. M., Wood J. D. (2006) Physiology of the Gastrointestinal Tract, Academic Press, Waltham, MA [Google Scholar]
- 14. LaPointe L. C., Dunne R., Brown G. S., Worthley D. L., Molloy P. L., Wattchow D., Young G. P. (2008) Map of differential transcript expression in the normal human large intestine. Physiol. Genom. 33, 50–64 [DOI] [PubMed] [Google Scholar]
- 15. Birkenkamp-Demtroder K., Olesen S. H., Sørensen F. B., Laurberg S., Laiho P., Aaltonen L. A., Orntoft T. F. (2005) Differential gene expression in colon cancer of the caecum versus the sigmoid and rectosigmoid. Gut 54, 374–384 [DOI] [PMC free article] [PubMed] [Google Scholar]
- 16. Cuff M. A., Lambert D. W., Shirazi-Beechey S. P. (2002) Substrate-induced regulation of the human colonic monocarboxylate transporter, MCT1. J. Physiol. 539, 361–371 [DOI] [PMC free article] [PubMed] [Google Scholar]
- 17. Jakab R. L., Collaco A. M., Ameen N. A. (2011) Physiological relevance of cell-specific distribution patterns of CFTR, NKCC1, NBCe1, and NHE3 along the crypt-villus axis in the intestine. AJP Gastrointest. Liver Physiol. 300, G82–G98 [DOI] [PMC free article] [PubMed] [Google Scholar]
- 18. Sandle G. I. (1998) Salt and water absorption in the human colon: a modern appraisal. Gut 43, 294–299 [DOI] [PMC free article] [PubMed] [Google Scholar]
- 19. Fung K. Y. C., Ooi C. C., Lewanowitsch T., Tan S., Tan H. T., Lim T. K., Lin Q., Williams D. B., Lockett T. J., Cosgrove L. J., Chung M. C. M., Head R. J. (2012) Identification of potential pathways involved in induction of apoptosis by butyrate and 4-benzoylbutyrate in HT29 colorectal cancer cells. J. Proteome Res. 11, 6019–6029 [DOI] [PubMed] [Google Scholar]
- 20. Jimenez C. R., Knol J. C., Meijer G. A., Fijneman R. J. A. (2010) Proteomics of colorectal cancer: overview of discovery studies and identification of commonly identified cancer-associated proteins and candidate CRC serum markers. J. Proteomics 73, 1873–1895 [DOI] [PubMed] [Google Scholar]
- 21. Kunzelmann K., Mall M. (2002) Electrolyte transport in the mammalian colon: mechanisms and implications for disease. Physiol. Rev. 82, 245–289 [DOI] [PubMed] [Google Scholar]
- 22. Peterson L. W., Artis D. (2014) Intestinal epithelial cells: regulators of barrier function and immune homeostasis. Nat. Rev. Immunol. 14, 141–153 [DOI] [PubMed] [Google Scholar]
- 23. Whitehead R. H., Brown A., Bhathal P. S. (1987) A method for the isolation and culture of human colonic crypts in collagen gels. In Vitro Cell. Dev. Biol. 23, 436–442 [DOI] [PubMed] [Google Scholar]
- 24. Lu A., Wiœniewski J. R., Mann M. (2009) Comparative proteomic profiling of membrane proteins in rat cerebellum, spinal cord, and sciatic nerve. J. Proteome Res. 8, 2418–2425 [DOI] [PubMed] [Google Scholar]
- 25. Wiœniewski J. R., Zougman A., Nagaraj N., Mann M. (2009) Universal sample preparation method for proteome analysis. Nat. Methods 6, 359–362 [DOI] [PubMed] [Google Scholar]
- 26. Cox J., Mann M. (2008) MaxQuant enables high peptide identification rates, individualized p.p.b.-range mass accuracies and proteome-wide protein quantification. Nat. Biotechnol. 26, 1367–1372 [DOI] [PubMed] [Google Scholar]
- 27. Cox J., Neuhauser N., Michalski A., Scheltema R. A., Olsen J. V., Mann M. (2011) Andromeda: a peptide search engine integrated into the MaxQuant environment. J. Proteome Res. 10, 1794–1805 [DOI] [PubMed] [Google Scholar]
- 28. Huang D. W., Sherman B. T., Lempicki R. A. (2008) Systematic and integrative analysis of large gene lists using DAVID bioinformatics resources. Nat. Protoc. 4, 44–57 [DOI] [PubMed] [Google Scholar]
- 29. Sonnhammer E. L., von Heijne G., Krogh A. (1998) A hidden Markov model for predicting transmembrane helices in protein sequences. Proc. Int. Conf. Intell. Syst. Mol. Biol. 6, 175–182 [PubMed] [Google Scholar]
- 30. Schwanhäusser B., Busse D., Li N., Dittmar G., Schuchhardt J., Wolf J., Chen W., Selbach M. (2011) Global quantification of mammalian gene expression control. Nature 473, 337–342 [DOI] [PubMed] [Google Scholar]
- 31. Puchtler H., Waldrop F. S., Meloan S. N., Terry M. S., Conner H. M. (1970) Methacarn (methanol-Carnoy) fixation. Histochem. Cell Biol. 21, 97–116 [DOI] [PubMed] [Google Scholar]
- 32. Fujiki Y., Hubbard A., Fowler S., Lazarow P. (1982) Isolation of intracellular membranes by means of sodium carbonate treatment: application to endoplasmic reticulum. J. Cell Biol. 93, 97. [DOI] [PMC free article] [PubMed] [Google Scholar]
- 33. Wu C. C., MacCoss M. J., Howell K. E., Yates J. R. (2003) A method for the comprehensive proteomic analysis of membrane proteins. Nat. Biotechnol. 21, 532–538 [DOI] [PubMed] [Google Scholar]
- 34. Wallin E., Heijne, von G. (1998) Genome-wide analysis of integral membrane proteins from eubacterial, archaean, and eukaryotic organisms. Protein Sci. 7, 1029–1038 [DOI] [PMC free article] [PubMed] [Google Scholar]
- 35. Uhlén M., Björling E., Agaton C., Szigyarto C. A.-K., Amini B., Andersen E., Andersson A.-C., Angelidou P., Asplund A., Asplund C., Berglund L., Bergström K., Brumer H., Cerjan D., Ekström M., Elobeid A., Eriksson C., Fagerberg L., Falk R., Fall J., Forsberg M., Björklund M. G., Gumbel K., Halimi A., Hallin I., Hamsten C., Hansson M., Hedhammar M., Hercules G., Kampf C., Larsson K., Lindskog M., Lodewyckx W., Lund J., Lundeberg J., Magnusson K., Malm E., Nilsson P., Odling J., Oksvold P., Olsson I., Oster E., Ottosson J., Paavilainen L., Persson A., Rimini R., Rockberg J., Runeson M., Sivertsson A., Sköllermo A., Steen J., Stenvall M., Sterky F., Strömberg S., Sundberg M., Tegel H., Tourle S., Wahlund E., Waldén A., Wan J., Wernérus H., Westberg J., Wester K., Wrethagen U., Xu L. L., Hober S., Pontén F. (2005) A human protein atlas for normal and cancer tissues based on antibody proteomics. Mol. Cell. Proteomics 4, 1920–1932 [DOI] [PubMed] [Google Scholar]
- 36. Mi H., Muruganujan A., Casagrande J. T., Thomas P. D. (2013) Large-scale gene function analysis with the PANTHER classification system. Nat. Protoc. 8, 1551–1566 [DOI] [PMC free article] [PubMed] [Google Scholar]
- 37. Iqbal J., Hussain M. M. (2009) Intestinal lipid absorption. AJP Endocrinol. Metab. 296, E1183–E1194 [DOI] [PMC free article] [PubMed] [Google Scholar]
- 38. Round J. L., Mazmanian S. K. (2009) The gut microbiota shapes intestinal immune responses during health and disease. Nat. Rev. Immunol. 9, 313–323 [DOI] [PMC free article] [PubMed] [Google Scholar]
- 39. Ermund A., Schütte A., Johansson M. E., Gustafsson J. K., Hansson G. C. (2013) Studies of mucus in mouse stomach, small intestine, and colon. I. Gastrointestinal mucus layers have different properties depending on location as well as over the Peyer's patches. Am. J. Physiol. Gastrointest. Liver Physiol. 305, G341–G347 [DOI] [PMC free article] [PubMed] [Google Scholar]
- 40. Bairoch A. (2004) The Universal Protein Resource (UniProt). Nucleic Acids Res. 33, D154–D159 [DOI] [PMC free article] [PubMed] [Google Scholar]
- 41. Turk E., Wright E. M. (2004) The sodium/glucose cotransport family SLC5. Pflugers Arch. 447, 510–518 [DOI] [PubMed] [Google Scholar]
- 42. Khan A. A., Chow E. C. Y., Porte R. J., Pang K. S., Groothuis G. M. M. (2009) Expression and regulation of the bile acid transporter, OST α-OST β in rat and human intestine and liver. Biopharm. Drug Dispos. 30, 241–258 [DOI] [PubMed] [Google Scholar]
- 43. Sterling D., Brown N. J., Supuran C. T., Casey J. R. (2002) The functional and physical relationship between the DRA bicarbonate transporter and carbonic anhydrase II. Am. J. Physiol. Cell Physiol. 283, C1522–1529 [DOI] [PubMed] [Google Scholar]
- 44. Gustafsson J. K., Hansson G. C., Sjovall H. (2012) Ulcerative colitis patients in remission have an altered secretory capacity in the proximal colon despite macroscopically normal mucosa. Neurogastroenterolgy & Motility 24 (2012), e381–e391 [DOI] [PMC free article] [PubMed] [Google Scholar]
- 45. Park J. H., Rhee P. L., Lee J. H., Kim J. J., Rhee J. C., Kim S. J., Lee J. (2006) Segmental heterogeneity of electrogenic secretions in human ascending colon and rectum. Int. J. Colorectal Dis. 21, 357–364 [DOI] [PubMed] [Google Scholar]
- 46. Tian Y., Schreiber R., Kunzelmann K. (2012) Anoctamins are a family of Ca2+-activated Cl- channels. J. Cell Sci. 125, 4991–4998 [DOI] [PubMed] [Google Scholar]
- 47. Kunzelmann K., Schreiber R., Kmit A., Jantarajit W., Martins J. R., Faria D., Kongsuphol P., Ousingsawat J., Tian Y. (2012) Expression and function of epithelial anoctamins. Exp. Physiol. 97, 184–192 [DOI] [PubMed] [Google Scholar]
- 48. Schreiber R., Uliyakina I., Kongsuphol P., Warth R., Mirza M., Martins J. R., Kunzelmann K. (2010) Expression and function of epithelial anoctamins. J. Biol. Chem. 285, 7838–7845 [DOI] [PMC free article] [PubMed] [Google Scholar]
- 49. Dong H., Smith A., Hovaida M., Chow J. Y. (2006) Role of Ca2+-activated K+ channels in duodenal mucosal ion transport and bicarbonate secretion. Am. J. Physiol. Gastrointest. Liver Physiol. 291, G1120–1128 [DOI] [PubMed] [Google Scholar]
- 50. Silvis M. R., Bertrand C. A., Ameen N., Golin-Bisello F., Butterworth M. B., Frizzell R. A., Bradbury N. A. (2009) Rab11b regulates the apical recycling of the cystic fibrosis transmembrane conductance regulator in polarized intestinal epithelial cells. Mol. Biol. Cell 20, 2337–2350 [DOI] [PMC free article] [PubMed] [Google Scholar]
- 51. Gum J. R., Hicks J. W., Toribara N. W., Rothe E. M., Lagace R. E., Kim Y. S. (1992) The human MUC2 intestinal mucin has cysteine-rich subdomains located both upstream and downstream of its central repetitive region. J. Biol. Chem. 267, 21375–21383 [PubMed] [Google Scholar]
- 52. Holmen Larsson J. M., Karlsson H., Sjovall H., Hansson G. C. (2009) A complex, but uniform O-glycosylation of the human MUC2 mucin from colonic biopsies analyzed by nanoLC/MSn. Glycobiology 19, 756–766 [DOI] [PubMed] [Google Scholar]
- 53. Bennett E. P., Mandel U., Clausen H., Gerken T. A., Fritz T. A., Tabak L. A. (2012) Control of mucin-type O-glycosylation: a classification of the polypeptide GalNAc-transferase gene family. Glycobiology 22, 736–756 [DOI] [PMC free article] [PubMed] [Google Scholar]
- 54. van der Post S., Subramani D. B., Backstrom M., Johansson M. E. V., Vester-Christensen M. B., Mandel U., Bennett E. P., Clausen H., Dahlén G., Sroka A., Potempa J., Hansson G. C. (2013) Site-specific O-glycosylation on the MUC2 mucin protein inhibits cleavage by the Porphyromonas gingivalis secreted cysteine protease (RgpB). J. Biol. Chem. 288, 14636–14646 [DOI] [PMC free article] [PubMed] [Google Scholar]
- 55. Johansson M. E. V. (2012) Fast renewal of the distal colonic mucus layers by the surface goblet cells as measured by in vivo labeling of mucin glycoproteins. PLoS One 7, e41009. [DOI] [PMC free article] [PubMed] [Google Scholar]
- 56. Wiœniewski J. R., Ostasiewicz P., Duœ K., Zielinska D. F., Gnad F., Mann M. (2012) Extensive quantitative remodeling of the proteome between normal colon tissue and adenocarcinoma. Mol. Syst. Biol. 8, 611. [DOI] [PMC free article] [PubMed] [Google Scholar]
Associated Data
This section collects any data citations, data availability statements, or supplementary materials included in this article.